Koch, P. A., F. H. Gardner, J. E. Gartrell, Jr., andJ. R. Carter, Jr. 1975. Biogenesis oferythrocyte membrane proteins: in vivo studies in anemic rabbits. Biochim.
Control of Erythroid Differentiation: Asynchronous Expression of the Anion Transporter and the Peripheral Components of the Membrane Skeleton in AEV- and S13-transformed Cells C a t h e r i n e M. Woods, Brigitte Boyer, Peter K. Vogt,* a n d Elias Lazarides Division of Biology, California Institute of Technology, Pasadena, California 91125; and * Department of Microbiology, University of Southern California School of Medicine, Los Angeles, California 90033. Dr. Boyer'spresent address is Laboratoire d'H6matologie ERA CNRS 500, CHU Piti6-Salp6tri~re, 91, Boulevard de l'H6pita175013 Paris.
Abstract. Chicken erythroblasts transformed with avian erythroblastosis virus or S13 virus provide suitable model systems with which to analyze the maturation of immature erythroblasts into erythrocytes. The transformed cells are blocked in differentiation at around the colony-forming unit-erythroid stage of development but can be induced to differentiate in vitro. Analysis of the expression and assembly of components of the membrane skeleton indicates that these cells simultaneously synthesize t~-spectrin, ~spectrin, ankyrin, and protein 4.1 at levels that are comparable to those of mature erythroblasts. However, they do not express any detectable amounts of anion transporter. The peripheral membrane skeleton components assem-
RYTHROPOIESISin both mammalian and avian species involves a sequence of events whereby a pluripotent stem cell becomes committed to the erythroid cell lineage and thence progresses through at least two replicative progenitor stages, known as burst-forming unit-erythroid (BFU-E) 1 and colony-forming unit-erythroid (CFU-E) stages, before reaching the distinctive erythroblast stages (reviewed in Metcalf and Moore, 1971; Till and McCulloch, 1980). The BFU-E and CFU-E cells have thus far been identified solely in terms of (a) their progeny colony size and hence number of cell divisions from the terminally differentiated erythroid state, (b) their responsiveness to hemopoietic factors such as colony-stimulating factor (interleukin-3) and erythropoietin, and (c) the presence of certain diagnostic surface antigens (Gregory, 1976; Gregory and Eaves, 1978; Samarut and Nigon, 1976; Samarut et al., 1979; Samarut and Bouabdelli, 1980; Till and McCulloch, 1980; Goodman et al., 1985). Part of the terminal differentiation program of these erythroid progenitor cells entails the restructuring of the plasma membrane including the biogenesis of a mem1. Abbreviations used in this paper: AEV, avian erythroblastosis virus; BFU-E, burst-forming unit-erythroid; CFU-E, colony-forming unit-erythroid; MEL, murine erythroleukemia.
© The Rockefeller University Press, 0021-9525/86/11/1789/10 $1.00 The Journal of Cell Biology, Volume 103, November 1986 1789-1798
ble transiently and are subsequently rapidly catabolized, resulting in 20-40-fold lower steady-state levels than are found in maturing erythrocytes. Upon spontaneous or chemically induced terminal differentiation of these cells expression of the anion transporter is initiated with a concommitant increase in the steady-state levels of the peripheral membrane-skeletal components. These results suggest that during erythropoiesis, expression of the peripheral components of the membrane skeleton is initiated earlier than that of the anion transporter. Furthermore, they point a key role for the anion transporter in conferring long-term stability to the assembled erythroid membrane skeleton during terminal differentiation.
brane skeleton, a network of proteins underlying and interacting with the plasma membrane (Branton et al., 1981; Marchesi, 1985). The major component of this network is the heterodimeric protein spectrin, which, in the presence of protein 4.1, interacts with high affinity with short oligomers of actin to form a dense anastomosing network (Branton et al., 1981; Ungewickell et al., 1979; Pinder and Gratzer, 1983; Pinder et al., 1984; Marchesi, 1985). Interaction with the membrane is mediated through the binding of the 13-spectrin subunit to ankyrin (Bennett and Stenbuck, 1979a; Luna et al., 1979; Calvert et al., 1980; Litman et al., 1980) which in turn binds to the cytoplasmic domain of the transmembrane anion transporter (Bennett and Stenbuck, 1979b, 1980; Hargreaves et al., 1980). In mammals, glycophorin may provide additional membrane-binding sites through its interaction with protein 4.1 (Anderson and Lovrien, 1984), but as yet an avian equivalent of glycophorin has not been identified. Synchronized cohorts of proliferative erythroblasts or postmitotic immature erythrocytes can be readily isolated from chick embryos at a stage when they are actively synthesizing and assembling the constituent polypeptides of the membrane skeleton, in sufficient numbers to enable biochemical analysis of their mechanisms of assembly (e.g., Weise and Chan, 1978; Blikstad et al., 1983). Studies with
1789
these erythroid ceils of both the primitive and definitive lineage have indicated that at this stage of erythroid development all members of the erythroid membrane skeleton are expressed simultaneously and accumulate on a per-cell basis by stable assembly (Weise and Chan, 1978; Blikstad et al., 1983; Moon and Lazarides, 1984; Woods and Lazarides, 1985; Staufenbiel and Lazarides, 1986). Hitherto, these studies have not addressed the issue of exactly when in development expression of the components is initiated and whether their expression begins coordinately or asynchronously. Such studies are hindered by the difficulties of identifying erythroid progenitor cells (rather than their daughter colonies) unambiguously and then of isolating them in adequate numbers for biochemical analysis. Avian erythroblastosis virus (AEV)- and S13-transformed erythroid progenitor ceils provide a model system for an alternative approach to investigate the mechanisms underlying initiation of the assembly of this membrane domain. AEVs are replication-defective RNA viruses that cause acute erythroleukemia within 1-2 wk after infection. The target cells in chicken yolk sac and bone marrow appear to be erythroid progenitor cells at the BFU-E stage which then develop to the CFU-E stage before becoming transformed and arrested in development (Gazzolo et al., 1980a, b; Graf et al., 1981; Samarut and Gazzolo, 1982). Transformation abolishes the requirement of these cells for erythropoietin for growth. The AEV ES4 strain is defective in gag and pol sequences which have been replaced by oncogenic erb sequences of cellular origin, v-erb A and v-erb B (Lai et al., 1979; Coffin et al., 1981; Vennstr6m and Bishop, 1982). The v-erb B gene encodes a transmembrane glycoprotein that has tyrosine protein kinase activity and that bears extensive homology with the epidermal growth factor receptor (Hayman et al., 1983; Privalsky et al., 1984; Gilmore et al., 1985; Kris et al., 1985; Yamamoto et al., 1983). The v-erb A gene, which has marked homology with the estrogen receptor (Green, G. L. et al., 1986; Green, S. et al., 1986), is expressed as a gag-erb A fusion protein, localized in the cytoplasm of the transformed cells (Hayman et al., 1979; Bunte et al., 1982). By itself, v-erb A has no transforming activity; rather it appears to potentiate v-erb B activity in addition to reducing the growth requirements of transformed cells and blocking their capacity to differentiate (Graf and Beug, 1978; Grafet al., 1978; Frykberg et al., 1983; Graf and Beug, 1983). The $13 retrovirus represents a different type of erythroleukemic virus to the AEV group of viruses. Its genome of 8.5 kb encodes a transformation-specific glycoprotein, gp155, that is cleaved posttranslationaUy into an 85-kD and 70-kD glycoprotein (Benedict et al., 1985; Beug et al., 1985; Hayman et al., 1985). Although the gp70 polypeptide does not appear to bear much structural resemblance to v-erb B, it possesses protein tyrosine kinase activity and in this respect may be functionally similar to the v-erb oncogenic protein encoded by the AEV genome. The S13 virus also transforms cells at a pro-erythroblast stage, inducing rapid proliferation in an erythropoietin-independent manner but, in contrast to AEV, S13 only partially blocks differentiation and does not eliminate the cells' requirement for complex growth media. We have found that AEV-transformed cells as well as S13transformed cells express peripheral components of the
The sources of avian erythroblastosis virus strain ES4 and of virus S13 have been described (Lai et al., 1979; Beug et al., 1985; Benedict et al., 1985). Single cell suspensions were prepared by mincing the yolk sacs of 7-d-old chicken embryos and filtering the minced tissue through a narrow mesh, stainless steel screen. The cells were centrifuged at 1,000 rpm for 10 min and then suspended in fresh growth medium at a concentration of ~ 2 × 10s cells/nil. For infection with AEV, growth medium consisted of medium F10 and l0 m M Hepes, pH 7.3, 5 x 10⁻⁵ M thioglycerol, and 9% FCS, 8% chicken serum, and 3% NaHCO3 (0.33 M). For infection with S13, the growth medium consisted of medium FI0 containing 10 mM Hepes, pH 7.3, 8 x 10⁻⁵ M mercaptoethanol, 3% NaHCO3 (0.33 M), 8% each of fetal calf and chicken serum, 0.08 % bovine serum albumin, and 5 % water. AEV infection was at a multiplicity of 0.1 for 2 h at 37°C. The AEV-infected cells were then suspended in semi-solid medium consisting of medium F10 with 10 mM Hepes, pH 7.3, 5 x 10⁻⁵ thioglycerol, 2% NaHCO3 (0.33 M), 8% FCS, 5% chicken serum, 5% H20, and 0.9% methocellulose. Infection with S13 either followed the protocol described above for AEV or was accomplished by seeding the yolk sac cells overnight onto a layer of S13-transformed, x-irradiam:l chicken embryo fibroblasts. Suspension of S13-infected yolk sac cells was in a medium consisting of medium F10 with 10 mM Hepes, pH 7.3, 8 x 10⁻⁵ M mercaptoethanol, 2% NaHCO3 (0.33 M), 8% each of FCS and chicken serum, 0.8% BSA, 5% H20, and 0.6% methocellulose. Colonies of transformed cells were picked 14-21 d after infection and were initially plated in the liquid growth media described above. After a given colony had reached cell numbers above 107, culture continued with the same liquid growth media except that F10 was replaced by DME. These cells were found to grow best at densities not exceeding 1 x 10⁶, so consequently they were subcultured generally every third day and invariably the day before an experiment. Under these conditions several clones were found to grow up to 4 mo with a doubling time of ~ 2 4 h. For induction experiments, AEV-transformed cells were transferred to the CFU-E medium de-
The Journal of Cell Biology, Volume 103, 1986
1790
erythroid membrane skeleton, namely ¢t- and 13-spectrin, ankyrin, and protein 4.1. However they do not appear to express the anion transporter as determined by immunoblotting, biosynthetic labeling, and Northern analysis. Kinetic analysis has revealed that in AEV-transformed cells, these peripheral components of the membrane skeleton are synthesized in a short labeling period at levels equivalent to the levels found in proliferative primitive erythroid cells. These proteins inefficiently assemble into a membrane skeleton which is then turned over. In contrast, no detectable turnover of newly synthesized assembled protein occurs in maturing primitive erythroblasts. Initiation of spontaneous or chemically induced terminal differentiation of transformed cells is associated with induction of expression of the anion transporter; this is paralleled by an increase in the steady-state levels of the peripheral components of the membrane skeleton. These results indicate that expression of the peripheral components and the anion transporter are independently regulated during erythroid development; initiation of the expression of the peripheral components occurs early in development (by the CFU-E stage) while the expression of the anion transporter is intimately coupled with terminal differentiation. Furthermore, the extent of accumulation of the peripheral skeletal components that occurs during erythroid terminal differentiation is regulated by an increase in the stability of the assembled polypeptides rather than by their transcriptional up regulation. The results point to a key role for the anion transporter in conferring long-term stability to the erythroid membrane skeleton during terminal differentiation.
Materials and Methods Viruses and Cells
scribed by Beug et al. (1982a) containing 1 mM butyrate and 1 U/ml erythropoietin (Amgen, Thousand Oaks, CA). Mitotic primitive erythroblasts were isolated from 3.5-4-d chick embryos by carefully excising the embryo and surrounding blood islands from the egg, teasing them apart and letting them bleed into MEM supplemented with 2 % FCS. The cells were passed through several layers of cheesecloth and then through cotton wool before washing three times in MEM, 2 % FCS. The cells were then incubated for 30 min in methionine-free medium before labeling experiments.
Labeling Experiments AEV cells were washed three times in methionine-free DME before suspending in labeling medium (methionine-free DME, 10% dialyzed FCS, 5 × 10⁻⁵ M thioglycerol) to preincubate for 20 rain at 37.5°C in a humidified atmosphere containing 5% CO2. For pulse-chase experiments, 7 × 10⁷ cells were suspended in 5 ml of labeling medium containing 600 ~Ci [35S]methionine and incubated for 8 rain before pelleting the cells (total labeling time 10 min). Cells were resuspended in normal growth medium containing 2 mM unlabeled methionine and divided into aliquots of 107 cells for further incubation. The aliquots of cells were sampled at appropriate intervals of chase time and added to excess ice-cold medium for processing. For continuous pulse experiments aliquots of cells were labeled with 200 ~tCi[35S]methionine at a starting density of 106 cells/ml in labeling medium supplemented with 2 ~tM methionine in order to prevent methionine deprivation. The cells were lysed sequentially in identical volumes of hypotonic (10 mM Tris-HCl, pH 7.4, 5 mM MgC12, 2 mM EGTA, 2 mM phenylmethylsulfonyl fluoride [PMSF], and 1 mM aprotinin) and 0.5% Triton X-100 lysis buffer (130 mM NaCI, 10 mM Tris-HC1, 5 mM MgCI2,
2 mM EGTA, 0.5% Triton X-100, 2 mM PMSE 1 mM aprotinin), taking care to resuspend ghosts with a minimum of agitation. The final pellet was resuspended in an equal volume of hypotonic buffer. All these operations were carried out at 4°C. This yielded an operationally defined cytoplasmic (hypotonic lysate), noncross-linked membrane-associated (Triton lysate) and insoluble (cytoskeletal plus nuclear) fraction respectively, as described previously (Woods and Lazarides, 1985). Samples were denatured by addition of 1/$ vol 5% SDS, 5 mM EGTA, 10 mM Tris-HCI, pH 7.4, 2 mM I~-mercaptoethanol followed by sonication for the insoluble fractions. Each lysate for each time point was divided into equal aliquots, precleared with preimmune serum before immunoprecipitation with anti-etspectrin (Repasky et al., 1982), anti-l]-spectrin (Nelson and Lazarides, 1984), anti-ankyrin (Nelson and Lazarides, 1984), anti-protein 4.1 (Granger and Lazarides, 1984a) and anti-anion transporter (Cox et al., 1985) specific antibodies. Immunoprecipitation, autoradiography, and quantitation of labeled protein was carried out as described previously (Woods and Lazarides, 1985).
Immunoblotting Cells were washed twice in DME and then solubilized either directly in SDS sample buffer or after making hypotonic, 0.5% Triton X-100 and insoluble fractions to give the equivalent of 106 cells per 25 I~1 of final SDS sample. Samples were subjected to 7.5% SDS PAGE and transferred to nitrocellulose. Filters were probed with one of the antibodies mentioned above or anti-vimentin (Granger and l.ztzarides, 1982) at a dilution of 1:1,000, washed and probed with U~l-protein A (Granger and Lazarides, 1984a). After exposure to Kodak XAR-5 film, labeled bands were cut out and counted on a gamma counter. Quantitative results were ensured by using cell loadings
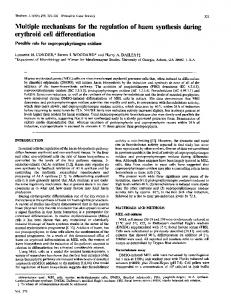
Figure 1. AEV-
and S13-transformed erythroid cells express the peripheral components of the membrane skeleton but not the anion transporter. Immunoblots of 3 x 10⁵ mature chicken erythrocyte ghosts (lanes 1 ) or the Triton X-100insoluble (lanes 2) and -soluble (lanes 3) fractions from 3 x 10⁶ AEV-cells (A) or S13 cells (B). Ank, ankyrin; aS, a-spectrin; /IS, ~spectrin; 4.1, protein 4.1; AT, anion transporter. Antigens designated by dots. The differences in the relative amounts of the 4.1 variants between Fig. 1 A (AEV) and 1 B (S13) are due to differences in exposure time.
Woods et al.
Controlof EtythroidDifferentiation
1791
within the range that gave linear increases in signal (1-6 × 10s cells/lane) and by reducing the number of mature chick erythrocyte ceils loaded as standard to give a signal close to that obtained with transformed cells.
a-Spectrin [3-Spectrin, Ankyrin, and Protein 4.1 Are Associated with the Plasma Membrane of Transformed Cells
RNA Isolation and Analysis
To establish where the spectrins, ankyrin, and protein 4.1 were localized in transformed cells, we carried out indirect immunofluorescence. All of these proteins appeared to localize at the plasma membrane (data not shown). To examine their localization further, we analyzed their solubility properties. With both types of transformed cells, these proteins cannot be detected at steady state in the hypotonic lysate; rather they appear to be partitioned between a Triton-soluble and cytoskeletal pool, with similar ratios of the four polypeptides within each pool (Table I). When developing and mature erythrocytes are lysed in hypotonic or Triton X-100-containing buffers the spectrins, ankyrin, and protein 4.1 remain quantitatively insoluble at steady state. This is a consequence of their being cross-linked into a skeletal array (Yu et al., 1973; Woods and Lazarides, 1985; Staufenbiel and Lazarides, 1986). Therefore, the solubility properties of these proteins in transformed cells are consistent with the interpretation that these proteins are associated with the plasma membrane but suggest that they are inefficiently cross-linked into a cytoskeleton. No difference in the patterns of 13-spectrin and protein 4.1 variants are seen between the Tritonsoluble and -insoluble pools (Fig. 1). Ankyrin, however, shows the typical erythrocyte pattern in the insoluble fraction
Cytoplasmic RNA was isolated using the phenol method described in Moon et al. (1985) from either 109 erythroblasts from 9-d embryos or 5 × 10⁸ AEV-transformed cells. Poly(A) ÷ RNA was purified through oligo-(dT) cellulose according to the method of Aviv and I.e,der 0972). Northern analysis was performed as described by Ngai et al. (1984). Essentially RNA was separated on a 1.2% agarose gel containing 6% formaldehyde and transferred to nitrocellulose for 10 h before being baked. Subsequently one set of lanes was probed with a vimentin-specific 32p-labeled probe (Ngai et al., 1984) and the duplicate set of lanes was probed with a 32p-labeled probe specific for anion transporter transcripts (Cox et al., 1985).
Results Expression of Peripheral Components of the Erythroid Membrane Skeleton in AEV- and S13-transformed Cells Steady-state protein analysis carried out by immunoblotting revealed that AEV-transformed cells express ct-spectrin, ~-spectrin, ankyrin, and protein 4.1 (Fig. 1 A). A similar result is also observed with S13-transformed cells (Fig. 1 B). Quantitation of irnmunoblots of AEV cell extracts showed that the steady-state levels of a-spectrin, ~spectrin, ankyrin, and protein 4.1 were '~1/5, 1/24, 1/29, and ~1/50, respectively, of the levels found in mature erythrocytes (Table I). These translate to ratios of 13-spectrin to ankyrin to protein 4.1 of ,'~1:0.5:0.5 (Table I) which is similar to the ratios of these proteins found in mitotic primitive erythroblasts (Staufenbiel and Lazarides, 1985). Similar values were found with S13transformed erythroid cells except that these cells appeared to express even lower levels of ankyrin that translated to a 13-spectrin/ankyrin ratio of ~4:1 (Table I). The ratio of 5:1 found for a-spectrin to [3-spectrin in both types of transformed cells exceeds the 1:1 stoichiometry observed in developing and mature erythrocytes; this we presume to reflect the concurrent expression of a non-erythroid form of spectrin, a't-spectrin, but in the absence of a probe for 7-spectrin we could not verify this. Fifteen different AEV-transformed clones were analyzed to check the degree of variation existing between different transformed cell lines. All gave identical quantitative and qualitative steady-state patterns of these proteins (data not shown). Both the AEV and $13 cells express a similar pattern of variants of protein 4.1, the 155-, 145-, 87-, and 77-kD variants although the upper variants appear to be the more dominant ones in S13-transformed cells (Fig. I). This pattern differs from the pattern of variants seen in postmitotic erythrocytes; rather they appear to bear a greater similarity to the pattern observed in proliferative primitive or definitive cells (Granger and Lazarides, 1984b; Staufenbiel and Lazarides, 1986) except that in these latter cells the 77-kD variant is more abundant. The same two variants of ~-spectrin that exist in immature and mature chick erythrocytes are seen in both types of transformed cells, a major variant of apparent Mr 220,000 and a minor variant with an apparent Mr of ~225,000. Likewise the pattern of ankyrin variants observed in transformed cells is similar to the pattern observed in mature chick erythrocytes (Fig. 1).
The Journal of Cell Biology, Volume 103, 1986
Table L Steady-stateRatios of the Peripheral Components of the Membrane Skeleton in TransformedErythroid Cells Protein
Adult Erythrocyte/ AEV
AEV-transformed erythroid cells a-Spectrin 5.2 + 0.6
13-Spectrin Ankyrin Protein 4.1 Anion transporter Vimentin
23.3 29.0 51.1 ND 5.0
+ 2.8 + 3.2 + 8.2 + 0.8
S13-transformed erythroid cells a-Spectrin 4.1
13-Spectrin Ankyrin Protein 4.1 Anion transporter Vimentin Induced AEV cells a-Spectrin 13-Spectrin Ankyrin Protein 4.1 Anion transporter
21.6 50.8 39.4 ND 3.6 4.2 13.1 16.7 26.5 10.8
INSOL/TX
Steady-state ratio of antigen to 13-spectrin
1.9
4.66 + 0.24
4.5 2.4 1.2 -
1.0 0.49 + 0.07 0.44 + 0.09 -
1.2 2.2 2.1
5.2 1.0 0.22
1.0
0.55
3.2 1.0 0.4
0.5 1.2
Labeled bands from immunoblots such as the ones shown in Fig. 1 were cut out and counted in a gamma counter. Then the following parameters were calculated: the steady-state ratio of each antigen in a population of transformed erythroid cells compared to mature chick erythrocytes; the steady-state ratio between the Triton-soluble (TX) and -insoluble (INSOL) fractions from transformed cells; and the steady-state ratio of each antigen with respect to I~-spectrin existing in transformed cells. The data for AEV-transformed erythroid cells represent the mean of five experiments +SE. The data for S13transformed erythroid cells and induced AEV ceils represent the mean result of two experiments. The data for the induced cells represent the average data for a population of 3 × 10⁶ AEV cells out of which 24% are strongly positive for hemoglobin and 23% are weakly positive.
1792
2,000~X (I-SpeOrm
but in the Triton-soluble pool the lower variant (~-goblin of Nelson and Lazarides, 1984) is replaced by a variant of slightly higher apparent molecular weight (Fig. 1). However, since the apparent M, of chicken ankyrin differs on different percentage SDS PAGE (data not shown), it is unclear at present what the differences in apparent Mr might signify. This awaits further investigation.
The Lower Steady-state Levels of Spectrin, Ankyrin, and Protein 4.1 in AEV-transformed CeUs As Compared with Erythrocytes Are Due to Different Rates of Catabolism The lower steady-state levels of the peripheral components of the erythroid membrane skeleton observed in transformed cells as compared to mature erythrocytes could arise from lower rates of synthesis, different rates of catabolism, or a combination of the two. Short-term pulse labeling (10 min) was used to compare the amounts of labeled peripheral polypeptides synthesized in identical numbers of AEV-transformed cells, mitotic erythroblasts from 3.5--4-d embryos, and postmitotic immature erythrocytes from 10 and 14 d embryos (stages when these proteins are accumulating in the membrane skeleton on a per-cell basis (Blikstad et al., 1982; Moon and Lazarides, 1984; Woods and Lazarides, 1985). Surprisingly, the AEV cells synthesized these proteins on a per-cell per-unit time basis, at amounts that were equivalent to the amounts synthesized by mitotic erythroblasts and that were close to 10-fold greater than the amounts synthesized during a 10-min labeling period in postmitotic immature erythrocytes (Table II). Therefore, the low steady-state levels of these peripheral components in transformed cells compared to erythrocytes could not be accounted for by low rates of synthesis. Kinetic pulse chase analysis revealed that in AEV cells, a portion of newly synthesized t~-spectrin, 13-spectrin,, ankyrin, and protein 4.1 polypeptides entered a Triton-soluble compartment and a portion became Triton-insoluble, i.e., cytoskeletal (Fig. 2). The excess hypotonic pools rapidly disappeared. The Triton-soluble pools of all of these proteins turned over in an apparently biphasic manner with an initial t,4 of 45-60 min. Only a small portion of this loss could be accounted for by transfer into the insoluble pool. Thus it appears that most of the decline in this pool was due to rapid degradation. The insoluble pools also turned over, although with a slightly longer t,/, than the Triton-soluble pools. In-
f
,,°°°r\
/~-Spectrim
oo~×
~.
so~\×\
251 k
I
I
I
n-
I~, iO0 |
X ~ x I I I Protein 4..1
I
I
I
!
I
5
250
~_50
5O
5O
25
25
tO 0
i\
i
2 4
I
6
I
8
IkO IJ2
I
i
o 2 4
~
6
8 Io
TIME OF CHASE [HOURS)
Figure2. Kinetic analysis of the fate of newly synthesized polypeptides in AEV-transformed cells. AEV cells were pulsed for 10 min with [3~S]methionineand then divided into seven aliquots that were chased in a medium containing excess unlabeled methionine for up to 12 h. The aliquots of cells were fractionated into a hypotonically soluble (open triangle), Triton X-100-soluble (X) and -insoluble (solid circle) fraction. The labeled a-spectrin, ~spectrin, ankyrin, and protein 4.1 were quantitated as described in Materials and Methods; values are expressed as the logarithm of relative peak areas and represent the mean value from four experiments. The data have not been corrected for any increase in cell numbers that occurred due to cell division during the chase period; rather they reflect the fate of the labeled polypeptides.
3 x 10⁶ cells were labeled for 10 min with [3~S]methionine and the amounts of labeled spectrins and ankyrin synthesized during this period were quantitated by immunoprecipitation followed by autoradiography. The data are expressed as amounts synthesized relative to the amounts synthesized in erythroid cells from 10-d embryos.
soluble a-spectrin had a longer t,~ than the other polypeptides of ,o8 h whereas insoluble 13-spectrin, ankyrin, and protein 4.1 (all variants behaved in an identical fashion) all turned over with a t,~ of ,o4.5 h (Fig. 2). Continuous pulselabeling experiments indicated that the insoluble pools plateau around 4 h which confirms the fairly rapid turnover of these assembled proteins in AEV-transformed cells (data not shown). It should be noted that these half lives are considerably shorter than the doubling time (22-24 h) for these cells, so it seems unlikely that this instability could be linked to the fact that these cells are proliferating during this period of chase time. To distinguish between the possibility that the instability of the assembled pools of the spectrins, ankyrin, and protein 4.1 might be a consequence of the cells being a population of proliferative cells rather than being a feature unique to these cells and the stage of erythroid development that they represent, the fate of newly synthesized proteins in mitotic primitive erythroblasts from 3.5-4-d chick embryos was compared. Erythroblasts at this stage have been reported to have a doubling time of 17.5 h (Weintraub et al., 1971), i.e., similar to the doubling time of AEV-transformed erythroid cells. As seen in Fig. 3, the assembled pools in these cells appeared to be stable with no evidence of turnover during the chase time monitored (8 h).
Woods et al. Control of Erythroid Differentiation
1793
Table II. The Relative Amounts of Labeled a-Spectrin, fl-Spectrin, and Ankyrin Synthesized during a l O-min Labeling Period Relative amounts of the peripheral polypeptides synthesized Protein
AEV cells
Erythroblasts from 3-4-d embryos
Erythroid cells from 10-d embryos
a-Spectrin 13-Spectrin Ankyrin
10.6 9.4 4.7
12.9 10.1 10.4
1 1 1
ZpO(
,xcZ o.
~ - Spectrin
I,OOC
_
O/°~Q"
•
50(]
z
20(:
A E V and $13 Cells Express Anion Transporter upon Spontaneous or Chemically Induced Differentiation
~oc
~
1985) failed to detect the presence of any anion transporter transcripts in cytoplasmic mRNA from AEV-transformed cells. In contrast a vimentin-specific cDNA probe detected vimentin-specific transcripts in the RNA from AEVtransformed erythroid cells (as a control, data not shown).
5c
< I
I
I
i
Anon tronsoorter
i
x.
Ankyrin
,
i
L
~
~: I,OOC
,X\/o_,
50C 25C
o
(
IOC
i
2
3
4
5
6
7
8
i
2
~
4
5
6
7
8
TIME OF CHASE (HOURS)
Figure 3. Kinetic analysis of the fate of newly synthesized polypeptides in mitotic primitive erythroblasts from 3-4-d chick embryos. Cells were pulse-labeled and fractionated exactly as described for AEV cells. The amounts of labeled ¢t-spectrin, ffspectrin, ankyrin, and the anion transporter in the hypotonically soluble (open triangle), Triton-soluble (X) and -insoluble (solid circle) fraction as a function of chase time are expressed in logarithmic form.
AEV- and S13-transformed Erythroblasts Do Not
Express Anion Transporter In contrast to the peripheral components of the membrane skeleton, immunoblotting with anti-anion transporter-specific antibodies failed to detect the presence of anion transporter in either AEV- or S13-transformed erythroid precursor cells. Using serial dilutions of the erythrocyte standard, we calculated that we should have been able to detect down to 1/125the levels of anion transporter found in erythrocyte membrane skeletons. Since the stoichiometry of the different components in the mature membrane skeleton is known, it is possible to use the erythrocyte standard to calculate the stoichiometry that exists in the AEV-transformed cells. As shown in Table I, the ct-spectrin/13-spectrin/ankyrin/protein 4.1 ratio is '~5:1:0.5:0.5 in AEV cells with similar values for undifferentiated S13 cells. In the mature erythrocyte membrane skeleton, the ratio of ankyrin to anion transporter is 1:1 with the skeletal-bound anion transporter accounting for only 1/6 the total amount of anion transporter (Bennett and Stenbuck, 19"/9b; Hargreaves et al., 1980; Branton et al., 1981; Nelson and Lazarides, 1984). Therefore, even if the transformed cells do contain trace levels of anion transporter, it is far below the levels relative to other skeletal components seen in erythrocytes and developing erythroid cells (see Fig. 3). Labeling experiments failed to detect the synthesis of the anion transporter in AEV-transformed cells. In contrast, proliferative erythroblasts synthesized high levels of anion transporter (Fig. 3). Although a large portion of the Tritonsoluble pool turned over, a fraction of mature anion transporter assembled into the skeletal fraction in a stable manner. Northern analysis corroborated the lack of synthesis of anion transporter in AEV-transformed cells. As demonstrated in Fig. 4 an anion transporter-specific cDNA probe (Cox et al.,
The Journal of Cell Biology, Volume 103, 1986
AEV-infected erythroid progenitor cells have a finite growth potential, generally extending over 3--4 mo. Thereafter, the cells appear to initiate differentiation spontaneously and then die. A similar sequence of events can be induced chemically by the addition of butyrate (1 mM) to the culture medium supplemented with 1 U/ml erythropoietin (Keane et al., 1979). Unlike murine erythroleukemia cells, AEV cells do not respond to DMSO (Keane et al., 1979; Graf and Beug, 1982). Initiation of differentiation, whether spontaneous or chemically induced, was associated with the appearance of the anion transporter "-3 d after induction as detected by immunoblotting (Fig. 5) or immunofluorescence (data not shown). This was coupled with increased steady-state levels of 13-spectrin, ankyrin, and protein 4.1 as judged by immunoblotting analysis (Table I). Before induction,