ABSTRACT. For many computer vision applications, detection of blobs and/or tubular structures in images are of great importance. In this paper, we have ...
COOPERATIVE USE OF PARALLEL PROCESSING WITH TIME OR FREQUENCY-DOMAIN FILTERING FOR SHAPE RECOGNITION Carlos Graca? ?
Gabriel Falcao?
Sunil Kumar†
Isabel N. Figueiredo†
Instituto de Telecomunicac¸o˜ es, Dept. of Electrical and Computer Eng., University of Coimbra, Portugal † CMUC, Dept. of Mathematics, University of Coimbra, Portugal ABSTRACT
For many computer vision applications, detection of blobs and/or tubular structures in images are of great importance. In this paper, we have developed a parallel signal processing framework for speeding up the detection of blob and tubular objects in images. We identified filtering procedure as being responsible for up to 98% of the global processing time, in the used blob or tubular detector functions. We show that after a certain dimension of the filter it is beneficial to combine frequency-domain techniques with parallel processing to develop faster signal processing algorithms. The proposed framework is applied to medical wireless capsule endoscopy (WCE) images, where blob and/or tubular detectors are useful in distinguishing between abnormal and normal images. Index Terms— Object shape recognition, Convolution, Frequency-domain filtering, Parallel processing, Wireless capsule endoscopy 1. INTRODUCTION In the field of computer vision, blob/tubular detection refers to methods that are aimed at detecting clustered points in the image that are either brighter or darker than the surrounding. Detection of blob and/or tubular structures in images is an important step in the analysis of a large-scale of scientific data, as for example, detection of bleeding/blood regions in WCE images [1, 2], nodule detection in thorax x-ray images citesch, nuclei detection in microscopic zebrafish images [3], enhancement of vascular structures [4,5], detection of lesions in images of multiple sclerosis patients [6], and so on. In this paper it is proposed a parallel signal processing framework which accelerates significantly the performance of particular blob and tubular detectors. These latter rely on the eigenvalues of the Hessian of the processed input image [5], which involve the calculation of second derivatives, at multiple scales, using Gaussian filtering. We identified this filtering process as being responsible for a large part of the global processing time, which turns it a natural candidate for parallelization. Recently, graphics processing units (GPU) have shown significant speedups for signal processing algorithms in med-
ical imaging areas that require intensive computation [7, 8]. This technology supports specialized parallel kernel development and efficient signal processing libraries that suit well into a variety of biomedical image processing applications. We propose to cooperatively exploit time- or frequencydomain signal processing techniques combined with more efficient parallel processing. These algorithmic transformations allow producing faster code that can accommodate multi-thread based parallelism with an appropriate use of the system’s memory hierarchy and coalesced memory accesses for performing the most compute-intensive procedures on the GPU. We show that depending on the filter size, different domains and architectures can be adopted. For example, for large filters the GPU-based frequency-domain approach obtains higher speedups, while for smaller filters the separable time-domain approach on the GPU performs faster. Finally, we show an application of the proposed parallel blob and tubular detector algorithm in the medical field, for bleeding/blood detection in WCE images [1, 2]. Note that WCE examination of a patient produces approximately 56000 images. Hence, a major and relevant direct application of the proposed framework is the acceleration of an automated WCE image analysis. In addition, the proposed parallelized procedure can also be incorporated in many other applications (see for instance [3–6, 9]), where blob and/or tubular detectors might be used. After this short introduction, the rest of the paper is structured as follows. Section 2 introduces the blob and tubular detectors. Section 3 describes the parallelization of blob and tubular detectors. An application to medical images is analyzed in Section 4, and finally some conclusions are given in Section 5.
2. SHAPE-BASED OBJECT RECOGNITION The definition of the blob and tubular detectors used herein rely on appropriate functions that involve the Hessian eigenvalues of the input image and on a multiscale analysis approach. For a scalar image I : Ω ⊆ R2 → R, we define the Hessian matrix at a point (or equivalently at a pixel location)
� Hs (x, y) =
s Ixx s Ixy
s Ixy s Iyy
� .
s s s Here Ixx , Ixy and Iyy are the second-order partial derivatives of I and the scale s is involved in the calculation of these derivatives using Gaussian filtering. The Hessian matrix describes the second order local image intensity variations around the selected point. Suppose λs,1 and λs,2 are two eigenvalues of the Hessian matrix Hs . Note that at a point belonging to a blob region, these two eigenvalues have the same sign (the sign is an indicator of the brightness/darkness of the blob: if positive it is a dark blob on a bright background, and if negative it is a bright blob on a dark background) and similar magnitudes. If the point belongs to a tubular structure (like a ridge) one of the eigenvalues is close to zero and the others absolute value is large. Moreover the tubular structure is bright (resp. dark) if the eigenvalue with highest absolute value is negative (resp. positive) (see [5]). Without loss of generality we assume that |λs,1 |≤ |λs,2 |. Defining now
f1 = exp
� −βFs2
Calculation of Hessian 2D Matrix
scale s
(x, y), and for a scale s, by
� and f2 =
1 − exp −α
λs,1 λs,2
�2 !! ,
and motivated from [5], we define the blob (Bs ) and tubular (Ts ) detectors (at each point of the domain), by
Make kernel coordinates and 2nd Gaussian Derivatives
DGaussxx DGaussxy DGaussyy
Pre-processed image Filter Size: (6s+1)x(6s+1)
Ixx Ixy Iyy
Scale Values Out=s² Ixx
Ixx scaled
Scale Values Out=s² Ixy
Ixy scaled
Scale Values Out=s² Iyy
Iyy scaled
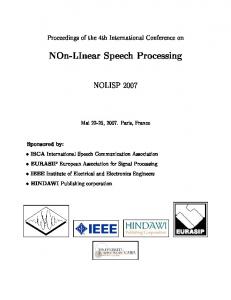
Fig. 1: Block diagram explaining the computation of the Hes-
sian matrix for each scale s (Ixx, Iyy, Ixy are the notations for the second-order partial derivatives of image I).
and frequency-domain approaches for calculating the filtering procedure (involved in computing the Hessian matrix), and it is also tested under different execution environments and platforms. The function used to perform the filtering in the time-domain (C/CPU) was released by NVIDIA [10] and in frequency-domain (C/CPU), we used the optimized FFTW3.3.3 library [11]. We find out that the vast majority of time spent processing each image is being consumed by the filtering process (see Tables 1 and 2), which is heavily used for the calculation of the Hessian matrix. As depicted in Fig. 1, three filters are applied for each scale s with a filter size (6s + 1) × (6s + 1).
3.1. GPU parallelization � Bs =
0, if λs,1 λs,2 < 0 or |λs,2 − λs,1 |> δ (1 − f1 )f2 , otherwise, (1)
and � Ts =
0, if λs,2 > 0, (1 − f1 )(1 − f2 ), otherwise.
(2)
Here α and β are the parameters which control the sensitivity of the functions and δ is the user chosen threshold. In order to automatically detect blobs (or tubes) of different sizes, a multiscale approach is necessary. The response of the detector functions will be maximum at a scale that approximately matches the size of the structure (blob or tube) to detect. Hence, we define the final detector functions as follows: B=
max
smin ≤s≤smax
Bs
and
T =
max
smin ≤s≤smax
Ts ,
where smin and smax are the minimum and maximum scales at which the structures are expected to be found. 3. PARALLELIZATION OF THE SHAPE-BASE OBJECT RECOGNITION PROCEDURE The procedure for detecting blob and tubular structures in images, described in Section 2, is implemented using time-
The parallelization of the procedure for detecting blob and tubular structures in images, described in Section 2, is carried out using the Compute Unified Device Architecture (CUDA) parallel programming model, by exploiting the massive use of thread- and data-parallelism on the graphics processing units (GPU). CUDA allows the programmer to write in a transparent way, scalable parallel C code [12] on GPUs. When the host launches a kernel, the GPU device executes a grid of thread blocks, where each block has a predefined number of threads executing the same code segment.
3.1.1. Parallelization with Separable 2D Filtering We perform a benchmark of CUDA separable filtering (TimeDomain) [10]. This version uses global memory, constant memory and shared memory as described below in Algorithm 1 .
3.1.2. Parallelization with FFT 2D Filtering Following a frequency-domain strategy, we also perform a benchmark of CUDA FFT2D filtering (Frequency-Domain) [13]. This version uses global memory as described in Algorithm 2 .
Version & platform SEP Time-Domain (CPU) Frequency-Domain (CPU) SEP Time-Domain (GPU) Frequency-Domain (GPU)
TUBULAR exec. time(s) 4.0597 0.5209 0.2372 0.4149
Filtering (% of TUB. exec. time) 94.3720 68.4008 0.5011 7.4623
BLOB exec. time (s) 4.2253 0.5299 0.2419 0.3773
Filtering (% of BLOB exec. time) 94.5556 68.2204 0.4900 7.6093
Table 1: Total computation times (in seconds) for TUBULAR and BLOB object-shape detection, and the time percentages (with respect to the total time) of the filtering step, for the different versions and platforms. Tests done with (576 × 576 pixel) WCE images, applying a total of 12 filters (3 for each dimension) with sizes: 49 × 49, 61 × 61, 73 × 73, 85 × 85 for TUBULAR test and 49 × 49, 61 × 61, 73 × 73, 97 × 97 for BLOB test (SEP is the notation for Separable Filtering). Version & platform SEP Time-Domain (CPU) Frequency-Domain (CPU) SEP Time-Domain (GPU) Frequency-Domain (GPU)
TUBULAR exec. time(s) 108.1980 5.5730 3.1628 2.2628
Filtering (% of TUB. exec. time) 98.18 74.4302 6.1323 2.8915
BLOB exec. time (s) 113.221 5.411 3.6096 2.2924
Filtering (% of BLOB exec. time) 97.9193 73.4984 5.66 3.3429
Table 2: Total computation times (in seconds) for TUBULAR and BLOB object-shape detection, and the time percentages (with respect to the total time) of the filtering step, for the different versions and platforms. Tests done with (1728 × 1728 pixel) WCE images, applying a total of 12 filters (3 for each dimension) with sizes: 145 × 145, 181 × 181, 217 × 217, 253 × 253 for TUBULAR test and 145 × 145, 181 × 181, 217 × 217, 289 × 289 for BLOB test (SEP is the notation for Separable Filtering).
Algorithm 1 Separable (SEP) Filtering CUDA Algorithm 1: (load image) Load image to CPU memory 2: (compute filter) Compute 1D filter’s on CPU (Rows and Column) 3: (CPU→GPU memory transfer) Copy image and filter data to GPU Global memory 4: (GPU memory transfer) Copy rows and columns filter data to GPU Constant memory 5: (GPU memory transfer) Copy image data to GPU Shared memory 6: (convolve rows) Convolve image rows with row filter, each thread computes just one pixel from reading N(filter lenght) neighbor pixels of image by sharing memory between threads of the same block 7: (GPU memory transfer) Store results on buffer in GPU global memory 8: (GPU memory transfer) Copy buffer from GPU global memory to GPU shared memory 9: (convolve columns) Convolve buffer columns with column filter, each thread computes just one pixel from reading N(filter length) neighbor pixels of buffer by sharing memory between threads of the same block 10: (GPU memory transfer) Store filtering results in Global memory 11: (GPU→CPU memory transfer) Copy filtering results to CPU memory
Algorithm 2 FFT2D Filtering CUDA Algorithm 1: (load image) Load image to CPU memory 2: (compute filter) Compute 2D filter on CPU 3: (CPU→GPU memory transfer) Copy image data and filter data to GPU Global memory 4: (compute FFT2D) Convert image and filter to (Frequency-Domain) using ”cuFFT” FFT2D 5: (multiply”convolve”) Perform the point-wise multiplication of the FFT of image and filter (Complex Number Multiplication), each thread processes just one pixel, reading one entry from image and one entry from filter to perform the two complex number multiplication 6: (compute IFFT2D) Convert result to (Time-Domain) using ”cuFFT” IFFT2D 7: (GPU→CPU memory transfer) Copy filtering result data to CPU memory
4. APPLICATION TO MEDICAL IMAGES In this section we apply the methodoloy proposed in this work to wireless capsule endoscopy (WCE) images with 576 × 576
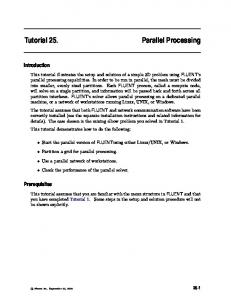
pixel and correspondent resized images with 1728 × 1728 pixel (in order to demonstrate the potential of this approach for high resolution images). A sequential version of blob and tubular detectors was utilized in [1,2] for developing an automated algorithm to distinguish between abnormal (bleeding and/or blood) and normal images. We refer the reader to [1] for more details. The program is developed using CUDA driver 5.5 and the C/C++ code compiled with GCC-4.6.3. The host system has an Intel Core i7 950 CPU @ 3.07GHz and runs the GNU/Linux kernel 3.8.0-31-generic. The GPU device consists of a Geforce GTX 680 with 1536 CUDA cores. The global filtering times, corresponding to the proposed the blob and tubular detectors, for 576×576 WCE images are shown in Fig. 2a), and for the resized 1728 × 1728 images are shown in Fig. 2b). The Fig. 3 (a) displays two examples of WCE images, having abnormalities, and columnn (b) shows the correspondent scalar input images for the blob and tubular detectors [1, 2]. The last column (c) exhibits the abnormal regions successfully detected (bleeding, with the shape of a blob, for the top image and blood, with the shape of a tube, for the bottom image). As depicted comparing Fig. 2a) and Fig. 2b), the timedomain filtering on GPU performs faster than the frequencydomain for 576 × 576 images and the frequency-domain filtering on GPU performs faster for 1728 × 1728 images. The size of the filter applied depends on the size of the objects that we want to identify, consequently, larger images require larger filters, assuming that images is of the same scene. For smaller filters, the time-domain method is faster because this method uses shared memory and the shared memory is fast and seen by all threads within the same block. So we can have several threads processing the same local data to opti-
Execution Time (s)
Execution Time / Filter Size TUBULAR −CPU Time TUBULAR −CPU Freq. TUBULAR −GPU Time TUBULAR −GPU Freq. BLOB −CPU Time BLOB −CPU Freq. BLOB −GPU Time BLOB −GPU Freq.
0
10
−2
10
−4
10
49
61
73 Filter Size (NxN) pixel
85
97
(a) Execution time for images with 576×576 pixel. Execution Time / Filter Size
2
Execution Time (s)
10
TUBULAR −CPU Time TUBULAR −CPU Freq. TUBULAR −GPU Time TUBULAR −GPU Freq. BLOB −CPU Time BLOB −CPU Freq. BLOB −GPU Time BLOB −GPU Freq.
0
10
−2
10
145
181
217 Filter Size (NxN) pixel
253
289
(b) Execution time for images with 1728×1728 pixel. Fig. 2: Global filtering processing times for BLOB and TUBULAR shape detections, varying the filter size and platform. The tests were performed on WCE images, applying 3 filters for each dimension.
mize memory bandwidth, but when filter size increases the shared memory used increases too. Shared memory are typically small in size. Therefore, we need to reduce the block size and this action increases the amount of data exchanges with global memory and the number of memory accesses will increase and slow down the process. On the other hand, in the frequency-domain approach, for larger filters we can set a fixed block size, thus using global memory more efficiently.
5. CONCLUSIONS We have devised a parallel signal processing framework for detecting blob and tubular structures in images which can be helpful in many computer vision applications. The proposed framework is applied to wireless capsule endoscopy images for detecting bleeding/blood regions. The filtering process represents the functionality with higher impact in the global processing time, so we implemented several versions and we conclude that time-domain approaches executing on GPU are faster for small filters and that frequency-domain GPU methods are more efficient for larger filters. Through parallelization of the algorithm, we obtain a speedup up to 17x on images with 576 × 576 pixel and up to 49x on images with 1728 × 1728 pixel. To the best of our knowledge, this is the first GPU-accelerated algorithm to process WCE images in
order to speed up the findings of blood/bleeding regions. Furthermore, this proposed approach has the potential to be used in many other applications, as those mentioned in Section 1. ACKNOWLEDGEMENTS This work was partially supported by project PTDC/MATNA N/0593/2012 from CMUC and FCT (Portugal) through the European program COMPETE/ FEDER, and also by projects PEst-C/MAT/UI0324/2011 and PEst-OE/EEI/LA0008/2013 from Instituto de Telecomunicac¸o˜ es. REFERENCES [1] I. N. Figueiredo, S. Kumar, Carlos Leal, and Pedro N. Figueiredo, “Computer-assisted bleeding detection in wireless capsule endoscopy images,” Computer Methods in Biomechanics and Biomedical Engineering: Imaging & Visualization, vol. 1, pp. 198–210, 2013. [2] I. N. Figueiredo, Sunil Kumar, Carlos Leal, and Pedro N. Figueiredo, “An automatic blood detection algorithm for wireless capsule endoscopy images,” in Computational Vision and Medical Image Processing,VIPIMAGE 2013, Jo˜ao Tavares & Natal Jorge (eds), 2014 Taylor & Francis Group, London, ISBN 978-1-138-00081-0 (ECCOMAS Thematic Conference
−3
x 10 30
10
25
8
20
6 15
4
10 5
2
0 80
0 0.25
60
0.2 0.15
40
0.1 20
0.05 0
(a) Original WCE images.
(b) Pre-processed input images
(c) Output detected bleeding/blood zones.
Fig. 3: From left to right: original input, intermediate images and detected regions of interest.
on Computational Vision and Medical Image Processing), pp. 237–241.
ing Workshops and Posters (CLUSTER WORKSHOPS), 2010 IEEE International Conference on, 2010, pp. 1–8.
[3] G. Li, T. Liu, J. Nie, L. Guo, J. Malicki, A. Mara, S. A. Holley, W. Xia, , and S.T. Wong, “Detection of blob objects in microscopic zebrafish images based on gradient vector diffusion,” Cytometry A, vol. 71, pp. 835–845, 2007.
[8] M. Martins, G. Falcao, and I. N. Figueiredo, “Fast Aberrant Crypt Foci Segmentation on the GPU,” International Conference on Acoustics, Speech and Signal Processing (ICASSP), IEEE, May, 2013.
[4] R. Manniesing, M. A. Viergever, and W. J. Niessen, “Vessel enhancing diffusion: A scale space representation of vessel structures,” Medical Image Analysis, vol. 10, no. 6, pp. 815 – 825, 2006. [5] A. F. Frangi, W. J. Niessen, K. L. Vincken, and M. A. Viergever, “Multiscale vessel enhancement filtering,” in Medical Image Computing and Computer-Assisted Intervention, Cambridge, MA, USA, 1998, pp. 130–137. [6] G. Gerig, G. Szekely, G. Israel, and M. Berger, “Detection and characterization of unsharp blobs by curve evolution,” in In Proc. of Information Processing in Medical Imaging, 165-176, 1995. [7] S.A. Mahmoudi, F. Lecron, P. Manneback, M. Benjelloun, and S. Mahmoudi, “GPU-based segmentation of cervical vertebra in X-Ray images,” in Cluster Comput-
[9] A. M. R. Schilham, B. van Ginneken, and M. Loogr, “Multi-scale nodule detection in chest radiographs,” in Lecture Notes in Computer Science, vol. 2878, 2003. [10] H. Lee, M. Harris, E. Young, and V. Podlozhnyuk, “Image convolution with CUDA,” NVIDIA Corporation, 2007. [11] Matteo Frigo and Steven G. Johnson, “The design and implementation of FFTW3,” Proceedings of the IEEE, vol. 93, no. 2, pp. 216–231, 2005, Special issue on “Program Generation, Optimization, and Platform Adaptation”. [12] V. Podlozhnyuk, M. Harris, and E. Young, “NVIDIA CUDA C programming guide,” NVIDIA Corporation, 2012. [13] V. Podlozhnyuk, “FFT-based 2D Convolution,” NVIDIA Corporation, 2012.