Thalla Fern~indez a, Jorge Bernal a, Mario Rodrlguez a, Alfonso Reyes a. Juan Silva a, Mario Alonso b and Gustavo Casian b a ENEP Iztacala, Universidad ...
Electroencephalography and clinical Neurophysiology , 87 (1993) 196-205 © 1993 Elsevier Scientific Publishers Ireland, Ltd. 0013-4694/93/$06.00
196
EEG 92185
Correlation between computed tomography and voltage and current source density spectral EEG parameters in patients with brain lesions * Thalla Harmony a, Antonio Fern~indez-Bouzas b Erzsebet Marosi a Thalla Fern~indez a, Jorge Bernal a, Mario Rodrlguez a, Alfonso Reyes a Juan Silva a, Mario Alonso b and Gustavo Casian b a E N E P Iztacala, Universidad Nacional Aut6noma de M~xico, and b Hospital Judrez de M~xico, 54090 Tlalnepantla (Mexico)
(Accepted for publication: 28 April 1993)
Summary In a group of patients with space-occupying brain lesions, CT measurements were correlated with absolute power (AP) and relative power (RP) of the delta, theta, alpha and beta EEG bands, calculated from the raw EEG potentials (EEGp) and from the Laptacian estimates also called "current source densities" (CSD). Rank correlations were calculated between the number of abnormal values in each band and the following CT measures: volume of the lesion and of the edema, density of the edema, percentage of ventricular collapse and midline shift. Abnormal spectral values are those which are significantly higher than the norm for the same age, in the delta and theta bands, and significantly lower in the alpha and beta bands. Spectral parameters obtained from the CSD showed higher correlations with CT measures than those calculated from the EEGp. In the Laplacian, all CT measures had a significant correlation with delta AP. Theta AP was significantly correlated with the volume and density of the edema, as well as with midline shift. Significant correlations were also observed with delta and alpha RP. However, changes in RP were considered to be a consequence of the increase in delta AP. Canonical correlation analyses between AP and RP calculated from EEGp or CSD and the first 3 CT measures showed that the volume of the lesion was only correlated with delta PiP and RP. The volume and density of the edema showed a significant correlation with delta, theta and alpha AP calculated from EEGp and only with theta and alpha AP in the Laplacian. Since the EEGp tends to produce a more extensive and diffuse picture of abnormality, whereas the Laplacian acts as a spatial filter emphasizing local sources over distant sources, we concluded that edema is related not to delta activity, but to the theta and alpha power. Key words: EEG; Frequency analysis; Current source density; Laplacian; Brain lesions; Computed tomography
Clinical electroencephalography has demonstrated that the most important characteristic of space-occupying lesions is the presence of polymorphic delta activity or localized delta activity, characteristically continuous, and localized to the site of the lesion (Fischer Williams 1987). Complete depression of E E G activity is a rare focal sign (2% in brain tumors, according to Hess 1976) and occurs when the tumor is rapidly growing (Fischer Williams et al. 1962). Hess (1976) noted 3 important aspects: (1) a slow wave focus is the localized presence of waves of a frequency slower than the dominant rhythm appropriate for the given age; (2) the slowest
Correspondence to: Thalia Harmony, ENEP Iztacala UNAM, Av. los Barrios s/n, Los Reyes Iztacala, 54090 Tlalnepantla (Mexico). Fax: (525) 390 5900. * This project was partially supported by Grant IN202492 from DGAPA, UNAM.
cerebral waves signal the most severe disturbance; and (3) the boundaries between the frequency bands are arbitrary and they do not signify any fundamental biological difference. These assertions assume a common origin for delta and theta activity in the presence of brain lesions. Thus, it is important to establish if localized delta or theta activity represents degrees of the same process or if each frequency band is related to a different mechanism. In this paper we seek to provide some experimental support for the hypothesis that delta and theta activity are mainly related to the volume of the lesion and of the edema respectively, since they represent the electrophysiological counterparts of two different processes. Previous work, relating visual E E G interpretation to anatomical data provided by computed tomography (CT), has been disappointing. Gastaut et al. (1979) tried to determine whether the severity and size of cerebral edema, directly visualized by CT, were pro-
CORRELATION BETWEEN CT AND EEG SPECTRAL PARAMETERS
portional to EEG abnormalities and sought to determine whether cerebral edema resulted in recognizable E E G disturbances. They classified the E E G records into 2 groups: those "non-suggestive" of tumoral origin, which were normal or with slight abnormalities, such as asymmetry of the background activity and focal or diffuse theta activity; and those "suggestive" of tumoral origin, with a focus of continuous polymorphic delta activity. As patients with edema and without edema were randomly distributed in both groups, they concluded that the degree of abnormality is not proportional to the extent of edema. The same results were obtained by Passerini et al. (1983), who reported that EEG abnormality was suggestive of the presence of a tumor in 82% of cases with edema and in 73% of patients without edema. However, in these two papers there was no attempt to correlate the severity of the edema with the severity of the abnormality of the EEG, since only groups with and without edema were considered. N e w m a r k e t al. (1983) correlated the findings from visual inspection with CT and PET with [18F]fluorodeoxyglucose in 23 patients with gliomas. The cortical metabolic rate was found to be suppressed in patients with and without focal slowing. They observed that 9 out of 14 patients with both gray and white matter lesions, and 5 out of 8 whose tumors were in white matter only, had focal delta activity. These results agree with those obtained by Gloor et al. (1977), showing the presence of polymorphic delta waves in white matter lesions in cats, since in both groups of patients white matter was involved. From the experimental point of view, the classic paper of Gloor et al. (1977) decisively demonstrated that "polymorphic delta activity is the result of some kind of cortical deafferentation, with the delta waves being generated by otherwise relatively normal neurons ... (the) kind of corticopetal system or systems (that) must be interrupted to produce delta activity in the E E G still remains undetermined" (p. 333). In the review of Steriade et al. (1990) on the origin of E E G rhythms it is proposed that this system may be the cholinergic cortically projecting basal forebrain ascendent system, and more evidence is provided in favor of this conclusion by Gloor et al. However, the origin of localized theta activity in the presence of brain lesions remains uncertain, considering that it only represents the mildest form of polymorphic delta activity. The use of quantitative E E G (qEEG) has provided better localization procedures than routine visual E E G analysis did (Gotman et al. 1975; Harner 1977; Harmony 1984). With the introduction of topographic E E G mapping these procedures were notably improved (Matzuoka et al. 1978; Dully 1985; Nagata et al. 1985; Prier et al. 1986; Jerret and Corsak 1988; Jackel and Harner 1989; Dolisi et al. 1990). Using spectral param-
197
eters from raw E E G potentials, the region of focal changes localized by E E G mapping may differ from the specific location of the lesion seen in the CT, and in this case the localizing ability of EEG mapping is inferior to that of CT (Nuwer 1988; Logar and Boswell 1991). In a previous report we have shown that the spectral parameters obtained from the Laplacian estimates or current source densities (CSD) were more accurate for the localization of brain tumors than those obtained from raw E E G potentials (EEGp) (Fernfindez-Bouzas et al. 1992). Such results agree with the theoretical propositions for the use of current source density or Laplacian estimates (Nunez 1981; Nunez et al. 1991) for the localization of electrical sources. FernfindezBouzas et al. (1992) also observed that the image of the edema in CT was better defined by theta absolute power mapping of the CSD. These results led us to explore the correlation between different CT measurements and the spectral parameters obtained from the EEGp or CSD. As CT measures, we have used the volume of the lesion, the volume of the edema, the density of the edema, the percentage of ventricular collapse and the extent of the midline shift. In the first 3 measurements we also took into account which electrodes were closer to the lesion and which to the edema, and thus were able to correlate all these data with E E G spectral parameters, in order to determine: (1) if EEGp or CSD correlated better with CT measurements, and (2) if the volume of the lesion or the edema correlated best with a specific E E G band.
Material and methods
Subjects Thirty-three patients were studied. After giving their informed consent, all patients underwent clinical neurological examinations, spectral analysis of E E G records, brain CT scans, as well as neurosurgical procedures when indicated. The characteristics of the sample are shown in Table I.
Recording Subjects were awake with eyes closed in a dimly lit room without acoustic isolation. The E E G was recorded from Fpl, Fp2, F3, F4, C3, C4, P3, P4, O1, 02, F7, F8, T3, T4, T5, T6, Fz, Cz and Pz, using linked earlobes as reference. Many criticisms have been made of the use of linked earlobes as reference (Nunez 1981); however, we needed the same reference for all channels for computation of the Laplacian. Gonz~lez Andino et al. (1990) have shown that in the case of occupying lesions there are no topographic differences when using linked earlobes as reference, and for this reason we decided to use them. Nevertheless, the linked ear reference
198
T. HARMONY ET AL.
TABLE I Case
Age
Sex
Diagnosis
2 5 10 29 30 38 44 48 55 8 19 25 27 32 33
63 64 37 50 55 42 71 54 63 59 44 40 45 14 57
F M F F F F F F M M M M M M M
41 43 58 16 46 49 13
33 27 48 36 62 36 57
F M M F M F M
17
71
M
40 1
47 31
M F
11 45 18 42 47 52 23
34 50 46 67 47 31 23
M F M M M F F
Left fronto-basal meningioma Right fronto-basal meningioma Left fronto-basal meningioma Left frontal meningioma of the convexity Left fronto-temporo-parietal meningioma Right meningioma in the sensorimotor area Left frontal meningioma of the convexity Right temporo-parietal meningioma Deep left temporal meningioma Left temporo-occipital glioblastoma Right temporo-parietal anaplastic astrocytoma Left parietal gemistocytic astrocytoma Left temporo-occipital anaplastic astrocytoma Pineal astrocytoma III Left glioblastoma in thalamus and corona radiata Left frontal astrocytoma III Left fronto-basal astrocytoma I Left frontal astrocytoma I Pituitary adenoma extended to temporal lobes Sagittat fronto-basal disgerminoma Left temporal and intrasellar lyrnphoma Right solitary prechiasmatic parasagittal metastasis from kidney tumor 3 metastases of kidney tumor in the right hemisphere Right parietal metastasis. Adenocarcinoma Cysticercus in right gyrus rectus with contrast enhancement Big right temporo-parietal cyst of cysticercus Right frontal racemose cyst of cysticercus Right putaminal hematoma Left frontal hematoma Left putaminal hematoma Left putaminal hematoma Left parietal hemorrhagic infarction
may, in some applications, lead to one of the following problems: (1) if electrode resistances at the ears are too small, there may be a significant shorting effect which acts to reduce asymmetry of measured scalp potentials as compared to that which occurs naturally; (2) if ear contact resistances are not equal, the effective reference is unbalanced towards one or the other ear (Nunez et al. 1991). In our patients the resistances of A1 and A2 were very similar and fell between 3 and 5 k~. The amplifier bandwidth was set between 0.5 and 30 Hz. Ten minutes of E E G were recorded. The E E G was sampled every 10 msec and edited off-line by visual inspection. Twenty-four artifact-free segments of 2.5 sec were selected for analysis.
EEG analysis Analysis was done off-line. The Fast Fourier Transform was computed and the following measures were obtained for each monopolar lead: the absolute (AP) and relative (RP) powers in each of 4 frequency bands:
delta (1.5-3.5 Hz), theta (3.5-7.5 Hz), alpha (7.5-12.5 Hz) and beta (12.5-19 Hz). The ranges of these bands were selected according to previous studies of John et al. (1980), Alvarez et al. (1987) and Harmony et al. (1990). To achieve Gaussian distributions for statistical analysis, the transformations of In(x) for AP and of In(x/(1 - x)) for RP were used (John et al. 1980; Gasser et al. 1982; Pollock et al. 1990). Many different procedures exist for the Laplacian estimation. The method we selected is based on the spherical harmonic Fourier expansion (Pascual et al. 1988). Using this model two different numerical problems, interpolation and Laplacian estimation, are solved simultaneously in an optimal manner with minimum prediction error. The spherical coordinate system used corresponds to a Cartesian system with origin at the center of a sphere that best fits an average real head. Under this approximation, the orientation of the axes can be defined as follows: the positive z axis passes through Cz, the positive x axis passes through Fpz with the negative segment through Oz, and the positive y axis passes through T3 with its negative segment through T4. The spatial Fourier expansion for the electrical potential on the surface of a spherical head is given by the spherical harmonic series. The spherical harmonic expansion (SHE) for the scalp potential was computed as the surface Laplacian, which corresponds to the potential field curvature. The time-dependent coefficients which represent the contribution of each spatial frequency component are estimated by minimizing the total square curvature of the scalp potential field, which guarantees the smoothness of the fitted expansion subject to the constraints in the scalp potential measurements from each electrode, which express the fact that the model must fit to the experimental data exactly. However, while this method produces a smooth expansion, it may be contaminated by noise. An adequate solution is to compute the regularized SHE, which includes a parameter whose estimation is based on minimization of the cross-validation error. The regularized SHE provides optimum estimates for the potential and the Laplacian on the surface of the head; it is an optimum spatial filter for the data. Using this procedure, Pascual et al. (1988) compared the Laplacian by the SHE method and by the commonly used finite difference method with the exact theoretical potentials at the electrode sites corresponding to the 10/20 system. In 31 cases out of 32, the SHE outperformed the finite difference method. These authors considered that there were two important approximation errors in the finite difference method which may explain these results. In the first place, the computations are based upon a locally planar representation of the scalp, the head being treated as a piecewise planar surface. In the second place, the large
C O R R E L A T I O N B E T W E E N CT A N D E E G S P E C T R A L P A R A M E T E R S
interelectrode distances for the 10/20 system may give an unsatisfactory finite difference approximation to the 2-dimensional planar operator, which is an even more severe problem at the boundary electrodes. On the other hand, the main approximation in the SHE method which is capable of introducing error in the Laplacian computations is due to the assumption that the head is a sphere. Experimental and theoretical evidence on dipole localization methods seems to indicate that the error introduced by the spherical approximation is not significantly large (Nunez et al. 1991; Vald6s et al. 1992). Cross-validation studies for the objective comparison of different interpolation methods demonstrate the superiority of the SHE method over the commonly used methods based on the weighted average of the nearest 3 and 4 neighbor values (Pascual et al. 1988). These were the reasons for our selection of the abovedescribed procedure for the computation of CSD. Records and analyses were made with a MEDICID 3M. C T scans
CT scans were performed with and without contrast medium (42 g of iodine). In both conditions volume of the lesion, volume of the edema, density of the edema in Hounsfield units, percentage of ventricular collapse taking as 100% the volume of the ventricle in the healthy hemisphere, and the extent of midline shift in millimeters were measured. The density of the edema was calculated as the difference between the average value of the healthy brain and the average value in the area of edema. Topograms were made in all patients and the localization of the electrodes in the 10/20 system was projected on the topogram slides. In 4 patients CT scans were made marking the position of the electrodes with a circle of bentonite paste 1 cm in diameter. In this way, and by visual inspection, the area of the lesions, as well as the area of the edema, were localized according to the position of the electrodes that were closest (Kido et al. 1980; Homan et al. 1987). Therefore the CT reports included a description of the electrode sites that were most probably related to the lesion or the edema. Statistical analyses
Two different types of correlations were calculated. (1) Spearman rank correlations between the number of abnormal values in eacli band for each montage versus each CT measure. Those values in the spectral analyses that were significantly different ( P < 0 . 0 5 ) from the norm provided by the MEDICID 3M were considered abnormal. As the CT variables were also arranged according to the degree of abnormality, we put forward the hypothesis that both types of measurement are positively correlated.
199
T A B L E II S pe a rma n' s ra nk correlations between CT me a s ure s and A P and RP. VoRage montage. Only significant correlations are shown. CT me a s ure
Delta AP
The t a A P
D e l t a RP
Volume of the lesion Volume of the edema Density of the edema Ventricular collapse Midline displacement
0.54 P < 0.001 0.38 P < 0.01 -
-
-
0.30 P < 0.05 -
-
-
0.34 P < 0.05 0.44 P < 0.01
0.53 P < 0.001 0.33 P < 0.05
-
-
(2) Canonical correlation analyses: 48 Canonical correlations were computed (3 CT measures X 4 bands x 2 montages x 2 spectral parameters (AP or RP)). In each of these analyses, 2 different matrices were used. Both matrices had n rows (number of patients) and 19 columns (number of electrodes). One matrix was formed by the transformed AP or RP values in a particular band in all leads, and the other by the values of the volume of the lesion or the edema divided between the number of derivations affected, and positioned in the particular columns corresponding to those electrodes. The remaining values in that row of this matrix were filled with zeros. The matrix that corresponds to the density of the edema was made up of the density values in the particular columns where the edema was localized and filled with zeros elsewhere.
Results
Table II shows the results of the Spearman rank correlations between the CT measures and the spectral parameters obtained with the EEGp. The highest correlations were obtained between delta AP and the volume of the lesion and the ventricular collapse. The volume of the edema was significantly correlated with delta and theta AP. Contrasting these results with those obtained with the Laplacian (Table III), it is evident that the latter has higher correlations with CT measures. All CT parameters were significantly correlated with delta AP. Theta AP had a significant correlation with the volume and density of the edema and with the shift of the midline. In both tables significant correlations may also be observed with delta RP, and in the case of the Laplacian, with alpha RP. As we shall discuss later, we believe that RP is a reflection of what happened in AP. Canonical correlations between the volume of the lesion and AP calculated from EEGp and CSD were significant (P < 0.005) only in the delta band. The Canonical correlation between the volume of the lesion
U AlP : i ) s l t a
o.ku, c m . e m l ~
V l~P:lbl4m Z
o.Joa cm.s.,,do,
LAP :l~l~
o.jm,
L ~P:Dml~
Z
o.km,
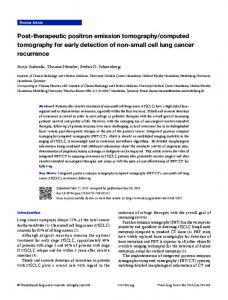
Fig. 1. Patient HJ10 with a left fronto-basal meningioma, as shown in the CT scan. In the CT scan left (L) and right (R) hemispheres are indicated. In the EEG maps the right hemisphere coincides with the right side of the figure. The 4 maps are: top left: delta AP calculated from EEGp; top right: Laplacian delta AP; bottom left: EEGp Z-normed values; bottom right: Laplacian Z-normed values. The map calculated from the EEGp (V) shows a focus of abnormality in the left fronto-polar lead, but an excess of delta may also be observed in the right hemisphere. The Z-normed map of delta values calculated from the EEGp (V) shows that the major abnormalities are not only in the left fronto-polar lead, but in the right temporal area as well. This is not in agreement with the CT image. However, the Laplacian (L) maps are very precise in the location of the lesion, since the delta excess is observed only in the left fronto-polar lead. Laplacian maps have a greater coincidence with the CT image than voltage maps.
CORRELATION BETWEEN CT AND EEG SPECTRAL PARAMETERS
U AP: 1 1 m t a o J o . cm,s, a d o u
201
L O.P: Y l m t a o Jim ¢ z r e a d o = 12,00 10. $. 10 ?.~ $.n 4.M 3,tSl O.~t -Z. l Z -3.53 -q.~q -.6.~
U P.P:llmta Z o~s cerrados
"?'~ -S, 1~ -~z.0
L A P : ~ Z oJos cerrados
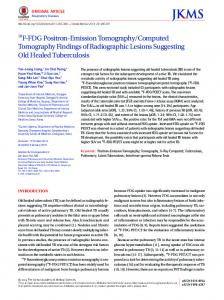
Fig. 2. Patient H J40 with a metastasis in the right parietal lobe, and a large area of edema, which produced a mass effect. In the CT scan, left (L) and right (R) hemispheres are indicated. The EEG maps are of theta AP, left hemisphere in the left side of the figure. Top left: theta AP calculated from EEGp (V); top right: Laplacian (L) theta AP; bottom left: EEGp Z-normed values; bottom right: Laplacian Z-normed values. In the Z-normed maps the Laplacian had a better correlation with the CT image of the area of edema.
202
T. HARMONY ET AL.
TABLE III Spearman's rank correlations between CT measures and AP and RP. Laplacian montage. Only significant correlations are shown. CT measure
Delta AP
Theta AP
Delta RP
Alpha RP
Volume of the lesion Volume of the edema Density of the edema Ventricular collapse Midline displacement
0.58 P < 0.001 0.53 P < 0.001 0.40 P < 0.01 0.58 P < 0.00t 0.66 P < 0.001
-
0.43 P < 0.01 -
0.49 P < 0.001 -
-
-
0.42 P < 0.01 0.42 P < 0.01
0.49 P < 0.001 0.46 P < 0.01
0.37 P < 0.05 0.30 P < 0.05 0.32 P < 0.05
and RP was also significant ( P < 0.005) in the delta band when CSD were considered. Therefore, AP and RP in the theta, alpha and beta bands were not directly related to the volume of the lesion. The volume and density of the e d e m a showed significant ( P < 0.02) correlations with AP calculated from E E G p in the delta, theta and alpha bands. However, when CSD were considered, only AP in the alpha band was significantly correlated ( P < 0.002) with the volume and density of the e d e m a and theta AP with the volume of the e d e m a ( P < 0.0006). Canonical correlations between RP calculated from E E G p and the volume of the e d e m a were significant ( P < 0.005) in the theta and alpha bands. The Canonical correlations between RP computed from the Laplacian and the volume of the e d e m a were significant ( P < 0.03) in the delta and theta bands.In the delta and beta bands significant correlations were found with the density of the edema ( P < 0.03). As an illustration, we have selected two cases shown in Figs. 1 and 2. Fig. 1 shows the CT and the maps of delta AP in a patient with a left fronto-basal meningioma. The map calculated from the E E G p (V) shows a focus of abnormality in the left fronto-polar lead, but the excess of delta may be observed also in the right hemisphere. The Z - n o r m e d map of delta values calculated from the E E G p (V) shows that the major abnormalities are not only in the left fronto-polar lead, but in the right temporal area as well. This does not correspond with the CT image. However, the Laplacian (L) maps are very precise in the location of the lesion, since the delta excess is only observed in the left fronto-polar lead. Laplacian maps have a greater coincidence with the CT image than voltage maps. In Fig. 2 we have selected a patient with a metastasis in the right parietal lobe, and a large area of edema, which produces a "mass effect," as can be seen in the CT scan. The E E G maps are of theta AP, left hemisphere in the left side of the figure. The m a p calculated from the E E G p (V) shows a small focus of abnormality in the right parieto-temporal area. The
same can be observed in the Z-normed m a p from the E E G p , However, the Laplacian Z - n o r m e d map shows a large area of abnormal theta activity in the right hemisphere, as well as in the left central region reproducing the "mass effect" observed in the CT.
Discussion Spearman's rank correlation analyses establish the relation between the severity of E E G impairment and the severity of structural damage. Analyses by Canonical correlation, as we have computed them, suggest a linear relationship between the localization of the lesion or e d e m a by CT and the E E G recorded by all of the electrodes. In other words, by means of rank correlations we are seeking to ascertain whether the extent of the abnormality of E E G spectral parameters is related to the extent of the lesion, while we are using the Canonical correlations to relate the place of the structural damage to the spectral values across the head. We shall first discuss the results obtained with Spearman's rank correlations. We have considered abnormal those spectral values that were significantly different ( P < 0.05) from the norms provided by the M E D I C I D 3M (Vald6s et al. 1990). For delta and theta bands, those values which were higher than the norm for the same age were considered as abnormal, and those lower than it were taken as abnormal for the alpha and beta bands. On the other hand, CT measures were ordered according to the severity of the damage. Hence, only positive correlations were expected. The results obtained using the E E G p were not as significant as the results obtained with the CSD. This is in agreement with our previous observations (Fern~indez-Bouzas et al. 1992) and demonstrates that current source density values are more useful than voltage measurements. We believe that Laplacians obtained with higher electrode density might have exhibited an even closer correlation with the CT measures. However, we think that the large interelectrode distances for the 10/20 system might have produced an unsatisfactory finite difference approximation if we had used the 2-dimensional planar operator for the estimation of the Laplacian, while the spherical harmonic Fourier expansion method provides accurate results in the interpolation of electrical potentials and current source densities (Pascual et al. 1988). The highest rank correlations were obtained between CT measures and delta AP calculated from E E G p or CSD. The significant relationships of delta and alpha RP to CT measurements could be considered a consequence of the increase in delta AP, since the relative values correspond to the percentage of activity in a particular band in relation to total activity.
CORRELATION BETWEEN CT AND EEG SPECTRAL PARAMETERS
A decrease in alpha RP may be due exclusively to an increase in delta AP. These results are important from a practical point of view, since they clearly show that in these cases abnormalities in RP values are due to an increase in delta AP. With regard to the results obtained with the Laplacian shown in Table III, the highest correlations were observed between delta AP and the volume of the lesion, ventricular collapse and the midline shift. The last two measures reflect the "mass effect," which is produced by the volume of the lesion, the volume of the edema and the topography of the lesion and the edema (temporal tumors very rarely produce midline displacements). Thus, more extensive lesions produce more extensive delta increases. Two other CT measures which especially interested us were the volume and the density of the edema. The volume of the edema was found to be related not only to delta but to theta AP as well. This means that larger areas of edema are related to more extended increases in delta and theta AP. The density of the edema measures the amount of water in the brain, and this turned out to be related to delta and theta AP. That is, the higher the concentration of water, the more extensive the delta and theta abnormalities. The third CT measure that was significantly correlated with theta AP was the midline shift. As previously noted, this measure reflects the "mass effect" which involves the amount of edema. It is interesting to note that the significant results obtained with theta AP were in those CT parameters which measure edema. With regard to the results of Canonical correlations, it was striking that the volume of the lesion, including the topography of the lesion in relation to the 10/20 system, was significantly correlated only with delta AP calculated from EEGp or CSD. This result, indicating that delta AP is a very good parameter for the localization of lesions, is in agreement with all previous findings on EEG (Hess 1976; Fischer-Williams 1987) and qEEG (Gotman et al. 1975; Harner 1977). It also suggests that mass-occupying lesions per se do not produce great deviations in theta, alpha and beta bands, which agrees with the results obtained by rank correlation analyses. However, the Canonical correlations with the volume and the density of the edema showed a significant correlation with delta, theta and alpha AP calculated from EEGp and only with theta and alpha AP computed from CSD. The absence of correlation with delta AP in the Laplacian may be due to the fact that the Laplacian acts as a spatial filter which emphasizes local sources over distant sources. The EEGp tends to produce a more extensive and diffuse picture of the abnormality in EEG maps (Nunez et al. 1991; FernfindezBouzas et al. 1992). Laplacian parameters strongly
203
suggest that edema is related not to delta activity, but to theta and alpha power. If this is so, our results agree with those previously described using routine EEG interpretation: the edema is not characterized by polymorphic delta rhythm (Gastaut et al. 1976; Steriade et al. 1990). However, visual inspection of the EEG did not detect subtle EEG changes in theta and alpha composition which only became apparent in qEEG. Jerret and Corsak (1988) considered that topographic mapping seems to provide better detection of low voltage slow activity not easily discernible by routine EEG. Therefore our results point towards independent origins of activity in the delta and theta bands in patients with space-occupying lesions. Delta power is directly related to the volume of the lesion and to measurements of the "mass effect." In this respect the hypothesis of Gloor et al. (1977), corroborated by Goldensohn (1979), appears plausible. That is, that delta polymorphic activity may be the result of a partial cortical deafferentation. This seems to be the case, since in our patients it is possible to invoke a cortical lesion even in those with meningiomas because in these cases local cortical atrophy by means of ischemia has been reported due to direct compression (Stevens et al. 1983; Hino et al. 1990), and accumulation of edema in the white matter (Gwan-Go et al. 1988) with disruption of the cortical layer. A more remote possibility, but one which may be taken into account in large volumes of electrically inactive fluid or tissue interposed between the cortex and the recording electrodes, is that this mass may be acting as a spatial filter of the EEG activity generated in the brain. Spatial and temporal properties of EEG are related in such a way that the application of a spatial filter also changes temporal properties (Nunez 1989). Comparisons of cortical and scalp EEGs in humans have shown that the cortical EEG contains much more power above 15 Hz than the scalp EEG (Pfurtscheller and Cooper 1975). For the generation of peritumoral vasogenic edema, many different factors have been proposed. The existence of hypoperfused white matter in regions of peritumoral edema has been shown by means of dynamic CT (Jinkins and Sener 1991). This has implications concerning the edema surrounding any lesion: the edema causes hypoperfusion resulting in ischemia, which engenders further edema, and so on. Thus a self-actuating cycle may be operative in cases of profound edema. Other mechanisms for the generation of edema have been proposed: humoral factors produced by the tumor (Ohnishi et al. 1990), metabolic suppression, primarily of oxygen metabolism (Hino et al. 1990), an increase in capillary permeability (Yamada et al. 1983), and progesterone binding activity (Benzel and Gelder 1988). On the other hand, it has been suggested that the edema produces an increase in anaerobic
204
metabolism (Sutton et al. 1989). Thus, it would be simplistic to relate the generation of theta activity to a particular factor present in such complex processes as the generation of vasogenic edema. In conclusion, our results suggest that delta activity is related mainly to the volume of the space-occupying lesion, and that vasogenic edema is characterized by an increase in theta AP. The authors acknowledge Martin Klein and Sandor John for the correction of the English version of this manuscript.
References Alvarez, A., Vald6s, P. and Pascual, R. EEG developmental equations confirmed for Cuban schoolchildren. Electroenceph. clin. Neurophysiol., 1987, 67: 330-332. Benzel, E.C. and Gelder, F.B. Correlation between sex hormone binding and peritumoral edema in intracranial meningiomas. Neurosurgery, 1988, 22: 169-174. Dolisi, C., Suisse, G. and Delpont, E. Quantitative EEG abnormalities and asymmetries in patients with intracranial tumors. Electroenceph, clin. Neurophysioi., 1990, 76: 13-18. Duffy, F.H. The BEAM method for neurophysiological diagnosis. Ann. NY Acad. Sci., 1985, 457: 19-34. Fern~ndez-Bouzas, A., Harmony, T., Marosi, E., Fern~indez, T., Alonso, M., Rodriguez, M., Bernal, J. and Reyes, A. Comparison of voltage reference versus Laplacian topographic maps in brain lesions. In: Proc. 3rd Int. Congr. of Brain Electromagnetic Topography, Amsterdam, June 9-12, 1992: 15. Fischer-Williams, M. Brain tumors and other space-occupying lesions. In: E. Niedermeyer and F. Lopes da Silva (Eds.), Electroeneephalography. Basic Principles, Clinical Applications and Related Fields. Urban and Sehwarzenberg, Baltimore, MD, 1987: 229-258. Fischer-Williams, M., Last, S.L., Lyberi, G. and Northfield, D.W.C. Clinico-EEG study of 128 gliomas and 50 intracranial metastasic tumors. Brain, 1962, 85: 1-46. Gasser, T., B~icher, P. and Mfeks, J. Transformation toward the normal distribution of broad band spectral parameters of the EEG. Electroenceph. clin. Neurophysiol., 1982, 53: 119-124. Gastaut, J.L., Michel, B., Sabet Hassan, S., Cerda, M., Bianchi, L. and Gastaut, H. Electroencephalography in brain edema (127 cases of brain tumor investigated by cranial computerized tomography). Electroenceph. clin. Neurophysiol., 1979, 46: 239-255. Gloor, P., Ball, G. dnd Schaul, N. Brain lesions that produce delta waves in the EEG. Neurology, 1977, 27: 326-333. Goldensohn, E.S. Use of the EEG for evaluation of focal intracranial lesions. In: D.W. Klass and D.D. Daly (Eds.), Current Practice of Electroencephalography. Raven Press, New York, 1979: 307-341. Gonz~ilez Andino, S.L., Pascual, R., Sosa, P., Lirio, R.B., Machado, C., Diaz, G., Rodrlguez, P.F. and Torres, C.C. Brain electrical field measurements unaffected by linked earlobes as reference. Electroenceph. clin. Neurophysiol., 1990, 75: 155-160. Gotman, J., Gloor, P. and Ray, W.F. A quantitative comparison of traditional reading and interpretation of computer extracted features in patients with supratentoriai brain lesions. Eiectroenceph. clin. Neurophysiol., 1975, 38: 623-639. Gwan-Go, K., Wilmink, J.T. and Molenaar, W.M. Peritumoral brain edema associated with meningiomas. Neurosurgery, 1988, 23: 175-179. Harmony, T. Neurometric Assessment of Brain Dysfunction in Neurological Patients. Lawrence Erlbanm, Hillsdale, NJ, 1984.
T. HARMONY ET AL. Harmony, T., Marosi, E., Diaz de Le6n, A.E., Becker, J. and Fernandez, T. Effect of sex, psyehosocial disadvantages and biological risk factors on EEG maturation. Electroenceph. clin. Neurophysiol., 1990, 75: 482-491. Harner, R.N. EEG analysis in the time domain. In: A. R6mond (Ed.), EEG Informatics. A Didactic Review of Methods and Applications of EEG Data Processing. Elsevier, Amsterdam, 1977: 57-82. Hess, R. Localized abnormalities. In: W.A. Cobb (Ed.), Handbook of EEG and Clinical Neurophysiology, Vol. 11. Elsevier, Amsterdam, 1976: 88-116. Hino, A., Imatiori, Y., Tenjin, H., Mizukawa, N., Ueda, S., Hirakawa, K. and Nakahashi, H. Metabolic and hemodynamic aspects of peritumoral low density areas in human brain tumors. Neurosurgery, 1990, 26: 615-621. Homan, A.W., Herman, J. and Purdy, P. Cerebral location of international 10-20 system electrode placement. Electroenceph. clin. Neurophysiol., 1987, 66: 376-382. Jackel, R.A. and Harner, R.N. Computed EEG tomography in acute stroke. Neurophysiol. Clin., 1989, 19: 185-193. Jerret, S.A. and Corsak, J. Clinical utility of topographic EEG brain mapping. Clin. EEG, 1988, 19: 134-143. Jinkins, J.R. and Sener, R.N. The characteristics of cerebral meningiomas and surrounding tissues in dynamic CT. Neuroradiology, 1991, 33: 499-506. John, E.R., Ahn, H., Prichep, L., Trepetin, M., Brown, D. and Kaye, H. Developmental equations for the EEG. Science, 1980, 210: 1255-1258. Kido, D.K., Le May, M., Levinson, A.W. and Benson, W.E. Computed tomographic localization of the precentral gyrus. Radiology, 1980, 135: 373-377. Logar, C. and Boswell, M. The value of EEG mapping in focal cerebral lesions. Brain Topogr., 1991, 3: 442-446. Matzuoka, S., Arakaki, Y., Numaguchi, K. and Ueno, S. The effect of dexamethasone on electroencephalograms in patients with brain tumors with specific reference to topographic computer display of delta activity. J. Neurosurg., 1978, 48: 601-608. Nagata, K., Gross, C., Kindt, G., Geier, J. and Aday, G. Topographic electroencephalographic study with power ratio index mapping in patients with malignant brain tumors. Neurosurgery, 1985, 17: 613-619. Newmark, M.E., Theodore, W.H., Sato, S., De la Paz, R., Patronas, N., Brooks, R., Jabbari, B. and Di Chirp, G. EEG, transmission computed tomography and positron emission tomography with [ ts F]fluorodeoxyglucose. Arch. Neurol., 1983, 40: 607-610. Nunez, P.L. Electric Fields of the Brain: the Neurophysics of EEG. Oxford University Press, New York, 1981. Nunez, P.L. Generation of human EEG by a combination of long and short range neocortical interactions. Brain Topogr., 1989, 1: 199-215. Nunez, P.L., Pilgreen, K.L., Westdorp, A.F., Law, S.K. and Nelson, A.V. A visual study of surface potentials and Laplacians due to distributed neocortical sources. Computer simulations and evoked potentials. Brain Topogr., 1991, 4: 151-168. Nuwer, M.R. Quantitative EEG. II. Frequency analysis and topographic mapping in clinical settings. J. Clin. Neurophysiol., 1988, 5: 45-85. Ohnishi, T., Sher, P.B., Posner, J.B. and Shapiro, W.R. Capillary permeability factor secreted by malignant brain tumor. J. Neurosurg., 1990, 72: 245-251. Pascual, R.D., Gonz~lez, A.S.L., Vald6s, P. and Vald6s, M. Current source density estimation and interpolation based on the spherical harmonic expansion. Int. J. Neurosci., 1988, 43: 237-250. Passerini, D., Ferini Strambi, L., Sbacchi, M. and Pezzoli, G. EEG patterns in cerebral tumors with and without edema. Electromyogr. Clin. Neurophysiol., 1983, 23: 117-122. Pfurtscheller, G. and Cooper, R. Frequency dependence of the
CORRELATION BETWEEN CT AND EEG SPECTRAL PARAMETERS transmission of the EEG from cortex to scalp. Electroenceph. clin. Neurophysiol., 1975, 38: 93-96. Pollock, V.E., Schneider, L.S. and Lyness, S.A. EEG amplitude in healthy, late middle-aged and elderly adults: normality of the distributions and correlations with age. Electroenceph. clin. Neurophysiol., 1990, 75: 276-288. Prier, S., Benoit, C. and Redondo, A. R6sultat de la cartographie EEG au cours des turnouts c6r6brales. Confrontation aux m6thodes d'imagerie. Rev. EEG Neurophysiol. Oin., 1986, 16: 257-267. Steriade, M., Gloor, P., Llin~s, R.R., Lopes da Silva, F.H. and Mesulam, M.M. Basic mechanisms of cerebral rhythmic activities. Electroenceph. clin. Neurophysioi., 1990, 76: 481-508. Stevens, J.M., Ruiz, J.S. and Kendall, B.E. Observations on peritu-
205
moral oedema in meningioma. Part II. Mechanisms of oedema production. Neuroradiology, 1983, ~ : 125-131. Sutton, L.N., Barranco, D., Greenberg, J., Dante, S., Florin, S. and Welsh, F. Cerebral blood flow and glucose metabolism in experimental brain edema. J. Neurosurg., 1989, 71: 868-874. Vald~s, P., Biscay, R., Galan, L., Bosch, J., Szava, S. and Viru6s, T. High resolution spectral EEG norms for topography. Brain Topogr., 1990, 3: 281-282. Vald~s, P., Bosch, J., Grave, R., Hern~indez, J., Riera, J., Pascual, R. and Biscay, R. Frequency domain models of the EEG. Brain Topogr., 1992, 4: 309-319. Yamada, IC, Ushio, Y., Hayakawa, T., Arita, N., Yamada, N. and Mogami, H. Effects of methylprednisolone on peritumoral brain edema. J. Neurosurg., 1983, 59: 612-619.