[Downloaded free from http://www.ijddc.com on Tuesday, November 18, 2008]
ORIGINAL ARTICLE
Correlation between two-point discrimination with other measures of sensory loss in diabetes mellitus patients R. Periyasamy, M. Manivannan, V. B. Narayanamurthy1 Biomedical Engineering Group, Department of Applied Mechanics, Indian Institute of Technology Madras, Chennai - 600 036, 1 Diabetic Foot Clinic, Sundaram Medical Foundation, Chennai - 600040, India.
Diabetic neuropathy is one of the most important factors for foot ulceration in diabetes mellitus (DM) patients. Among different sensibility measures of neuropathy, two-point discrimination (TPD) has been suggested as a reliable method; however, the correlation of TPD with other well-known measures is not known. We measured the loss of protective sensation using Semmes-Weinstein MonoÞlaments (SWMF), hardness of the foot sole using shore meter (sh), power ratio (PR) using pedopowergraph and TPD using esthesiometer in foot areas of both left and right legs in 14 DM subjects. We have found no correlation either between TPD and shore values (sh) or between TPD and PR. The SWMF (10 g) is found not to provide any additional value in measuring loss of sensation in comparison to TPD. The TPD appears to be measuring different property of the foot compared to other measures. The mechanism of this independence is not well understood and more investigation is required to understand the mechanism. KEY WORDS: Diabetic neuropathy, pedopowergraph, sensory measures, shoremeter
Introduction Diabetic neuropathy is the primary complication and most likely the cause of morbidity and mortality related to diabetes. It is one of the most important factors for foot ulceration in diabetes mellitus (DM) patients. Prevention
Correspondence to Dr. M. Manivannan, Biomedical Engineering Group, Department of Applied Mechanics, Indian Institute of Technology Madras, Chennai - 600 036, India. E-mail:
[email protected]
of these problems is difÞcult, mainly because there is no method to correctly access sensibility of the foot. Evaluation of sensibility on the feet of diabetic patients is an important factor in order to prevent ulceration at risk. Various modalities of touch sensation like pressure, vibration and two-point discrimination (TPD) are used to test sensation loss or sensibility. Generally, sensibility is deÞned as normal touch, diminished light touch, diminished protective sensation and loss of protective sensation.[1] Loss of protective sensation is measured using[2,3] a Semmes-Weinstein monoÞlament (SWMF), which exerts 10 g force when pressed perpendicularly against the skin of the foot sole at risk. SWMF broadly classiÞes people into two large groups, one who have and other who have no sensation of 10 g SWMF. The latter group is at risk of ulceration.[4] SWMF is less useful in screening the loss of protective sensation beyond the risk factor.[5] Boulton et al,[4] Patil et al[6] and Prabhu et al,[7] have deÞned peak foot pressures and shown that the loss of protective sensation is the cause for plantar ulcers in diabetic neuropathy.[7] The latter quantified loss of sensation into three levels [1] and reported good correlations between quantified levels of sensation loss and peak foot pressure. They used the actual foot pressure distribution to calculate a new parameter power ratio (PR). PR is the ratio of high-frequency power to the total power in the foot pressure image distribution related to the three levels of sensation loss of foot sole in diabetic neuropathy. Romanelli et al,[8] have proposed ‘shoremeter’ for measuring the hardness of soft materials like rubber and skin. Piaggessi et al,[9] have measured hardness of the foot sole using ‘durometer’. The measurement of the cutaneous sensation to Int J Diab Dev Ctries | July-September 2008 | Volume 28 | Issue 3
71
[Downloaded free from http://www.ijddc.com on Tuesday, November 18, 2008] Periyasamy et al.: Measures of sensory loss in DM patients
differentiate one-point from two-point static touch stimuli may allow identification of ulcer earlier in the clinical course of diabetic neuropathy.[10] TPD has been suggested as a reliable quantitative measure of sensibility.[11] TPD, static and moving, has been used as a tool to measure sensory loss in DM. Although the method is subjective, as the patient must report whether or not the pressure is felt, it is more reliable than the previously available methods and it is a quantitative measure of the sensory loss. Although TPD is more reliable, little work is done comparing it with other measures of sensibility for diabetic patients. The shore level[12] increased from 15 to 40 corresponding to an increase in loss of sensation level from 3 g to 10 g of SWMF with very good correlation between these variables. Charanya et al,[12] observed that the increase in mean PR for an increase in shore value of foot sole soft tissue from 20 to 25 was of the order of four times the corresponding increase for a change in shore values from 10 to 15 in the same foot sole areas. Correlation of TPD with other well-known measures is not known in literature. Dellon et al,[13] observed that there is no correlation between TPD and shore values in Þngers, not in lower extremities which is affected Þrst in diabetic patients. Knowing these correlations in diabetic patients could help us to avoid duplication of clinical tests and reduce overall healthcare cost. In this paper, we present our study on the correlation of TPD with other measures such as loss of protective sensation, hardness of the sole and PR in foot areas of DM patients. We found that there is no correlation between TPD and shore value in the feet, similar to the observation by Dellon et al,[13] in Þngers and no correlation between TPD and PR value in the feet. As shore values and PR were found to have a high correlation, TPD could represent advanced and reliable measure to predict the gradual loss of sensation in DM patients. Two-point discrimination The TPD test was originally used for innervations density test of afferent Þbers.[14] Discriminating the two anatomical points by varying the distance between the two prong points measures the degree of sensation loss and detects progressive loss of sensation in the foot.
Among the two types of TPD, static TPD (STPD) and dynamic TPD (DTPD), the former is commonly used in emergency departments to determine digital nerve integrity.[15] It is the current recommended method for physicians evaluating loss of sensation or degree of sensation loss in diabetic patients. DTPD is usually measured with disk-criminator,[15] moving the prongs along the surface of the center. Though STPD and DPTD have been used as tools to measure sensory loss in DM, the DTPD values were of lesser magnitude than STPD values in all anatomical areas tested. The DTPD is not routinely used in clinical practices. Calipers or an opened paper clip with two parallel ends are used for Þnding STPD.[16] Esthesiometer, a modiÞed form of vernier calliper, is clinically used for determining the TPD of touch, by moving the prongs into contact with the portion of the body part and then pressing until the patient feels a sensation. A set of small grating surfaces was recently introduced for cutaneous spatial resolution measurement. The gratings are placed on the skin and subjects are required to identify the orientation of grooves and bars. The Þnest grating whose orientations are discriminated reliably provides an estimate of the spatial resolution limit in the tested area.[17] In the 1990s, Dellon proposed the pressure-speciÞed sensory device (PSSD) that could gather information about static and moving touch in a continuous form by using a computer.[11] PSSD is a quantitative sensory device, which consists of one or two blunt probes and sensitive transducers to measure and record the perception thresholds of pressure on the surface of the body in g/ sq mm.
Methodology We measured the loss of protective sensation, hardness of the sole, PR and (14 diabetic subject, 4 normal subjects). TPD in foot areas of both left and right legs of 18 subjects. Details of diabetic subjects are shown in Table 1. Measures from the normal subjects closely match with that of literature data. If the subject had callosite in any of the foot area, the TPD and other measures were taken adjacent to the callosite, but within the same area of the foot. The subject’s age,
Table 1: Details of diabetic subjects Diabetic subjects Male 5
Female
Age (years)
No. of subjects with callosity
50–70
9
*for both men and women 72
Int J Diab Dev Ctries | July-September 2008 | Volume 28 | Issue 3
Duration of diabetes mellitus (years)*
3 5-20
[Downloaded free from http://www.ijddc.com on Tuesday, November 18, 2008] Periyasamy et al.: Measures of sensory loss in DM patients
(a)
(b)
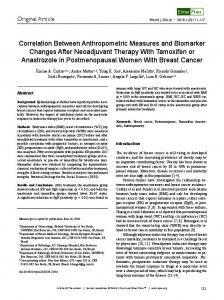
Figure 1: (a) standard division of foot area, (b) division of foot for our study
duration of the DM and medication were noted, but were not considered for our analysis. Study period was from January to March 2007. A total of 18 subjects were tested and the details of each diabetic subject are given above in the Table 1 All the subjects were clinically screened for peripheral artery occlusive disease (PAOD). There were no subjects with clinical vasculopathy. In order to simplify our analysis, we divided the foot region into different areas. In the literature, the foot is divided into ten standard signiÞcant areas [Figure 1 (a)], as per method indicated in Cavanagh et al,[18] and Patil et al.[19] For our analysis, we have divided each foot into four areas as mentioned in Figure 1 (b). Hind foot includes area 1 and 2; mid foot includes area 3 and 4; fore foot includes area 5, 6 and 7; and the big toe is area 8. Loss of protective sensation measurement using SWMF
Table 2: Coefficient of correlation (r) between two-point discrimination and shore values (sh) and the corresponding regression equations in different foot areas of the foot in diabetic subjects with intact sensation Foot areas Right 1, 2 Right 3, 4 Right 5, 6, 7 Right 8 Left 1,2 Left 3,4 Left 5,6,7 Left 8
Correlation coefficient ( r )
Regression equation
0.745 0.296 0.64 0.559 0.189 0.63 0.987 0.00006
TPD = –0.2262 Sh + 8.7659 TPD = –0.0238 Sh +2.7627 TPD = 0.13 Sh +0.0028 TPD = –0.0957 Sh +0.3429 TPD = –0.0811 Sh +4.8434 TPD = –0.1034 Sh +4.527 TPD = 0.1954 Sh –1.8209 TPD = –0.0003 Sh 2.3767
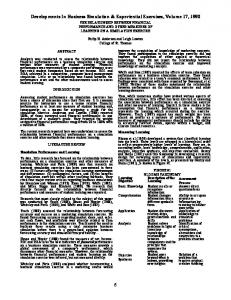
Figure 2: Pedopowergraph
Each footprint is divided into four standard areas as per the method indicated [Figure 1(b)]. To test the sensation, the patient sits with the eyes closed and the foot being placed in a comfortable position. The SWMF (10 g) is pressed perpendicular to the surface of the foot sole with a force just sufÞcient to buckle the monoÞlament to Þnd the sensation level. The patient is asked to say ‘yes’ when he/she feels the monoÞlament. Then the detected sensation level is noted in the datasheet. The above procedure was done for 14 diabetic subjects and four normal subjects in the prescribed locations as shown in the Figure 1(b). Foot sole hardness measurement using SM
Table 3: Coefficient of correlation (r) between two-point discrimination and shore values (sh) and the corresponding regression equations in different foot areas of the foot in diabetic subjects without sensation Foot areas Right 1, 2 Right 3, 4 Right 5, 6, 7 Right 8 Left 1, 2 Left 3, 4 Left 5, 6, 7 Left 8 Right 1, 2 Right 3, 4 Right 5, 6, 7 Right 8 Left 1, 2 Left 3, 4 Left 5, 6, 7 Left 8
Correlation coefficient (r) 0.394 0.114 0.044 0.361 0.170 0.614 0.00007 0.308 0.356 0.109 0.154 0.219 0.118 0.561 0.260 0.216
Regression equation TPD = –0.108 Sh +6.4315 TPD = –0.02 Sh +2.9694 TPD = –0.0056 Sh +2.974 TPD = –0.0191 Sh +3.2338 TPD = -0.0288 Sh +3.761 TPD = 0.2793 Sh -4.7084 TPD = -0.0002 Sh +2.9608 TPD = -0.0287 Sh +3.3106 TPD = –0.0836 Sh +5.4331 TPD = –0.0181 Sh +2.8107 TPD = 0.0172 Sh +2.2838 TPD = –0.0131 Sh +3.0161 TPD = –0.0217 Sh +3.4645 TPD = 0.1884 Sh –2.2079 TPD = 0.0275 Sh +2.0772 TPD = –0.0207 Sh +3.0011
Int J Diab Dev Ctries | July-September 2008 | Volume 28 | Issue 3
73
[Downloaded free from http://www.ijddc.com on Tuesday, November 18, 2008] Periyasamy et al.: Measures of sensory loss in DM patients
For measuring the hardness of the foot sole, the patient’s foot is placed in a comfortable position and the shoremeter is pressed perpendicular to the surface of the foot sole and the depth of an indentation, indicated by the pointer of the instrument, in the material created by a given force on a standardized pressure foot is noted on the datasheet. The shoremeter reads the hardness in degree shore values from 0 to 100. Three trials are performed at each site of foot sole and the average value noted. When shore levels are measured on foot sole of diabetic patients, they can be any combinations of 20–60 degrees shore in different foot sole areas depending upon the level of foot sole hardness and diabetic neuropathy. The above procedure was done for 14 diabetic subjects and 10 normal subjects in the prescribed locations as shown in Figure 1(b). Measurement of foot sole pressure using pedopowergraph We used pedopowergraph (PPG) system as mentioned.[19] It is based on continuous transduction principle and measures pressure distribution parameter PR. PR is deÞned as the ratio of high frequency power to the total power in the power spectrum of the standing foot pressure image obtained by PPG.[12] The patients are Þrst asked to stand straight on the PPG machine as shown in Figure 2. A reference image and an image of the foot sole of diabetic patient are captured. The footprint images are divided into four areas (from heel to toes) and the number of samples, M and N, in a particular foot sole area depending on the size of the particular area of the foot and corresponding image size is represented as (M x N) pixels. The Fourier spectrum F (u, v) of an image, f (x, y) corresponding to a foot area is obtained using equation (1). The spatial frequencies (u and v) are denoted by cycles per distance and for this analysis, since the image size (distances) is given in terms of pixels, the spatial frequencies are represented by cycles per pixels
F (u, v) =
1 MN
M −1 N −1
∑∑ f (x, y ) e
ux vy + − j 2π M N
x =0 y =0
(1)
For u = 0, 1, 2,…M–1, v = 0, 1, 2,…N–1 Spatial frequencies and their distributions of these images are analyzed by performing the 2-D discrete fourier transform (DFT) using MATLAB version 6.1. Using the periodicity property of DFT,[20] the fourier spectrum is shifted to the center of frequency plane. 74
Int J Diab Dev Ctries | July-September 2008 | Volume 28 | Issue 3
The DC component, F (0.0) is deleted as it gives only the average value of the image intensity. The magnitudes of the power spectrum, in each of the foot areas, are obtained by squaring the magnitudes of Fourier spectrum[2] of light intensity variations of foot images and the total power, TP in the image is obtained using equation (2).
M2 ∑ TP = u = − M 2
2 ∑N F (u, v) − F (0,0) v= − 2 N 2
2
(2)
Since for a foot area image, M and N are different, depending on the size of the particular area, the cut-off frequency Do (cycles per pixel) that separates the lower and higher spatial frequency components is deÞned by equation (3).
M D0 = N4 4
if N ≥ M if N ≤ M
(3)
Where D (u, v) is the distance from point (u, v) to the origin of the frequency plane given by equation (4) as follows
D(u , v ) =
2
u +v
2
(4)
The low frequency power (LFP) in Volt 2 and high frequency power (HFP) in Volt2 are calculated using equations (5) and (6), respectively.
LFP =
D 0 2 2 ∑ F (u , v) − F (0,0) D (u ,v ) =0
HFP = TP – LFP
(5) (6)
Now, the PR is calculated by using equation (7) as follows. Multiplication by 100 is to express the PR value as a whole number.
HFP PR = X 100 TP
(7)
The parameter, PR is evaluated for diabetic feet with different levels of loss of sensation and shore levels. The above procedure was done for 14 diabetic subjects and four normal subjects.
[Downloaded free from http://www.ijddc.com on Tuesday, November 18, 2008] Periyasamy et al.: Measures of sensory loss in DM patients
TPD in cm
Right Foot Area 5,6,7 y = 0.0172x + 2.2838 2 R = 0.0243 R=.154
5 4.5 4 3.5 3 2.5 2 1.5 1 0.5 0
Diabetic TPD and Diabetic shore value Linear (Diabetic TPD and Diabetic shore value)
0
10
20
30
40
50
Shore level Figure 3: Variation of two-point discrimination with different shore level of foot sole in the right foot area 5, 6 and 7 for 14 diabetic subjects
TPD in cm
Right foot area 3.4
3.5 3 2.5 2 1.5 1 0.5 0
Diabetic TPD and Diabetic PR value Linear (Diabetic TPD and Diabetic PR value)
0
10
20
30
PR value Figure 4: Variation of two-point discrimination with different PR value of foot sole in the right foot area 3 and 4 for 14 diabetic subjects
TPD measurement using esthesiometer The TPD thresholds were assessed using esthesiometer. The patients were Þrst placed in a comfortable reclining position with eyes closed. Then esthesiometer was used to Þnd the TPD. The two prong tips are made to touch the body part at the same instant. The subject orally stated whether he/she perceived the touch as a single point or as two separate points. Occasionally and without the subject’s knowledge, the subject is touched with only one prong. This prevents the subject from knowing whether or not a double-point stimulus was always delivered. When the subjects consistently perceive one point rather than two points, the TPD is reached and this is recorded in the datasheet. The above procedure was done for 14 diabetic subjects and four normal subjects, respectively.
Results In order to present our results for diabetic subjects, we classiÞed the subjects as ‘with sensation’ and ‘without
sensation’. If the subjects could feel 10 g of SWMF in all areas of the foot, then they were classiÞed as ‘with sensation’ and if they could not feel the monoÞlament in any of the foot area, they were classiÞed as ‘without sensation’. We present our study for 14 DM subjects, among whom Þve subjects were ‘with sensation’ and nine subjects were ‘without sensation’. The following graphs show [Figures 3 and 4] the mean TPD values. The TPD measures are correlated with other measures such as shore and PR values, which is detailed in the following section. Correlation between diabetic foot two-point discrimination and diabetic foot sole (hardness) shore values Figure 3 represents the variation of TPD with different shore levels of foot sole in the right foot area 5, 6 and 7 for 14 diabetic subjects. The correlation coefÞcient (r) was found to be 0.154. It shows that the two values measure different properties of the diabetic foot. The above correlation has been calculated for each area and presented in Table 1. The corresponding regression equation was obtained by analysis of data of 14 diabetic subjects in all speciÞed areas of the foot sole. It is clear from the Table 1 that all the areas do not have any correlation between shore level and TPD values. Therefore, higher levels of hardness of foot sole does not give rise to higher values of TPD. Correlation between diabetic foot two-point discrimination and diabetic foot sole (hardness) shore values – subjects without sensation The correlation has been calculated for each foot area in ‘with sensation’ subjects and presented in Table 2. The corresponding regression equation was obtained by analysis of data of Þve diabetic subjects in all speciÞed areas of the foot sole. It is clear from the Table 2 that some areas do not have any correlation between shore level and TPD values except in area 5, 6 and 7. Therefore, higher levels of hardness of foot sole does not give rise to higher values of TPD. Correlation between diabetic foot two-point discrimination and diabetic foot sole (hardness) shore values – subjects without sensation The correlation has been calculated for each area in ‘without sensation’ subjects and presented in Table 3. The corresponding regression equation was obtained for nine diabetic subjects in all speciÞed areas of the Int J Diab Dev Ctries | July-September 2008 | Volume 28 | Issue 3
75
[Downloaded free from http://www.ijddc.com on Tuesday, November 18, 2008] Periyasamy et al.: Measures of sensory loss in DM patients
foot sole. It is clear from the Table 3 that all the areas do not have any correlation between shore level and TPD values. Therefore, higher levels of hardness of foot sole do not give rise to higher values of TPD. Correlation between diabetic foot two-point discrimination and diabetic foot power ratio values Figure 4 represents the variation of TPD with different PR values of foot sole in the right foot area 3 and 4 for 14 diabetic subjects. The correlation coefÞcient (r) was found to be 0.227. The above correlation has been calculated for each area and presented in Table 4. The corresponding regression equation was obtained by analysis of data of 14 diabetic subjects in all speciÞed areas of the foot sole. It is clear from the Table 4 that all the areas do not have any correlation between PR and TPD values. Therefore, higher PR values of foot sole do not give rise to higher values of TPD. Correlation between diabetic foot two-point discrimination and diabetic foot power ratio values – subjects with sensation The above correlation has been calculated for each area in ‘with sensation’ subjects and presented in Table 5. The corresponding regression equation was obtained by analysis of data of Þve diabetic subjects in all speciÞed areas of the foot sole. It is clear from the Table 5 that all the areas do not have any correlation between PR and TPD values. Therefore, higher PR value of foot sole does not give rise to higher values of TPD.
analysis of data of nine diabetic subjects in all speciÞed areas of the foot sole .It is clear from the Table 6 that all the areas do not have any correlation between PR and TPD values. Therefore, higher PR value of foot sole does not give rise to higher values of TPD.
Discussion While it was the bias of the investigators at the inception of the study that a higher TPD would be found related to increased skin hardness or increased PR, no such relationship was found. This is similar to the observation by Dellon et al,[13] showing the independence of shore values and TPD in Þngers. This independence may be related to the unique and intimate physical juxtaposition of the Merkel cell-neurite complex to the intermediate ridge at the dermal/epidermal junction.[21] The slowly adapting fiber/receptor system that transmits the perception of pressure may function independently of skin compliance because the force is directly transmitted from skin surface to the nerve Þber/receptor.[22] Patil et al, have observed that the shore values and PR have high positive correlation in foot areas; pressure distribution as measured by the PR may be related to compliance as measured by the shore value. Therefore, the reason for the independence of TPD and shore values could be the Table 5: Coefficient of correlation (r) between two-point discrimination and Power ratio (PR) values and the corresponding regression equations in different foot areas of the foot in with intact sensation diabetic subjects Foot areas
Correlation coefficient (r)
Regression equation
0.158 0.227 0.063 0.1 0.104 0.344 0.1 0.44
TPD = 0.0482 PR +1.7733 TPD = 0.0282 PR +1.7344 TPD = 0.008 PR +2.4053 TPD = 0.0165 PR +2.4667 TPD = –0.0192 PR +3.1318 TPD = 0.079 PR +1.2421 TPD = 0.014 PR +2.4651 TPD = –0.0835 PR +3.2377
Correlation between diabetic foot two-point dicrimination and diabetic foot power ratio values – subjects without sensation The above correlation has been calculated for each area in ‘without-sensation’ subjects and presented in Table 6. The corresponding regression equation was obtained by
Right 1, 2 Right 3, 4 Right 5, 6, 7 Right 8 Left 1, 2 Left 3, 4 Left 5, 6, 7 Left 8
Table 4: Coefficient of correlation (r) between two-point discrimination and Power ratio (PR) values and the corresponding regression equations in different foot areas of the foot in diabetic subjects
Table 6: Coefficient of correlation (r) between two-point discrimination and Power ratio (PR) values and the corresponding regression equations in different foot areas of the foot in diabetic subjects without sensation
Foot areas
Foot areas
Right 1, 2 Right 3, 4 Right 5, 6, 7 Right 8 Left 1, 2 Left 3, 4 Left 5, 6, 7 Left 8 76
Correlation coefficient (r) 0.95 0.063 0.109 NA 0.309 0.82 0.78 0.252
Regression equation TPD = 0.363 PR –5.7705 TPD = –0.0048 PR +2.2371 TPD = –0.0328 PR +3.2591 TPD = –0.0715 PR +4.251 TPD = –0.0768 PR +3.536 TPD = –0.1202 PR +5.358 TPD = –0.035 PR +2.65
Int J Diab Dev Ctries | July-September 2008 | Volume 28 | Issue 3
Right 1, 2 Right 3, 4 Right 5, 6, 7 Right 8 Left 1, 2 Left 3, 4 Left 5, 6, 7 Left 8
Correlation coefficient (r)
Regression equation
0.154 0.33 0.134 0.104 0.0002 0.45 0.55 0.6
TPD = –0.0499 PR +3.86 TPD = 0.0354 PR +1.671 TPD = 0.011 PR +2.331 TPD = 0.0157 PR +2.466 TPD = 3E–055 PR +2.736 TPD = 0.1033 PR +1.089 TPD = 0.0649 PR +1.524 TPD = –0.1322 PR +3.806
[Downloaded free from http://www.ijddc.com on Tuesday, November 18, 2008] Periyasamy et al.: Measures of sensory loss in DM patients
same for the independence of TPD and PR. The precise physiological mechanisms that sub serve TPD itself remain poorly elucidated,[21,23] but may be said to be independent of skin compliance and pressure distribution. This independence is probably due to the cortical processing required for TPD and needs further investigation. Although SWMF is a widely used clinical tool to measure the sensory loss, we did not Þnd any particular difference in the TPD values of DM subjects with and without sensation of 10 g monoÞlaments. Thus, there appears to be no particular additional value in measuring loss of protection with monofilaments in comparison to those that assesses the TPD. Similarly, the correlation tables shown above do not differ much with or without sensation. It should be noted that our study is restricted to subjects clinically screened for peripheral artery occlusive disease (PAOD). There were no subjects with clinical vasculopathy. In the presence of maldistribution of blood supply, however, we do not know if these correlations are still valid. As Rendell et al,[24] stressed, the maldistribution between nutritional and thermoregulatory skin blood ßow in the toes of diabetic patients could be directly related to the development of ulcers in the feet and the increase in TPD values. Also, it is to be investigated whether these correlations are speciÞc for DM subjects or applicable to other disease conditions as well. In this paper, we have studied only the correlations of TPD with shore values and PR. The correlations of other modalities of touch such as vibration detection threshold (VDT), cold detection threshold (CDT), warm detection threshold (WDT) and heat pain onset threshold (HPO) with the shore values and PR needs to be investigated.
and more investigation is required studying the relationships of the quickly adapting receptor system’s perception of vibration and skin hardness and pressure distribution. The SWMF (10 g) is found not to provide any additional value in measuring loss of sensation in comparison to TPD. The correlations could help us in avoiding duplication of clinical tests and reduce overall healthcare cost.
References 1.
2. 3.
4.
5. 6.
7.
8.
9.
10. 11.
12.
Conclusion We have evaluated the correlation of different measures of sensory loss such as TPD, shore values and PR in both foot areas of DM subjects. We found that there is no correlation between TPD values measured using esthesiometer and shore values measured using shoremeter in the feet and no correlation between TPD and PR values measured using PPG in the feet. As shore values and PR were found to be highly positively correlated in other studies, TPD could represent different property of the foot compared to the other measures. The mechanism of this independence is not well understood
13.
14.
15.
16.
17.
Bell-Krotoski JS, Weinstein S, Weinstein C. Testing sensibility, including touch-pressure, two point discrimination, point localization and vibration. J Hand Ther 1993;6:114-23. Armstrong DG, Lavery LA, Harkless LB. Validation of diabetic wound classiÞcation. Diabetes Care 1998;21:855-9. Weinstein S. Fifty years of somatosensory research: From the Semmes Weinstein monoÞlaments to Weinstein enhanced sensory test. J Hand Ther 1993;6:11-22. Boulton AJ, Hardisty CA, Betts RP, Franks CI, Worth RC, Ward JD, et al. Dynamic foot pressure and other studies as diagnostic and management aids in diabetic neuropathy. Diabetes Care 1983;6: 26-33. Armstrong DG. Loss of protective sensation: A practical evidencebased deÞnition. J Foot Ankle Surg 1999;38:79-80. Patil KM, Babu M, Oommen PK, Malaviya GN, Hunson A, Braak LH. On-line system of measurement and analysis of standing and walking foot pressures in normal and patients with neuropathic feet. Innov Technol Biol Med France 1996;17:401-8. Gopalakrishna Prabhu K, Mothiram Patil K, Srinivasan S. A new method of analysis of standing foot pressure images for detection of the plantar ulcers in early-stage diabetic neuropathy. Front Med Biol Eng 2001;11:31-43. Romanelli MV, Falanga V. Use of Durometer to measure the degree of skin induration in lipodermatosclerosis. J Am Acad Dermatol 1995; 32:188-91. Piaggesi A, Romanelli M, Schipani E, Campi F, Magliaro A, Baccetti F, et al. Hardness of plantar ulcers in diabetic neuropathic feet. J Diabet Compl 1999;13:129-34. Dellon AL. Computer-assisted sensibility evaluation and surgical treatment of tarsal tunnel syndrome. Adv Podiatry 1996;2:17-40. Dellon ES, Keller KM, Moratz V, Dellon AL. Validation of cutaneous pressure threshold measurements for the evaluation of hand function. Ann Plast Surg 1997;38:485-92. Charanya G, Patil KM, Narayanamurthy VB, Parivalavan R, Visvanathan K. Effect of foot sole hardness, thickness and footwear on foot pressure distribution parameters in diabetic neuropathy. Proc Inst Mech Eng H 2004;218:431-43. Dellon ES, Keller K, Moratz V, Dellon AL. The relationships between skin hardness, pressure perception and two-point discrimination in the Þngertip. J Hand Surg Br 1995;20:44-8. Johansson RS, Vallbo AB. Tactile sensibility in the human hand: Relative and absolute densities of four types of mechanoreceptive units in glabrous skin. J Physiol 1979;286:283-300. Ferreira MC, Rodrigues L, Fels K. New method for evaluation of cutaneous sensibility in diabetic feet: Preliminary report. Rev Hosp Clin Fac Med Sao Paulo 2004;59:286-90. Finnell JT, Knopp R, Johnson P, Holland PC, Schubert W. A calibrated paper clip Is a reliable measure of two-point discrimination. Acad Emerg Med 2004;6:710-4. Craig JC, Kisner JM, Factors affecting tactile spatial acuity. Somatosens Mot Res 1998;15:29-45. Int J Diab Dev Ctries | July-September 2008 | Volume 28 | Issue 3
77
[Downloaded free from http://www.ijddc.com on Tuesday, November 18, 2008] Periyasamy et al.: Measures of sensory loss in DM patients 18. Cavanagh PR, Rodgers MM, Iiboshi A. Pressure distribution under symptom-free feet during barefoot standing. Foot Ankle 1987;7:262-76. 19. Patil KM, Babu M, Oommen PK. On-line system of measurement and analysis of standing and walking foot pressures in normal and patients with neuropathic feet. Innov Technol Biol Med France 1996;17:401-8. 20. Gonzalez RC, Woods RE. Digital Image Processing. 3rd ed. Addison–Wesley (Pub); 1993. 21. Dellon AL, Sensibility, re-education of sensation in the hand. Williams and Wilkins (Pub); 1981. 22. Thomas VJ, Patil KM, Radhakrishnan S, Murthy VB, Parivalavan R. Diabetic feet at risk of plantar ulcers: A new method of analysis of
standing foot pressure images for different foot sole properties. In: Ramakrishnan AG, editor, BIOVISION. Bangalore: Proc Int Conf Biomed Eng; 2001. p. 21-4, 219-22. 23. Dellon AL. The moving two-point discrimination test: Clinical evaluation of the quickly adapting Þber/receptor system. J Hand Surg Am 1978;3:474-81. 24. Rendell M, Bergman T, O’Donnell G, Drobny E, Borgos J, Bonner RF. Micro vascular blood ßow, volume and velocity measured by laser Doppler techniques in IDDM. Diabetes 1989;38:819-24.
Source of Support: Nil, Conflict of Interest: None declared.
Author Help: Online Submission of the Manuscripts Articles can be submitted online from http://www.journalonweb.com. For online submission articles should be prepared in two files (first page file and article file). Images should be submitted separately. 1)
2)
3)
4)
78
First Page File: Prepare the title page, covering letter, acknowledgement, etc., using a word processor program. All information which can reveal your identity should be here. Use text/rtf/doc/pdf files. Do not zip the files. Article file: The main text of the article, beginning from Abstract till References (including tables) should be in this file. Do not include any information (such as acknowledgement, your names in page headers, etc.) in this file. Use text/rtf/doc/pdf files. Do not zip the files. Limit the file size to 400 kb. Do not incorporate images in the file. If file size is large, graphs can be submitted as images separately without incorporating them in the article file to reduce the size of the file. Images: Submit good quality color images. Each image should be less than 1024 kb (1 MB) in size. Size of the image can be reduced by decreasing the actual height and width of the images (keep up to about 6 inches and up to about 1200 pixels) or by reducing the quality of image. JPEG is the most suitable file format. The image quality should be good enough to judge the scientific value of the image. Always retain a good quality, high resolution image for print purpose. This high resolution image should be sent to the editorial office at the time of sending a revised article. Legends: Legends for the figures/images should be included at the end of the article file.
Int J Diab Dev Ctries | July-September 2008 | Volume 28 | Issue 3