No correlation was found between selective temporal losses and selective chromatic losses. These findings ..... Scatterplot showing the relationship between the ...
Investigative Ophthalmology & Visual Science, Vol. 32, No. 13, December 1991 Copyright © Association for Research in Vision and Ophthalmology
Correlation of Chromatic, Spatial, and Temporal Sensitivity in Optic Nerve Disease Scott S. Grigsby,* Algis J. Vingrys,*f Susan C. Benes,t and P. Ewen King-Smith* Spearman rank-order correlations (R) were made between the color-mixture threshold, spatial contrast sensitivity, and flicker sensitivity measurements of 38 patients with a variety of optic nerve disorders. Patients had to satisfy the following criteria: >0.5 log unit loss of chromatic or achromatic sensitivity (compared to age-matched normals), central fixation, no congenital color defects, and no ocular media abnormalities. The results of the analysis show a significant correlation between selective losses of high spatial frequency sensitivity (relative to low) and selective losses of red/green and blue/yellow sensitivities [R = -0.680 (P < 0.001) and R = -0.439 (P < 0.01), respectively]. A mild correlation was found between selective spatial and selective temporal losses [r = -0.399 (P < 0.05)] (ie, low temporal frequency losses correlate with high spatial frequency losses and vice versa). A stronger correlation was found between selective red/green and selective blue/yellow sensitivity losses [R = 0.657 (P < 0.001)]. No correlation was found between selective temporal losses and selective chromatic losses. These findings can be explained in terms of differential losses of three types of fibers: (1) fibers that are particularly sensitive to red/green color, high spatial and low temporal frequencies; (2) fibers signalling blue/yellow color; and (3) fibers that are relatively sensitive to high temporal frequencies and low spatial frequencies. Invest Ophthalmol Vis Sci 32:3252-3262,1991
2. Another type has larger cell bodies with thicker axons and slower conduction times (than those in thefirsttype)4 and also project to the parvocellular layers of the LGN. They are spatially linear (Xlike), have opponent cone input, typically have no center-surround organization (Wiesel and Hubel Type II), and are sensitive to blue/yellow color. 3. The third type has large cell bodies and thick axons with fast conduction times. They project predominantly to the magnocellular layers of the LGN, can be spatially linear (X-like) or nonlinear (Y-like), and have large receptive fields with centersurround organization. They have combined cone inputs to the center and surround (Wiesel and Hubel Type III). They are sensitive to black/white discrimination, low spatial and high temporal frequencies.
The retina encodes information about the world and transmits it to the brain via the optic nerve using a multichannel parallel system. Some properties of this system were first characterized by the pioneering work of Wiesel and Hubel,1 and there have been numerous studies since (see reviews of Shapley2 and Bassi & Lehmkuhle3). These studies found evidence for at least three parallel pathways composed of cells that have different anatomical and physiological properties as described in the following. 1. One type of cell has small cell bodies and thin axons with slow conduction times. They project to the parvocellular layers of the lateral geniculate nucleus (LGN) and are spatially linear (X-like). They have small, receptive fields with opponent cone input and center-surround organization (Wiesel and Hubel Type I) and are sensitive to red/ green color, high spatial and low temporal frequencies.
These classifications are only a general guide. There is no clean distinction between cell types. For instance, there are cells responsive to red/green discrimination that have no center-surround organization (R/ G Type II) and cells responsive to blue/yellow with center-surround organization (B/Y Type I cells). There also are cells with achromatic receptive fields (Type III cells) that project to the parvocellular layers of the LGN and have more parvo-like spatial and temporal properties than the magno Type III cells. Therefore, the three groups described above should be viewed as a first approximation.
From the "College of Optometry and ^Department of Ophthalmology, The Ohio State University, Columbus, Ohio. fCurrent address: Department of Optometry, University of Melbourne, Carlton, Victoria 3053, Australia. Supported by National Institutes of Health Grant EY 04948 and the Ohio Lions Eye Research Foundation, Grove City, Ohio. Submitted for publication: November 21, 1990; accepted July 11,1991. Reprint requests: P. Ewen King-Smith, College of Optometry, The Ohio State University, Columbus, OH 43210.
3252
No. 13
CORRELATION OF SENSITIVITY LOSSES IN OPTIC NERVE DISEASE / Grigsby er ol
By measuring thresholds to stimuli modulated in space (eg, spatial contrast sensitivity), time (eg, temporal contrast sensitivity) or chromaticity, changes from normal sensitivity may be explained in terms of the channel properties described. In particular, visual deficits could be caused by either a change in the properties of the cells or by losses of cells or their projecting fibers leaving the remaining cells and fibers with normal function, or both. For some diseases affecting the optic nerve there is histological evidence for selective loss of nerve fibers. For example, Ronne5 has shown that a selective loss of small cells can be found in chronic alcohol amblyopia, and Quigley6 finds a selective loss of large ganglion cell fibers in glaucoma. Furthermore, there is evidence that in glaucoma the remaining cells retain their normal properties at least until later stages of the disease.7 The question addressed here is whether psychophysical measurements support the hypothesis of cell loss in certain optic nerve diseases, or whether another explanation, such as altered nerve function, better describes the results. To address this question, a complete description of visual function using spatial, temporal, and chromatic stimuli is needed. Most studies have measured visual function using only one or two types of stimuli. For patients with optic nerve disease, studies have tested chromatic and luminance sensitivity (see Fallowfield & Krauskopf8 and Foster et al9), spatial contrast sensitivity (Virsu et al10 and Hyvarinen et al11), temporal contrast sensitivity (Kayazawa et al12 and Plant and Hess1314), or a combination of chromatic andflickersensitivities15 or chromatic and spatial sensitivities.16 pain et al17 have done a comprehensive study using chromatic, spatial, and temporal stimuli on patients with multiple sclerosis. Predominantly nonselective losses of sensitivity to all stimuli were found except in one patient who had selective losses of red/green and blue/yellow sensitivities as well as a selective loss of high spatial frequency sensitivity. These data can be explained by postulating a selective loss of small fibers (which mediate fine spatial and chromatic vision) in the optic nerve of the one patient and a nonselective loss of large and smallfibersin the optic nerves of the other patients. In contrast, the present study uses the spatial, temporal, and chromatic thresholds of patients with a variety of optic nerve problems. It was then determined whether there was any correlation between losses of chromatic, spatial, and temporal sensitivities and whether these losses could be explained by the physical loss of any of the known anatomical substrates or physiological mechanisms.
3253
Materials and Methods Thresholds were measured using a modified QUEST procedure.1819 The QUEST procedure uses a likelihood function to estimate thresholds with a yesno staircase paradigm. Eight cycles were run for each stimulus. The mean of the probability distribution was used as an estimate of the threshold.19 The subject's task was simply to respond if a stimulus was seen and not respond if no stimulus was seen. Blank presentations were included to test the subject's reliability (a false positive rate of under 15% was considered acceptable). All stimuli were viewed centrally from 200 cm with natural pupils. Color and Luminance Thresholds
Color-mixture thresholds were determined by a technique similar to that of Sellers et al.20 One degree circular test spots were generated on a Hitachi 2719 color TV monitor (Hitachi, Tokyo, Japan) using a North Star Horizon computer (North Star, San Leandro, CA) and Motorola MCI495 analog multipliers (Motorola, Phoenix, AZ). By varying the inputs to the three phosphors, spots of various luminances and chromaticities were presented. This allowed the color and brightness sensitivities of the observer to be measured at the same time on the same instrument. The voltage-intensity relationships of the three phosphors were determined before the experiment and nonlinearities were corrected during data collection. Red/ green mixture thresholds were measured by varying the proportions of the red and green phosphors in the central 1 ° of the screen. The red and green phosphors could be either brightened or dimmed in the same or opposite directions for a range of contrasts. This allowed red or green increments and decrements as well as achromatic increments and decrements and equiluminous red and greenflashesto be presented. Similarly, blue/yellow sensitivity could be determined by brightening or dimming either the blue phosphor or a combination of the red and green phosphors. The axes of the red/green and blue/yellow modulations are shown in Figure 1. The apparatus was designed to detect chromatic deficits anywhere in the retinocortical pathway. This necessitated the use of red/green and blue/yellow axes that would allow for the greatest latitude in detecting cone, retinal, optic nerve, and cortical deficits. The chosen red/green axis corresponds to a modulation along a line of constant B-cone output and falls between the protan and deutan axes. This axis provides the best isolation of the red/green channel21 and still allows for the detection and diagnosis of congenital red/green color defects.20 The axis of blue/yellow modulation falls in a direction between the opponent y-b axis and a tritan axis. Al-
3254
INVESTIGATIVE OPHTHALMOLOGY & VISUAL SCIENCE / December 1991
520
Vol. 32
Vos (1978) Modified 1931 C.I.E.
700
though recent studies21-22 have shown that a tritan axis provides the best isolation of the blue/yellow channel, this compromise axis was used to detect not only tritan and peripheral blue/yellow channel defects but also higher level blue/yellow deficits (ie, those corresponding to a classical y-b defect). The spots were presented for .2 sec on a white background consisting of the TV screen (subtending 9.5 X 7.5°) surrounded by a white field (30 X 20°) of approximately the same luminance as the screen (50cd/m2).
Coi
sentai 1-25 andu lope. Tei were WV-VJ nvviuvuvi^o g a u g i n g injin i—jyj LIL.) p i c -
sented for 1 sec in a raised cosine envelope (ie, with gradual onsets and offsets). Evaluation of Normative Data
Spatial and Temporal Contrast Sensitivity Measurements
Spatial and temporal contrast sensitivity functions were measured using a CRT system. Full screen stimuli were presented on a Tektronix 608 monitor, P31 phosphor (Tektronix, Beaverton, OR), using B&K 3020 signal generators (Dynacomp, Chicago, IL) driven by a North Star Horizon computer. The monitor subtended 3.5 X 2.75° when viewed from 200 cm and was surrounded by a 30 X 20° screen of roughly the same luminance (50 cd/m2) and chromaticity. The stimuli had the same average luminance as the blank screen.
To estimate a patient's visual loss a normative database is needed. Normal subjects were tested on the apparatus using the protocol described above. However, instead of averaging the data in 10-year intervals, for example, and using this as age-matched normal data, a method was devised for estimating normative data in one-year intervals. For a given parameter, y (which could correspond to color threshold, spatial contrast sensitivity, etc.), the data were plotted against each subject's age and a mean value of y was determined for a given age (q) by the relation:
2W-
No. 13
CORRELATION OF SENSITIVITY LOSSES IN OPTIC NERVE DISEASE / Grigsby er ol
where: Yi = the value of the parameter y for a given subject of age aj. Wj = the value, at age a^ of a Gaussian weighting function centered at q and having a half-bandwidth of five years. This tends to smooth out the data and avoid sudden transitions between intervals. Grouping the data by 10-year intervals can lead to large differences in agematched normal data for subjects near the boundaries, such as those going from 59 to 60 years old. However, because of the fluctuation in the number of subjects at different ages, some ages would influence the results more heavily than others. For example, if y for age 20 were determined using the formula above from the data of three subjects at age 19, three subjects at age 20 and 20 subjects at age 21, y would correspond more closely to the results for 21-yearolds than for 20-year-olds. To compensate for this, a mean age (aq) corresponding with yq was calculated by the formula:
aq = Therefore, the age corresponding to yq would be aq rather than q. The value of y for 20-year-olds would then be interpolated from the value of y for the a's nearest to it. Normative data were determined in this way for parameters corresponding to red/green, blue/yellow, and black/white thresholds (from 83 normal eyes), thresholds at each spatial frequency (from 72 normal eyes), and thresholds at each temporal frequency (from 75 normal eyes). Data Analysis Color and luminance thresholds were evaluated by the method of King-Smith et al.23 Ellipses were fit to the data, and the length of the ellipse was taken as a measure of color threshold while the width of the ellipse gave a measure of luminance threshold (see, for example, Fig. 2a and b). The lengths and widths of the ellipses are then compared to the age-matched normal data to determine any losses (in log units) of sensitivity. The ratio of the losses (length loss/width loss) gives a measure of the selectivity of the defect. Two parameters were used to evaluate the spatial and temporal contrast sensitivity functions. The overall loss was determined by subtracting the mean of the age-matched normal log sensitivity over all frequencies from the mean of the patient's log sensitivity. The selectivity of the loss was found by plotting the data in
3255
a log loss vs. linear frequency graph, or "visuogram," andfindingthe slope of a linefitthrough the data. For the convention used, a negative slope indicated a relative loss of high frequency sensitivity compared to low, and a positive slope indicated a relative loss of low frequency sensitivity (Fig. 2c and d). The nonparametric Spearman rank-difference correlation method24 was used to avoid the assumptions required for parametric statistics (eg, a normal distribution of losses caused by optic nerve diseases). Subjects The data from 38 subjects (38 eyes) ranging in age from 8 to 83 years (mean 37), were used in the correlations. If a patient had two eyes that fit the criteria for inclusion, only the right eye was used. Subjects with optic nerve disorders were selected if they satisfied the following criteria: >.5 log unit loss of color or luminance sensitivity (compared to age-matched normals), central fixation, no congenital color defects (as measured with a Nagel anomaloscope), and no significant ocular media abnormalities (compared to an agematched population). Subjects had to have reliable thresholds for at leastfiveof the spatial andfiveof the flicker frequencies to allow for a meaningful assessment of the magnitude and selectivity of the losses. Also, because the stimuli were viewed with natural pupils, subjects could not be on medication that altered pupil size. Fixation and ocular media were evaluated by ophthalmologic examination. Refractive error was assessed and corrected. Corrected Snellen acuities ranged from 20/20 to 20/200-1 (log(MAR) of Oto 1.02; mean .36). The following is the breakdown of the number of subjects satisfying the criteria and their conditions: DIDMOAD syndrome, 2; dominant optic atrophy, 10; Leber's optic atrophy, 2; optic nerve drusen, 2; optic nerve hypoplasia, 1; optic neuritis, 10; optic neuropathy, 9; pseudotumor cerebri, 2. Informed consent was obtained from all subjects. Results The losses of visual function could be broadly classified as selective or nonselective. Patterns classified as nonselective show roughly equal losses for all stimuli—spatial, temporal and chromatic. Selective losses occur in many different ways. Losses can be selective between categories (a loss of temporal but not spatial or chromatic sensitivity) or within a category (a loss of high but not low spatial frequency sensitivity). Examples of data from subjects with different types of selective losses are shown in Figures 2 and 3. The subject of Figure 2 is a 38-year-old white male with
3256
INVESTIGATIVE OPHTHALMOLOGY 6 VISUAL SCIENCE / December 1991
Vol. 32
B 20
A 120 60
w
10
rx
i—
§
0
o-
CJ 3:
o
-60 -120
O —10 _l _1 -20
H -120
40
-60 0 60 120 RED CONTRAST, %
-20 0 20 BLUE CONTRAST, %
C/}
LU
en CD
o
-1
0
10
20
30 0
SPATIAL FREQUENCY (c/deg)
10
20
H 40
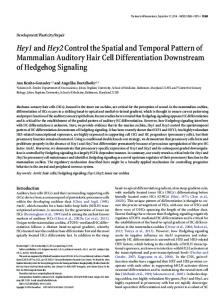
Fig. 2. Color-mixture threshold and contrast sensitivity data for a 38-year-old white man with dominant optic atrophy. Data shown are for the patient's left eye, which had an acuity of 20/ 50-1. The data show a selective loss of red/green sensitivity (A) combined with a high spatial frequency sensitivity loss (C). Blue/yellow (B) and temporal (D) sensitivities are little affected. For the color mixturethresholds (A, B), the patient's data are plotted as diamonds that have been fitted with dashed ellipses. The solid ellipses show the 98th percentile limit of the age-matched norms. For the contrast sensitivity data (C, D), diamonds show the patient's data points and squares are age-matched norms. The visuogram data are plotted as triangles, with the solid circles marking the average sensitivities (over all frequencies), and solid lines showing the regression lines of the visuogram data. This patient's data are plotted as the open triangles in Figures 4-9.
30
TEMPORAL FREQUENCY (Hz)
dominant optic atrophy. The data shown are for the patient's left eye, which had a Snellen acuity of 20/501 (log(MAR) = 0.42). This patient shows a marked selective loss of red-green sensitivity (Fig. 2A) combined with a selective loss of high spatial frequency sensitivity (Fig. 2C). Blue-yellow and black-white sensitivities are only mildly decreased (Fig. 2B) and his temporal frequency sensitivity (Fig. 2D) is slightly decreased at low frequencies. The subject of Figure 3 is a 42-year-old white female with optic neuritis. The data shown are for the patient's left eye, which had a Snellen acuity of 20/32 (log(MAR) = 0.20). This patient shows nonselective losses of red-green, blue-yellow, and black-white sensitivities as given by the lengths and widths of the color-
mixture threshold ellipses (Fig. 3A and B). Her spatial and temporal frequency sensitivities also are rather uniformly depressed but with a mildly selective loss at low spatial (Fig. 3C) and high temporal frequencies (Fig. 3D). Results for the Spearman rank-order correlations and their significance are shown in Table 1. Selectivity refers to the length-to-width ratios and slopes of the visuograms. Significance levels were found using a two-tailed t-statistic applied to the correlation coefficients with 36 degrees of freedom.24 Scatter plots for the six correlations are shown in Figures 4 through 9. Subjects with nonselective losses plot near the origin while those with the most selective losses plot farthest from it. The data for the subject of
No. 13
3257
CORRELATION OF SENSITIVITY LOSSES IN OPTIC NERVE DISEASE / Grigsby er ol
40
40
A
B
20
en
to
• •
ro 1
•
O
•
m " •• •
" 1
ro
-.1
•
•• •
1
ro a. en
1
1 -.05
m ••
1
a. o
-.15
• -
• •
1
0)
Fig. 4. Scatterplot showing the relationship between the selectivity of red/green losses and the selectivity of spatial frequency losses. Negative visuogram slopes correspond to greater losses of high vs. low frequency sensitivity (cf. Fig. 2C). The data show a significant correlation (R = -0.680, P < 0.001), implying a relationship between selective red/green losses and selective high spatial frequency losses. The open triangle corresponds to the data of the patient of Figure 2, and the open diamond is for the data of the patient of Figure 3. The dashed lines show the expected variances (±2 SD) of a sample population of normals having the same age distribution as the given patient population.
1
i—i
en 1
-.2
• -.5 0 .5 1 1.5 log (R/G Loss / Achromatic Loss)
between selective losses of blue/yellow sensitivity and selective losses of red/green sensitivity (Fig. 6). There were no significant correlations between selective losses of temporal sensitivity and selective .05
1
1
1
1
1
11
1
ro c_
•
Ol O
• •
•
-.05
1
ll
•
.
1
1 •
1
•
i
1
1
Fig. 5. Scatterplot showing the relationship between the selectivity of blue/yellow losses and the selectivity of spatial frequency losses. The data show a significant correlation (R = -0.439, P < 0.01) implying a relationship between selective blue/yellow losses and selective high spatial frequency losses. See Figure 4 for details.
•
•i
•
I
•
1
_
• •
1
-.15
1
"""•• •
en
a o
1
•
ro
QJ
1
•
•
CL
1
• •
•
•
ro
1
• o-•""•
ZD CD
1
losses of red/green sensitivity (R = 0.237, not significant) or selective losses of blue/yellow sensitivity (R = -0.024, NS) (Figs. 7 and 8). There is a mild correlation (R = -0.399, P < 0.05)
i—i
1
en
; ;
t 1
-.2
.4
1
1
-.2
1
1
0
H
.2
•
• l
.4
l
l
.6
l
l
l
.8
l
l
1
log (B/Y Loss / Achromatic Loss)
l
1.2
No. 13
CORRELATION OF SENSITIVITY LOSSES IN OPTIC NERVE DISEASE / Grigsby er ol
1
1
1
1
LOSSJ
1.2
romat
u
Fig. 6. Scatterplot showing the relationship between the selectivity of red/green and the selectivity of blue/yellow losses. The data show a significant correlation (R = 0.657, P < 0.001). See Figure 4 for details.
3259
1
1
• • •
l
• .8
•
.6
J
• .4
•
•
.2
•
•
•
A
. •
1•
•
•
•
•
•
o
•
1
•
• "
en
1
-.02
•
"
•
•PH
>
ta_
B ----»
•
ro c_ o a. - . 0 4 E
Fig. 8. Scatterplot showing the relationship between the selectivity of blue/yellow losses and the selectivity of temporal frequency losses. The data are not significantly correlated (R = -0.024, ns). See Figure 4 for details.
%
QJ
• o
-.06 +
•
•
Q. O
-.08
-.1
1
-.4
1
1
-.2
0
.2
.4
.6
.8
1
1.2
log (B/Y Loss / Achromatic Loss) • tients. For example, a selective loss of small (Type I) fibers might be expected to cause a loss of high spatial frequency sensitivity with a loss of red/green color information. Temporal and black/white sensitivity
(as determined from the widths of the ellipses) would be minimally affected by a loss of smallfibersbecause of the relative sparing of the Type III fibers. The subject of Figure 2 shows this pattern. On the other hand, 11
.02
•
•
ro L.
cn o cn
•
•
•
*
-.02 ro c_ o a. E
•
-
•
• • • • •• •
1
• •
_
•
-.04
c
•
QJ
Fig. 9. Scatterplot showing the relationship between the selectivity of spatial frequency losses and the selectivity of temporal frequency losses. There is a mild correlation of high and low spatial frequency sensitivity losses with low and high temporal frequency sensitivity losses, respectively (R = -0.399, P < 0.05). See Figure 4 for details.
•
•
• o
-.06 +
•
QJ Q.
O
•
cn -.08
-.1
1
.2
1
I
-.15
1
1
-.1
1
1
-.05
1
0
Slope of Spatial Visuogram
.05
No. 13
CORRELATION OF SENSITIVITY LOSSES IN OPTIC NERVE DISEASE / Grigsby er ol
the subject of Figure 3 shows a pattern of losses more indicative of an overall depression of visual function with a slightly larger selective loss of the large fast Type III fibers. This conclusion is based on the selective losses to low spatial and high temporal frequency stimuli, to which Type III cells are more sensitive than Type I cells. Selective losses such as these would be expected to cause certain patterns of correlations in the data. Comparing data from a population of patients with losses of small fibers would lead to a strong correlation between selective red/green losses and selective high spatial frequency sensitivity losses. The correlation coefficient found for our population, R = -0.680 (P < 0.001), provides evidence for losses of small fibers in patients with several disparate optic nerve diseases. The lack of significant correlation between red/ green losses and selective temporal losses may seem surprising because a selective loss of Type III fibers might be expected to yield selective losses of sensitivity to high temporal frequencies and to achromatic vision (relative to chromatic vision). An explanation for this lack of correlation may be that achromatic stimuli can be detected by Type I and Type III fibers. Therefore, a selective loss of Type III fibers may have little effect on the achromatic thresholds in the red/ green mixture data if Type I fibers are about equally or more sensitive to an achromatic test spot. The data also show an inverse correlation between the slopes of the spatial and temporal visuograms. This implies a direct relationship between high spatial frequency losses and low temporal frequency losses and vice versa. Because small fibers are preferentially sensitive to small slow stimuli and largefibersare preferentially sensitive to large fast stimuli, selective losses of either of these fibers would lead to the correlation found. Reasons for some of the other significant correlations are not as obvious. For example, why is there such a strong correlation between selective blue/yellow losses and selective high spatial frequency losses (R = -0.439, P < 0.01)? Also, the data show a strong correlation between selective blue/yellow losses and selective red/green losses (R = 0.657, P < 0.001). These correlations are unexpected because the blue/ yellow-sensitive pathway is not known to contribute to the detection of achromatic gratings nor is it likely to be involved in the detection of equiluminous red/ green stimuli. One possible contributing factor is that the modulation used to measure blue/yellow sensitivity did not fall right on the best axis to isolate the peripheral blue/ yellow-sensitive channel (a tritan axis) for reasons already stated. Therefore, the red/green-sensitive sys-
3261
tem also is mildly sensitive to the blue/yellow stimuli. This means the red/green channel could contribute to the measured blue/yellow sensitivities and, thus, cause a correlation between the red/green and blue/ yellow sensitivities, especially if there are large losses of blue/yellow sensitive fibers. However, these correlations may also imply that, at least for our sample, disease processes that affect the small (Type I) fibers may also affect the blue/yellow-sensitive (Type II) fibers, possibly because qf similar anatomical and physiological properties (ie, both are parvo systems). Our analysis so far has assumed that the psychophysical deficits in optic nerve disease are a result of selective (or nonselective) losses of large and small fibers. Still unresolved is whether these deficits are actually a result of losses of fibers or if other factors may be involved. For example, selective losses could be a result of regional variations of deficits.25 Losses in the central fovea may affect red/green sensitivity more than blue/yellow sensitivity because of the relative scarcity of B cones in the fovea. The reverse may be true for the perifoveal region.26 However, this theory doesn't explain why both red/green and blue/ yellow sensitivities can be significantly more elevated than black/white sensitivity in a given area of retina.27 This would imply a selective loss of smallfibersin that region, not just a regional loss. Furthermore, correlations between regional losses and selective chromatic losses would be predicted by selective fiber losses. Instead of a central loss "causing" a selective red/green loss, it may be better to think in terms of a selective Type Ifiberloss causing a selective red/green loss and a central loss. Conversely, a selective loss of blue/yellow-sensitive fibers would cause a blue/yellow loss that would be greatest in the perifovea because of the greater relative density of blue/yellow-sensitive receptivefieldsthere. The data and analysis also are consistent with lesion studies done on monkeys.28'29 These studies use small amounts of ibotenic acid to destroy the parvicellular (to which Type I and Type IIfibersproject) or magnocellular (to which the Type III fibers project) layers of the lateral geniculate nucleus. Postsurgical psychophysical testing shows a dramatic loss of chromatic discrimination and a loss of high spatial frequency sensitivity with parvo lesions but not with magno lesions. Neither lesion causes major deficits in the processing of achromatic stimuli, implying that either pathway can contribute to this task. The major deficit caused by magno lesions is in the detection of flickering stimuli and motion. However, Merigan and Maunsell29 show that while the loss offlickersensitivity occurs primarily at high temporal frequencies, the point of highest temporal resolution doesn't change. This is not consistent with our data nor is it consistent
3262
INVESTIGATIVE OPHTHALMOLOGY & VISUAL SCIENCE / December 1991
with the lesion studies of Schiller et al,28 who show a loss of temporal resolution. These differences may be a result of the absolute light level at which the different experiments were done. Our experiments were done at a mean luminance of 50 cd/m2, and those of Schiller et al were performed at a level below this (in the range of 5-10 cd/m2). However, Merigan and Maunsell used stimuli with a mean luminance of 480 cd/m2. A higher light level allows for a higher absolute modulation and this may give the remaining parvo cells a temporal resolution comparable to the magno cells. Also, stimulus parameters are known to affect the temporal response properties of the parvo cells,30 making it difficult to generalize between experiments. One of the more puzzling aspects of our data set is that there were a number of patients who showed selective losses of high spatial frequency sensitivity combined with selective losses of high temporal frequency sensitivity (Fig. 9). A possible explanation for this has been put forth by Dr. V. A. Billock (personal communication, 1991). The subjects may have a general loss of the Type I and Type IIIfibersbut a greater loss of Type illfibers.This more selective loss of Type III fibers would cause the more selective loss of high temporal frequency sensitivity as discussed above. However, the loss of some of the Type I fibers may result in an undersampling of the image, which may result in a selective loss of high spatial frequency sensitivity as well. Key words: optic nerve disease, chromatic sensitivity, contrast sensitivity,flickersensitivity Acknowledgments The authors thank Dr. Carl R. Ingling, Jr, for a critical reading of the manuscript and Dr. Vincent A. Billock for some helpful discussion. References 1. Wiesel TN and Hubel DH: Spatial and chromatic interactions in the lateral geniculate body of the rhesus monkey. J Neurophysiol 29:1115, 1966. 2. Shapley R: Visual sensitivity and parallel retinocortical channels. Annu Rev Psychol 41:635, 1990. 3. Bassi CJ and Lehmkuhle S: Clinical implications of parallel visual pathways. J Am Optom Assoc 61:98, 1990. 4. de Monasterio FM: Asymmetry of ON- and OFF-pathways of blue-sensitive cones of the retina of macaques. Brain Res 166:39, 1979. 5. Ronne H: Pathologisch-anatomisch Untersuchungen uber alcoholische Intoxikationsamblyopie. Graefes Arch Ophthalmol 77:1, 1910. 6. Quigley HA, Dunkelberger GR, and Green WR: Chronic human glaucoma causing selectively greater loss of large optic nervefibers.Ophthalmology 95:357, 1988. 7. Smith EL, Harwerth RS, Chino YM, Ridder WH, Crawford MLJ, and DeSantis L: Neurophysiological alterations produced by elevated intraocular pressure. Optom Vis Sci 66(Suppl):64, 1989.
Vol. 32
8. Fallowfield L and Krauskopf J: Selective loss of chromatic sensitivity in demyelinating disease. Invest Ophthalmol Vis Sci . 25:771, 1984. 9. Foster DH, Snelgar RS, and Heron JR: Nonselective losses in foveal chromatic and luminance sensitivity in multiple sclerosis. Invest Ophthalmol Vis Sci 26:1431, 1985. 10. Virsu V, Lehtio P, and Rovamo J: Contrast sensitivity in normal and pathological vision. Doc Ophthalmol Proc Series 30:263, 1981. 11. Hyvarinen L, Laurinen P, and Rovamo J: Contrast sensitivity in evaluation of visual impairment due to macular degeneration and optic nerve lesions. Acta Ophthalmol 61:161, 1983. 12. Kayazawa F, Yamamoto T, and Itoi M: Temporal contrast sensitivity in optic neuritis and amblyopia. Ann Ophthalmol 15:331,1983: i 3. Plant GT and Hess RF: Temporal frequency discrimination in optic neuritis and multiple sclerosis. Brain 108:647, 1985. 14. Plant G and Hess R: Temporal frequency channels may be selectively affected in optic nerve demyelination. Invest Ophthalmol Vis Sci 25(Suppl):312, 1984. 15. Hess RF and P|ant GT: The psychophysical loss in optic neuritis: Spatial and temporal aspects. In Optic Neuritis, Hess RF and Plant GT,.editors. Cambridge, MA, University of Cambridge Press, 1986, pp. 109-151. 16. Mullen K.T and Plant GT: Colour and luminance vision in human optic neuritis. Brain 109:1, 1986. 17. Dain SJ, Rammohan KW, Benes SC, and King-Smith PE: Chromatic, spatial, and temporal losses of sensitivity in multiple scierosis. Invest Ophthalmol Vis Sci 31:548, 1990. 18. Watson AB and Pelli DG: QUEST: A Bayesian adaptive psychometric method. Perception and Psychophysics 33:113, 1983. 19. King-Smith PE: Efficient threshold estimates from Yes-No procedures using few (about 10) trials. Am J Optom Physiol Opt 61:119P, 1984. 20. Sellers KL, Chioran GM, Dain SJ, Benes SC, Lubow M, Rammohan K, and King-Smith PE: Red-green mixture thresholds in congenital and acquired color defects. Vis Res 26:1083, 1986. 21. Krauskopf J, Williams DR, and Heeley DW: Cardinal directions of color space. Vis Res 22:1123, 1982. 22. Derrington AM, Krauskopf J, and Lennie P: Chromatic mechanisms in lateral geniculate nucleus of macaque. J Physiol 357:241, 1984. 23. King-Smith PE, Vingrys AJ, and Benes SC: Visual thresholds measured with color video monitors. Color Research and Application 12:73, 1987. 24. Wyatt WW and Bridges CM Jr: Statistics for the Behavioral Sciences. Boston, D.C. Heath and Co., 1967. 25. Hart WM: Acquired dyschromatopsias. Surv Ophthalmol 32:10, 1987. 26. Hart WM and Silverman SE: Acquired dyschromatopsias are determined in part by the pattern of foveal/perifoveal damage to vision. Invest Ophthalmol Vis Sci 30(Suppl):409, 19.89. 27. King-Smith PE, Vingrys AJ, Earley MJ, Perry M, and Benes SC: On the analysis of acquired color defects. Invest Ophthalmol Vis Sci 30(Suppl):409, 1989. 28. Schiller PH, Logothetis NK, and Charles ER: Role of the coloropponent and broad-band channels in vision. Vis Neurosci 5:321, 1990: 29. Merigan WH and Maunsell JHR: Macaque vision after magnocellular lateral geniculate lesions. Vis Neurosci 5:347, 1990. 30. Marroco RT: Sustained and transient cells in monkey lateral geniculate nucleus. Conduction velocities and response properties. J Neurophysiol 39:340, 1976.