ISSN 0103-6440
Brazilian Dental Journal (2015) 26(1): 11-18 http://dx.doi.org/10.1590/0103-6440201300290
Correlation of Fractal Dimension with Histomorphometry in Maxillary Sinus Lifting Using Autogenous Bone Graft Rafael Scaf de Molon1, Wagner Nunes de Paula1, Rubens Spin-Neto2, Mario Henrique Arruda Verzola1, Guilherme Monteiro Tosoni1, Raphael Carlos Comelli Lia2, Gulnara Scaf1, Elcio Marcantonio Jr1
The aim of this study was to determine the pattern of bone remodeling after maxillary sinus lifting in humans by means of fractal dimension (FD) and histomorphometric analysis. Therefore, the correlation between FD and the histomorphometric findings was evaluated. Sixteen patients with posterior edentulous maxilla were enrolled in this study. Maxillary sinus lifting was performed using autogenous bone grafted from the mandibular retromolar area. Three direct digital panoramic radiographs were obtained: before surgery (Group 1), immediately postoperatively (Group 2) and after 6 months of healing (Group 3) for FD analysis. Biopsies were taken after 6 months, processed and submitted to histological and histomorphometric analysis. Data were analyzed by Shapiro-Wilk test and ANOVA test followed by a Tukey test (a=0.05). The bone volume fraction of newly trabecular bone (TB) and medullary area (MA) was measured as 62.75%±17.16% and 37.25±17.16%, respectively. Significant difference in FD analysis was measured between Group 1 and Group 3. No significant difference was found in the correlation between FD and histomorphometric analysis for TB and MA (p=0.84). In conclusion, all performed analyses were effective in assessing the bone-remodeling pattern in the maxillary sinus, offering complementary information about healing and predictable outcomes. There were no correlations between FD and histomorphometric analysis.
Introduction
The use of osseointegrated implants is a widely used procedure to restore the functional and aesthetic of the patients, with a high survival rate. However, alveolar bone resorption after tooth extraction, and/or pneumatization of the maxillary sinus, result in insufficient horizontal and vertical bone dimension for the implant placement in an ideal three-dimensional position (1). Sinus lift, firstly described by Boyne and James (2), is a surgical approach that enables the placement of appropriate length implants due to the elevation of the sinus membrane from the maxillary sinus, allowing the interposition of bone grafts, increasing the bone height in the posterior edentulous maxilla (3) for the long term implant stability. Surgical procedures for sinus lifting floor are commonly performed using autogenous bone grafts and/or bone substitutes. Autogenous bone graft still represents the gold standard for grafting materials especially due to its osteogenic, osteoinductive and osteoconductive characteristics as shown in a recent study (4). Bone quality and volume in maxillary sinus are a major determinant of implant prognosis (5) and thus, its evaluation is important to the appropriate treatment plan. Esposito et al. (6), showed that low bone quality as one of the most important factors associated with oral implant failures due to biological
1Department
of Diagnosis and Surgery, Araraquara Dental School, UNESP - Univ Estadual Paulista, Araraquara, SP, Brazil 2Oral Radiology, Department of Dentistry, Aarhus University, Aarhus, Denmark 3Department of Physiology and Pathology, Araraquara Dental School, UNESP - Univ Estadual Paulista, Araraquara, SP, BrazilCorrespondence: Prof. Dr. Elcio Marcantonio Jr., Rua Humaitá, 1680, 14801-903 Araraquara, SP, Brasil. Tel.: +55-16-3301-6378. e-mail:
[email protected]
Key Words: bone graft, dental implants, digital radiography, maxillary sinus, panoramic radiograph.
causes. Therefore, preoperative bone quality assessment is important for oral implant surgery planning. A previous study (7) evaluated by histomorphometry the trabecular bone quality in the posterior maxilla, and showed lower trabecular bone number, connectivity and volume compared to the anterior maxillae. Thus, evaluating the bone architecture in posterior maxillae is fundamental to choose the length of the healing period that is suitable for implant rehabilitation. Currently, many techniques have been established in order to evaluate the bone quality and to quantitatively characterize structural changes of bone at sites for future implant placement, such as histological (1,4), computed tomography (CT) (8), cone-beam CT (9), and fractal dimension (FD) analysis (10,11). Among these, FD analysis has been introduced as an accurate, easily available and economical method (12). FD is a technique for quantitative and texture evaluation of geometric structures that exhibit patterns through the image (13), which received particular attention for application in panoramic (14-17) and periapical radiographs (18,19). The structure is characterized by a single number, the fractal dimension, which is calculated with a computer algorithm (13). FD is commonly used in non-standardized radiographs, to evaluate and quantify a cancellous bone structure for the detection
Braz Dent J 26(1) 2015
of bone changes (20), apical healing (21), periapical bone (22), and systemic conditions such as osteoporosis (23,24). FD analysis uses a box-counting algorithm to quantify the trabecular bone pattern through counting the bone marrow and trabecular bone interface and also to access the trabecular and medullar bone boundary (25). In this method, when a higher box counting value is reached, more complex is the bone structure. To the best of our knowledge, this is the first clinical study that compared the fractal dimensional analysis with the histomorphometric parameters to determine the bone graft-remodeling pattern from the moment of the grafting procedure until the moment of implant installation. Thus, the aim of this study was to determine the pattern of bone remodeling after maxillary sinus lifting in humans by means of fractal dimension (FD) and histomorphometric analysis. Therefore, the correlation between FD and the histomorphometric findings was evaluated.
Material and Methods
R.S. de Molon et al.
Study Population
The study protocol was conducted according to the principles outlined in the Declaration of Helsinki (last revised Seoul, Korea, 2008) and the protocol was approved by the institutional Ethics Committee (protocol #14/2007) before enrollment the patients. The study population consisted of 16 partial edentulous patients (9 females and 7 males; mean age: 49) needing implant treatment, recruited at the Department of Periodontology. The inclusion criteria involved patients requiring unilateral sinus floor augmentation with a residual alveolar bone crest height of 2-5 mm (based on panoramic images), absence of systemic conditions such as diabetes mellitus, sinus infection or alveolar bone lesions, and non-smokers. The patients were fully informed about the treatment and a written informed consent was obtained prior to commencement of treatment. These patients underwent panoramic radiographs in three stages of treatment: preoperative (Group 1 - G1), immediately postoperative after sinus lifting and bone grafting (Group 2 - G2), and 6 months postoperative (Group 3 - G3).
Autogenous Bone Grafting Prior to the sinus lifting surgery, conventional panoramic radiography was performed to evaluate the maxillary sinus and the residual vertical bone height (G1). To obtain the bone graft from the mandibular angle, the procedure was performed under local anesthesia (Mepivacaine 2% and Epinephrine 1:100.000; DFL, Rio de Janeiro, RJ, Brazil). To harvest the mandibular bone, an access preparation was carried out with a crestal and vertical releasing incision in the retromolar region. Then, a mucoperiosteal flap was 12
obtained by exposing the buccal wall and the oblique line. The osteotomy was performed with rotating instruments and the cortical block was obtained with a hammer and chisel. The mucoperiosteal flap was repositioned and the defect was sutured with Vicryl 4-0 thread (Ethicon; Johnson & Johnson SA, São Paulo, SP, Brazil). The graft was kept until its use in sterile saline solution.
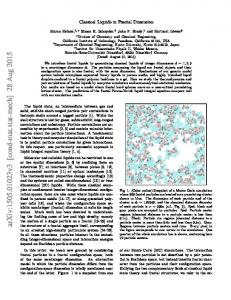
Sinus Lifting Procedure Under local anesthesia, a crestal incision in the maxillary edentulous area followed by two vertical incisions extended both mesial and distal to the sinus lateral wall was performed. The mucoperiosteal flap was detached to full exposure the maxillary lateral sinus wall. A lateral window approach was performed, the cortical bone wall was detached and the Schneiderian membrane was elevated, with the aid of special curettes (Hu-Friedy, Chicago, IL, USA). The autogenous bone graft was particulate using a bone mill (Neodent, Curitiba, PR, Brazil) and was inserted up to the sinus wall (Figs. 1A and 1B). The flaps were repositioned and sutured with Vicryl 4-0 thread. Immediately after the surgical procedure, a postoperative panoramic radiography was performed (G2). All patients received post-operative instructions, oral antibiotics (amoxicillin, 500 mg) and oral anti-inflammatory (mimesulide, 100 mg). The sutures were removed 10 days after the surgical procedure, and the area remained without influence of direct load during the entire bone regeneration phase.
Biopsy Harvesting Six months after sinus floor augmentation a panoramic radiography was taken (G3). Then, bone biopsies were harvested with a trephine bur (Trephine Burr, 2.0 mm diameter, 13 mm long; 3i Implant Innovations, Inc., Palm Beach Gardens, FL, USA) during implant site preparation. One bone biopsy cylinder was obtained and the trephine sites were used for implant placement (Figs. 1C and 1D). The biopsy involved the residual maxillary bone and augmented sinus (bone graft), and preparation depth was defined from the planned implant length. The biopsy samples were stored in 10% buffered formaldehyde solution for 3 days to preserve the structures to be evaluated. Thereafter, the biopsy samples were processed for decalcified section preparation by immersion in a decalcification Morse solution (1:1 sodium citrate 20% + formic acid 50%) for 5 to 6 weeks at room temperature (with 3 solution changes per week) and were then embedded in paraffin. Serial section of 6-μm thickness were obtained using an automatic microtome (Jung Supercut 2065, Leica Instruments GmbH, Heidelberg, Germany), mounted on slides and stained with hematoxylin and eosin (H/E).
Braz Dent J 26(1) 2015
Histological and Histomorphometric Analysis
(UTHSCSA, version 3.00, San Antonio, CA, USA). For the descriptive histological analysis, the parameters evaluated were: the type and the quality of newly formed bone, pattern of bone remodeling, bone graft reaction, and inflammatory reaction The histomorphometric analysis was made to directly measure the percentage of bone formation 6 months after sinus floor augmentation. Selected cuts for histomorphometric analysis followed the semi-series standard: the first section of the first slide was selected, and then four sections sequencing were despised and so on. Ten sections were evaluated from each specimen.
Fractal dimension analysis in sinus lifting
The histological evaluation was made using an optical microscope (Diastar; Leica microsystems GmbH, Wetzlar, Germany) at 100× magnification. Images were selected and transferred to a computer display through a digital camera (DFC-300-FX, Leica microsystems GmbH) attached to the optical microscope allowing histomorphometric measurements and histological descriptive analysis. A blinded and calibrated examiner performed the descriptive histological and histomorphometric analysis. The digital images of histological slides were imported and analyzed into the program Image Tool for Windows
Figure 1. A and B: Clinical procedure for sinus floor augmentation using a lateral window approach and autogenous bone graft harvested from the mandibular retromolar area. C and D: Bone biopsy harvested 6 months after the sinus lift procedure and the trephine sites were used for implant placement.
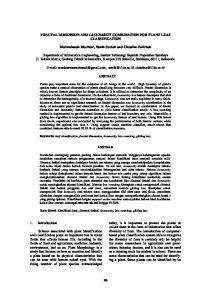
Figure 2. Representative images of the bone biopsy showing the area of interest that was represented by the whole grid (26 mm x 38 mm), which was positioned from the reversal line, disregarding 1 mm of distance in direction to the newly formed bone. 13
Braz Dent J 26(1) 2015
Using image managing/editor software (Adobe Photoshop, Adobe Systems Incorporated, San Jose, CA, USA) a grid of 26 mm x 38 mm was constructed and overlaid on the digital images obtained from the histological sections. The area of interest was represented by the whole grid, which was positioned from the reversal line, disregarding 1 mm of distance in direction to the newly formed bone (Fig. 2). Using dedicated software (Image Tool, UTHSCSA ImageTool), the areas occupied by the trabecular bone (TB) and medullary area (MA) were measured separately. Thus, it was measured the percentage of space occupied by the two structures, in relation to its newly formed area.
R.S. de Molon et al.
Radiographic Examination For radiographic examination, the three panoramic radiographs were taken with the Ortophantomographic OP 100 equipment (Instrumentarium Image, DenOptix Digital Imaging System; Dentsply Gendex, Des Plaines, IL, USA) set to 70 kVp and 6 mA. Using image J software (http://rsb. info.nih.gov/ij/index.html; version 1.36b / NIH software), a region of interest (ROI) was created and saved and set to a width of 64 pixels and a height of 56 pixels. Then, the three panoramic radiographs were superimposed to facilitate the positioning of the ROI. After the ROI selection on each radiographic image, the image was transformed into binary adjusting the threshold corresponding to the median of the histogram (Fig. 3). The images of the ROI (s), transformed into binary were saved in BMP (Bitmap Image File) for subsequent fractal dimension analysis.
Tukey’s test with a 5% significance level. Histomorphometric data were expressed as means and standard deviation of trabecular bone and medullary area. Pearson’s correlation was performed to assess the behavior of histomorphometric data of trabecular bone and medullary area in relation to the fractal dimension data. This evaluation compared the data of fractal analysis after 180 days, same period that the biopsy was removed.
Results
Descriptive Histologic Analysis In the descriptive histologic analysis it was observed characteristics of trabecular bone, in varying quantity through the sections (Figs. 4A and 4B). In some regions, the calcified bone tissue is augmented, with marrow space
Fractal Dimension Analysis Fractal dimension analysis was calculated by the box-counting method using Benoit 1.3 software (Trusoft International Inc, St. Petersburg, FL, USA) as follows: If S = log (number of windows) x log (window size) then FD=(1-S). This method splits the image into small self-similar images. These small binary images, calculates a mathematical formula that generate fractals values between 1 and 2, in which 1 corresponds to the value of a substantially uniform structure in a predetermined fixed space. When the fractal dimension is 2, the biological structure occupies all the available space of a region with a predetermined area.
Data Analysis Statistical analysis was performed using specific software (GraphPad Software Inc., San Diego, CA, USA). Shapiro-Wilk test was used to assess whether data respected the theorem of the central distribution. The results showed that the data distribution was normal, and then parametric tests were used for analysis. To evaluate the differences between the periods, was used the one-way analysis of variance followed by a post-test of multiple comparisons 14
Figure 3. Panoramic radiographic examination: A: Before sinus lifting; B: Immediately after the sinus floor augmentation; C: 6 months after surgery. Images show the region of interest that was transformed into binary images adjusting the threshold corresponding to the median of the histogram for subsequent fractal dimension analysis.
Braz Dent J 26(1) 2015
arranged osteocytes with osteoblasts surrounding the tissue, consistently disposed amid osteoclasts (Fig. 4F). No inflammatory process was observed.
Histomorphometric Analysis The mean and standard deviations of the percentage of bone filling for trabecular bone and medullary area 6 months after sinus lift and bone graft were 62.75±17.16% for trabecular bone (TB) and 37.25±17.16% for medullar area (MA). These results were significantly different from each other (p