Cerebral Cortex March 2014;24:593–599 doi:10.1093/cercor/bhs339 Advance Access publication November 11, 2012
Correspondence Between Stimulus Encoding- and Maintenance-Related Neural Processes Underlies Successful Working Memory Jessica R. Cohen, Kartik K. Sreenivasan and Mark D’Esposito Helen Wills Neuroscience Institute, University of California, Berkeley, CA, USA J.R.C. and K.K.S. contributed equally and are listed in alphabetical order.
The ability to actively maintain information in working memory (WM) is vital for goal-directed behavior, but the mechanisms underlying this process remain elusive. We hypothesized that successful WM relies upon a correspondence between the neural processes associated with stimulus encoding and the neural processes associated with maintenance. Using functional magnetic resonance imaging, we identified regional activity and inter-regional connectivity during stimulus encoding and the maintenance of those stimuli when they were no longer present. We compared correspondence in these neural processes across encoding and maintenance epochs with WM performance. Critically, greater correspondence between encoding and maintenance in 1) regional activity in the lateral prefrontal cortex (PFC) and 2) connectivity between lateral PFC and extrastriate cortex was associated with increased performance. These findings suggest that the conservation of neural processes across encoding and maintenance supports the integrity of representations in WM. Keywords: fMRI, functional connectivity, individual differences, working memory Introduction Working memory (WM) comprises the ability to actively retain and to manipulate information over short delays and is therefore critical for goal-directed behavior. Recent theories have posited that sensory, mnemonic, and control processes that encode a representation into WM and processes involved in maintaining the representation in WM when the item is no longer present rely on the same neural circuitry (Postle 2006; D’Esposito 2007). However, there is evidence that the neural populations involved in WM encoding and those involved in WM maintenance are nonoverlapping; the population of neurons that are active during both encoding and maintenance is often a small portion of the neurons that are active during encoding or maintenance alone (Fuster 1973; Funahashi et al. 1990; Nakamura and Kubota 1995; Munk et al. 2002; Takeda and Funahashi 2007). For example, Funahashi et al. (1990) identified neurons in principal sulcus that displayed significant changes in firing either during the cue period (corresponding to WM encoding), delay period (corresponding to WM maintenance), or response period of a WM task. Only 16% of these neurons were active during both cue and delay periods, and of the neurons showing a significant response during the delay period, only 25% were similarly active during the cue period. Other evidence suggests that encoding and maintenance activity may even arise from distinct neural generators (Malecki et al. 2009). It is important to note that the above studies focused only on significantly active (or significantly inhibited) neurons; many neurons do not display significant changes in firing rate © The Author 2012. Published by Oxford University Press. All rights reserved. For Permissions, please e-mail:
[email protected]
during WM tasks. Recent research using functional magnetic resonance imaging (fMRI) in humans has indicated that these subthreshold neurons may be important for WM as well. When restricting analyses to early visual areas, it has been found that subthreshold patterns of activity during WM maintenance are similar to those observed during stimulus perception (Harrison and Tong 2009; Serences et al. 2009; see also Lewis-Peacock et al. 2012). These results underscore the importance of examining both above- and below-threshold neurons or voxels to obtain a fuller picture of the mechanisms of successful WM maintenance. In addition to regional activity, WM relies on communication between regions (Fuster et al. 1985; McIntosh et al. 1996; Honey et al. 2002; Gazzaley et al. 2004). While some evidence indicates qualitative similarity in inter-regional coupling during encoding and maintenance (Gazzaley et al. 2004), studies directly comparing functional connectivity across these 2 WM subprocesses have highlighted differences in the pattern and degrees of connectivity between encoding and maintenance (Woodward et al. 2006; Chang et al. 2007). Thus, the functional relevance of correspondence in neural activity between encoding and maintenance remains unclear. In the current study, we compared fMRI activity during WM encoding and maintenance epochs to provide direct evidence for the hypothesis that the correspondence between the neural processes associated with encoding and maintenance processes is critical for WM. We analyzed the data from 64 participants who performed a delayed matching task that required participants to retain 4 stimuli in WM (Remember condition) or to view the stimuli without engaging WM (View condition; Gazzaley, Cooney, McEvoy, et al. 2005; Fig. 1). This task temporally segregated stimulus encoding (which occurred when the sample stimuli were presented) from maintenance (which occurred during a blank delay period), allowing us to ascribe neural activity recorded during different stages of each trial to individual processes underlying WM (Zarahn et al. 1997, 1999; Pessoa et al. 2002; Jha et al. 2004; Yoon et al. 2006). In this study, we use the term “neural similarity” as shorthand for correspondence between encoding and maintenance processes. Our analyses focused on WM-related activity in lateral prefrontal cortex (PFC) and higher-level visual regions within extrastriate cortex (EC), 2 regions that have been shown to be involved in WM (Zarahn et al. 1999; Pessoa et al. 2002; Sakai et al. 2002; Ranganath et al. 2004; Lepsien and Nobre 2007) and that are known to exhibit inter-regional coupling during WM (Fuster et al. 1985; Gazzaley et al. 2004; Rissman et al. 2008). We quantified the degree to which maintenance activity corresponded to encoding activity for each participant, and we compared this metric to task accuracy to determine the relationship between neural
Downloaded from http://cercor.oxfordjournals.org/ at Acquisitions Dept.,Serials/ Milton S. Eisenhower Library/The Johns Hopkins on May 6, 2014
Address correspondence to Mark D’Esposito, UC Berkeley, 1 Barker Hall, MC#3202, Berkeley, CA 94720 USA. Email:
[email protected]
similarity and the integrity of WM. Our analyses dissociated neural activity related to performance, which is presumably more directly related to essential WM functions, from neural activity unrelated to task performance, which may support other cognitive processes. The underlying logic of this approach is that neural similarity is indicative of shared neural operations or representations. Similar logic forms the basis of powerful fMRI analysis techniques such as fMRI adaptation (Grill-Spector and Malach 2001; Henson and Rugg 2003) and multivoxel pattern classification (Kriegeskorte et al. 2006; Norman et al. 2006). A key advantage of the present analysis was our use of a large sample size. fMRI studies examining individual differences tend to be underpowered, leading to artificially inflated correlation values (Yarkoni 2009; Yarkoni and Braver 2010). Our prediction was that greater neural similarity would result in more successful task performance. Materials and Methods Participants Sixty-four healthy adult participants were included in this analysis. The participants were between the ages of 18 and 35 (mean age = 22.4 years, standard deviation [SD] = 3.1 years; 27 female). All participants were right-handed with normal-to-corrected vision and were not taking any medications with psychoactive, cardiovascular, or homeostatic effects. All participants provided written informed consent according to the procedures of the University of California, Berkeley Institutional Review Board. Inclusion criteria for this analysis included: blood oxygen level-dependent (BOLD) and behavioral data for at least two-thirds of the trials in the relevant conditions (Remember and View, see below), all relevant anatomical scans (gradient-echo multi-slice [GEMS] and MP-FLASH), and a response rate of >80% in the Remember condition. Experimental Design and Procedure We analyzed both published (Gazzaley, Cooney, McEvoy, et al. 2005) and unpublished data from a delayed matching WM task (Fig. 1). On each trial, participants viewed 4 sequentially presented images (2 faces and 2 scenes in a randomized order). Each image was presented for 800 ms, with a 200-ms blank interval between consecutive stimuli. A 9-s delay period (fixation cross) followed stimulus presentation. A single probe stimulus followed the delay period and remained on the screen for 1 s. Finally, there was a 10-s intertrial interval (fixation cross) before the start of the next trial. Trial types were presented in a blocked fashion, with a self-paced instruction screen at the start of each block. The details of this task have been previously described elsewhere (Gazzaley, Cooney, McEvoy, et al. 2005). Here, we focus on the 2 conditions that were pertinent to the present analyses: Remember and View. On Remember trials, participants were asked to remember all 4 images and respond with a button press whether the
594 Working Memory Relies on Encoding-Maintenance Correspondence
•
Cohen et al.
fMRI Data Acquisition and Processing Imaging data were collected with a 4-T Varian INOVA scanner equipped with a transverse electromagnetic send and receive radio frequency head coil. Functional data were obtained with a 2-shot T2*-weighted echo-planar imaging (EPI) sequence (18 slices, slice thickness 5 mm, repetition time [TR] = 2000 ms, echo time [TE] = 28 ms, matrix 64 × 64, field of view 224 mm). Following acquisition, slicetiming correction was applied to the functional data using a sinc interpolation method. Each shot of half k-space was combined with the bilinear interpolation of the 2 flanking shots to result in an interpolated TR of 1000 ms. Two anatomical scans were also collected: a T1-weighted GEMS anatomical scan with the same slice prescription as the functional images (TR = 200 ms, TE = 5 ms, matrix 256 × 256, field of view 224 mm), and a high-resolution 3-dimensional MP-FLASH (TR = 9 ms, TE = 5 ms, matrix 256 × 256 × 128, field of view 224 × 224 × 198 mm). Imaging data were preprocessed using FSL 4.1 (FMRIB’s Software Library: www.fmrib.ox.ac.uk/fsl). The preprocessing steps included MCFLIRT for motion correction and BET to extract the brain from the skull. As our approach involved examining differences across individuals, all analyses were conducted in individual participant space. fMRI Data Analysis Statistical analysis was conducted in AFNI (Cox 1996) under the assumptions of the general linear model (GLM). Images were spatially smoothed using a 5-mm full width at half maximum Gaussian kernel. All task runs were concatenated. The statistical model included events for cue, delay, and probe for correct trials, separately for each task condition. Incorrect and missed trials for cue, delay, and probe events were included as nuisance regressors. Cue and probe events began at stimulus onset and lasted the duration of the stimulus (4 s for the cue and 1 s for the probe). Delay events began at the 4th second of the delay period and lasted 1 s. Previous analyses have demonstrated that temporally separating regressors by 4 s results in low autocorrelation between 2 task phases and is therefore sufficient to produce independent estimates of cue-related activity and delay period activity (Zarahn et al. 1997, 1999). Several previous studies have employed a similar approach to isolate activity from different task stages of delayed recognition tasks (Pessoa et al. 2002; Jha et al. 2004; Yoon et al. 2006). To ensure that the specific regressors utilized in the current study were sufficiently independent, we computed the autocorrelation function of the time series within each of our regions of interest (ROIs; see below for how we defined the ROIs) as in Zarahn et al. (1997). This autocorrelation analysis was conducted in each voxel separately for Remember and View conditions. Each voxel’s autocorrelation was then averaged across ROIs to result in a single autocorrelation function for each ROI for each condition. With a 4-s temporal separation between regressors, the autocorrelation was 0.25 for Remember trials and 0.30 for View trials—nearly identical to the acceptable value of 0.29 reported previously (Zarahn et al. 1997). All regressors were created by convolving a boxcar function of the appropriate length for each event with a canonical gamma hemodynamic response function. In addition to the above regressors, estimated motion parameters were included as nuisance regressors. Linear contrasts were performed for the comparisons of interest for Remember and View trials: overall (cue + delay + probe—baseline), encoding (cue—baseline), and maintenance (delay—baseline). The View condition was designed specifically to act as a nonmemory control condition for the task we used, given that it matches the sensory and timing information in the Remember condition, but
Downloaded from http://cercor.oxfordjournals.org/ at Acquisitions Dept.,Serials/ Milton S. Eisenhower Library/The Johns Hopkins on May 6, 2014
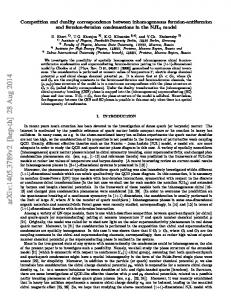
Figure 1. Experimental design (adapted from Gazzaley, Cooney, McEvoy, et al. 2005). On each trial, participants viewed 4 sequentially presented cue images followed by a blank delay period. A single probe stimulus followed the delay. On Remember trials (top row), participants encoded the cue images and were asked to report with a button press whether the probe matched one of the cue images. On View trials (bottom row), participants were instructed to view the cue images and to respond indicating the direction of an arrow probe that pointed either left or right.
probe image, which was either a face or a scene, matched 1 of the 4 cue images. On View trials, participants were instructed to view all 4 images and were probed with an arrow. They were asked to respond with a button press indicating the arrow’s direction. For the Remember condition, half of the probes were seen earlier in the trial, while half were novel images. For the View condition, half of the arrows pointed left and half pointed right. Eleven participants were rewarded based on performance; the remaining participants were not (results did not significantly differ between rewarded and unrewarded subjects).
Identification of ROIs Functional ROIs were created to limit our analyses to regions known to be integral to WM: left and right inferior frontal gyrus (IFG) and middle frontal gyrus (MFG) within lateral PFC, and left and right EC (Zarahn et al. 1999; Pessoa et al. 2002; Sakai et al. 2002; Ranganath et al. 2004; Lepsien and Nobre 2007). An additional control ROI that is not commonly related to visual WM, the postcentral gyrus (PoCG), was created to determine whether any effects found were specific to WM-related brain regions. First, we defined structural ROIs of these 4 regions on a standard brain (MNI152). The structural IFG, MFG, and PoCG were defined using unthresholded templates of the HarvardOxford Probabilistic Brain Atlas (FSL; provided by the Harvard Center for Morphometric Analysis). The structural EC included the lingual gyrus, the parahippocampal gyrus, posterior portions of the fusiform and inferior temporal gyri, and the surrounding occipital cortex (Fig. 2). To transform structural ROIs into individual participant space, a 2-step normalization process with FSL’s FLIRT module for linear registration was used. First, the parameters to register the GEMS anatomical image to the high-resolution MP-FLASH anatomical image (7 degrees of freedom [DOF]) were computed. Next, the parameters to register the MP-FLASH to standard MNI152 space (12 DOF) were computed. These transformation matrices were combined to provide the transform from EPI space (which was identical to the GEMS anatomical space) to MNI space, and then reversed so as to provide the reverse-normalization parameters to register the standardized, structural ROIs into individual participant space. The functional ROIs were participant-specific. They consisted of the 30 most active voxels in each hemisphere within each structural ROI from the overall Remember–overall View contrast (Remember [cue + delay + probe] − View [cue + delay + probe]). To ensure that the reported results were not specific to the manner in which functional ROIs were chosen, we repeated these analyses creating subject-specific ROIs for the 50 most active voxels. The results were consistent; thus, we are only reporting results from the 30 most active voxels.
Figure 2. Regions of interest. Structural ROIs from which the subject-specific ROIs were created: inferior frontal gyrus (IFG; light blue), middle frontal gyrus (MFG; dark blue), extrastriate cortex (EC; red), and postcentral gyrus (PoCG; yellow).
Proportion Overlap Analysis Based on evidence that the extent of neural activation correlates with WM performance (Rypma and D’Esposito 1999), we assessed the degree to which above-threshold neural activity during maintenance corresponded to above-threshold encoding activity. To do so, we calculated the proportion of active delay period voxels that were also active during the cue period of the task for each participant. First, we counted the number of active voxels within each ROI (thresholded at uncorrected t > 1.5) in the cue/delay conjunction. To examine this conjunction as a proportion of voxels active during WM maintenance, we divided the conjunction by the total number of significantly active delay voxels to get the Proportion Overlap separately for Remember and View. Previous studies identifying WM-relevant voxels have similarly isolated significant delay activity and tracked the corresponding activation across other task epochs (Nakamura and Kubota 1995; Postle et al. 2003; Tsujimoto and Sawaguchi 2004). Finally, we subtracted View Proportion Overlap from Remember Proportion Overlap to get the overall Proportion Overlap values reported below.
Spatial Similarity Analysis Next, we calculated the degree to which the spatial patterns of BOLD activity during maintenance corresponded to the spatial patterns of BOLD activity during encoding, regardless of intensity (Spatial Similarity; Aguirre 2007; Miller et al. 2010). Spatial Similarity was computed within each of the functional ROIs using Remember–View. This analysis complemented and extended the Proportion Overlap analysis because it examined whether the pattern of BOLD activity across the cue and delay periods of the task was similar without limiting the search to significantly active voxels. First, the uncorrected t-values at each voxel within each ROI were vectorized for both the cue and delay periods. The resulting vector of t-values within each ROI was then correlated across the cue and delay periods using a nonparametric test (Kendall rank-order correlation) so as not to make any assumptions about the underlying distribution. The output was the magnitude of Spatial Similarity between cue and delay period activity for each ROI.
Connectivity Similarity Analysis To calculate the Connectivity Similarity between all combinations of the functional ROIs (IFG–EC, MFG–EC, IFG–MFG, IFG–PoCG, MFG– PoCG, and EC–PoCG), we implemented a beta-series correlation analysis (Rissman et al. 2004). This technique allowed us to quantify inter-regional neural interactions between each pair of regions separately for different task stages (i.e., cue vs. delay). First, the above GLM was adapted such that the regressors of interest that estimated the BOLD response were separately calculated for each trial (as opposed to for each trial type). This resulted in a parameter estimate (beta value) for each stage within each trial. The average beta values within each ROI from each task stage were then temporally sorted across all events of that stage. A correlation between the sorted beta values for each pair of ROIs was calculated for all cue period events and all delay period events to quantify the degree of functional connectivity between those 2 regions during each task stage. We contrasted the functional connectivity during the Remember condition with that during the View condition. The correlation coefficients were standardized into z-scores to allow for statistical conclusions to be made from the magnitudes of the correlations. Connectivity Similarity was calculated as the absolute value of the difference between functional connectivity during the cue period and functional connectivity during the delay period for each pair of regions. Given that we only included correct trials in our GLM, the number of betas that went into our average functional connectivity varied across participants (mean 26.4 for Remember and 29.7 for View, range 19–30). To assess whether the number of betas included in the analysis influenced our results, we also conducted the above analysis including 19 randomly chosen betas for each participant. Both methods produced similar results; thus, we only report the analysis including all betas for each participant.
Cerebral Cortex March 2014, V 24 N 3 595
Downloaded from http://cercor.oxfordjournals.org/ at Acquisitions Dept.,Serials/ Milton S. Eisenhower Library/The Johns Hopkins on May 6, 2014
requires a simple perceptual response at probe instead of remembering the cue items (Gazzaley, Cooney, McEvoy, et al. 2005; Gazzaley, Cooney, Rissman, et al. 2005). Therefore, in order to control for non-WM-related processes, such as attending to stimuli, anticipation of the probe stimulus, and motor preparation, for all metrics (see below) we subtracted activity during the View condition from activity during the Remember condition. Two participants were missing imaging data for 1 of the 3 Remember runs, and 3 participants were missing behavioral responses on a subset of the View runs. For the participants missing View behavioral data, the GLM was run using all the trials from the View runs.
Results Proportion Overlap First, we computed Proportion Overlap to measure the similarity between the extent of above-threshold activity during WM maintenance (when encoded stimuli were absent) and the extent of above-threshold neural activity during encoding (when stimuli were present). This analysis was conducted only in participants who had significant delay period voxels for a given ROI (correlation values for included participants, along with the number of participants in each correlation, are reported below). Across participants, greater Proportion Overlap was associated with higher accuracy in the left IFG (r = 0.29, P = 0.049, n = 47; Fig. 3a). We did not observe a significant relationship between Proportion Overlap and accuracy in the left MFG (r = 0.07, P = 0.65, n = 44; Fig. 3b) or the left EC (r = −0.03, P = 0.81, n = 34; Fig. 3c). There were no relationships between the right-lateralized PFC or EC ROIs and accuracy (P > 0.19 for all ROIs; n = 51 for IFG, 49 for MFG, and 37 for EC). Lastly, there was no relationship between overlap in the left or right PoCG and accuracy (r = −0.04, P = 0.78, n = 45 and r = −0.09, P = 0.52, n = 51, respectively). These findings remained consistent when raising the significance threshold from t > 1.5 to t > 2.0 (r = 0.32, P = 0.04 for left IFG and P > 0.14 for all other ROIs), as well as when including participants with no delay period activity in the analysis with Proportion Overlap set to 0 (r = 0.23, P = 0.06 for left IFG and P > 0.10 for all other ROIs). This finding suggests that the integrity of visual WM depends on neural similarity in the left IFG. Spatial Similarity Secondly, we calculated Spatial Similarity to assess the patterns of BOLD activity across all voxels regardless of the magnitude of the BOLD signal. Underlying spatial patterns of BOLD activity may convey essential information that cannot be extracted by examining only above-threshold activation. For instance, early visual regions do not exhibit abovethreshold delay period activity during the maintenance of visual stimuli, but neural patterns in these regions contain information about the stimulus being maintained (Harrison and Tong 2009; Serences et al. 2009). We found that while there was a positive relationship between Proportion Overlap and accuracy in the left IFG when limiting our analyses to significant above-threshold voxels, there was no relationship between Spatial Similarity and accuracy when including all 596 Working Memory Relies on Encoding-Maintenance Correspondence
•
Cohen et al.
voxels within the ROI in the analysis (r = 0.09, P = 0.47). Similar to the Proportion Overlap analysis, there was no relationship between accuracy and Spatial Similarity in the left or right MFG, EC, or the control ROI, PoCG (P > 0.13 for all ROIs). In order to rule out the possibility that the relationship between cue and delay epochs evolves throughout the delay, the Spatial Similarity analysis was repeated using preprocessed BOLD values from 3 representative timepoints during the delay epoch. BOLD signal values from each voxel in a given ROI were extracted for 3 encoding TRs (TRs 6, 7, and 8 of the trial, reflecting the approximate peak of the BOLD response to the cue stimuli) and 3 maintenance TRs (TRs 11, 13, and 15 of the trial, chosen as representative samples of the delay period). These values were averaged over trials separately for Remember and View conditions. We then averaged the values from TRs 6–8 to derive a single encoding vector for the ROI and determined the correlation between this vector and each of the 3 delay vectors. This yielded 3 correlation values per subject per condition. After subtracting View from Remember values, we examined each of the 3 correlation values for a relationship with overall accuracy. No significant relationships with task accuracy were observed in any of the ROIs (P > 0.11 for all ROIs). Although spatial patterns of subthreshold delay period voxels have been shown to contain WM stimulus information (Harrison and Tong 2009; Serences et al. 2009), our results suggest that correspondence between significantly active voxels, and not spatial patterns, across encoding and maintenance periods is critical for WM. In support of this notion, nonhuman primate studies have suggested that patterns of activity that contain WM stimulus information may not be stable across encoding and maintenance (Meyers et al. 2008; Woloszyn and Sheinberg 2009). Connectivity Similarity Thirdly, our metric of neural similarity was the degree to which functional connectivity between lateral PFC regions and EC during maintenance corresponded to their connectivity during stimulus encoding (Connectivity Similarity). Connectivity Similarity was defined as the magnitude of the difference between functional connectivity during encoding and maintenance. All analyses focused on left-lateralized ROIs given that the Proportion Overlap analysis indicated that the only region whose overlap was related to accuracy was the left IFG. For each of these analyses, participants with functional connectivity scores >3 standard deviations from the
Downloaded from http://cercor.oxfordjournals.org/ at Acquisitions Dept.,Serials/ Milton S. Eisenhower Library/The Johns Hopkins on May 6, 2014
Figure 3. Proportion Overlap relationships with behavior. Proportion Overlap was positively associated with accuracy in (a) the left IFG, but not in (b) the left MFG. (c) There was no relationship between accuracy and Proportion Overlap in the left EC.
mean were excluded, as noted below. As hypothesized, participants who were more accurate had increased Connectivity Similarity (a value of 0 indicating perfect Connectivity Similarity), both with left IFG–EC connectivity (r = −0.27, P = 0.03, n = 64; Fig. 4a) and with left MFG–EC connectivity (r = −0.33, P = 0.008, n = 63; Fig. 4b). No significant relationship was found between Connectivity Similarity and WM accuracy for left IFG–MFG (P = 0.94, n = 64) or for any of the regions’ Connectivity Similarity with PoCG (IFG–PoCG, MFG–PoCG, and EC–PoCG; P > 0.29 for all ROI pairs, n = 63).
Discussion These results provide novel evidence for the neural processes underlying successful WM, and advance previous research examining neural activity associated with WM encoding or maintenance alone. By directly comparing neural activity during WM encoding and maintenance, we showed that the correspondence of neural processes—both above-threshold activity and functional connectivity—during these 2 stages is related to the integrity of WM. As such, we provide empirical support for theoretical work suggesting that overlap between encoding and maintenance processes is a critical element of WM (Postle 2006; D’Esposito 2007). It is important to note that although encoding and maintenance are thought of as separate and unitary processes, each is multifaceted. Encoding involves processes that extract and store information in WM in addition to stimulus-evoked sensory processes (Chafee and Goldman-Rakic 1998; Bor et al. 2003; Ranganath et al. 2004; Brady et al. 2009; Gao et al. 2010), while maintenance comprises sustained rehearsal, storage, and interference resistance (Smith and Jonides 1998; Sakai et al. 2002). Our results therefore likely reflect the correspondence in neural activity related to several of these processes, instead of the correspondence purely between stimulus-evoked activity and storage-related activity. Nevertheless, our work provides the first direct evidence that shared features of temporally segregated neural activity in WM relates to WM performance. The view that emerges from this evidence is that of a unitary set of representations and operations that subserve the complex processes of encoding and maintaining information in WM. Although our hypothesis did not focus on the relative roles of lateral PFC regions and EC in WM, here we consider regional differences in our findings within the context of prevalent models of visual WM. These models propose that
Cerebral Cortex March 2014, V 24 N 3 597
Downloaded from http://cercor.oxfordjournals.org/ at Acquisitions Dept.,Serials/ Milton S. Eisenhower Library/The Johns Hopkins on May 6, 2014
Figure 4. Connectivity Similarity relationships with behavior. Connectivity Similarity was comparably associated with accuracy for the (a) left IFG–EC and (b) left MFG– EC pairs. Note that the Connectivity Similarity metric is a difference score, thus smaller values are indicative of greater similarity.
stimulus information is maintained via persistent top-down input from lateral PFC to EC (Petrides 2000; Awh and Jonides 2001; Postle 2006; D’Esposito 2007). In line with this view, our Connectivity Similarity results indicate that both dorsal and ventral PFC communicate with EC in the service of WM. We found that Connectivity Similarity between dorsal and ventral PFC was not correlated with accuracy (r = −0.01), which is consistent with the notion that doral and ventral regions of PFC may play different roles in WM and provide differential input to downstream regions (Petrides 2000; Badre and Wagner 2007; Blumenfeld et al. 2011). Left ventrolateral PFC is implicated in the selection of relevant information in the context of memory (Jha et al. 2004; Feredoes et al. 2006; Badre and Wagner 2007) and stimulus representations (Rushworth et al. 1997; Thompson-Schill et al. 1997), which is consistent with a putative shared function across WM encoding and maintenance. Dorsolateral PFC, on the other hand, may serve to increase the capacity of downstream regions to store WM information (Edin et al. 2009). However, given that the relationships between IFG–EC and MFG–EC Connectivity Similarity and WM accuracy were not significantly different from one another (P = 0.64), we cannot rule out the possibility that these 2 regions play complementary or even overlapping roles in our task. The left lateralization of our results in the PFC is not surprising, given previous reports of left PFC activation in this particular WM task (see Gazzaley, Cooney, Rissman, et al. 2005, Gazzaley et al. 2007). However, other studies with similar WM delay tasks have found right lateral PFC involvement (e.g., Yoon et al. 2007); we therefore refrain from making strong claims regarding the hemispheric specificity of PFC involvement in WM. The above models also suggest that stimulus information is stored in EC neurons that initially represent visual input. While we did not find evidence for conserved neural activity within EC across encoding and maintenance, it is possible that EC retains stimulus information throughout WM via other mechanisms. Recent work has demonstrated that neurons that initially contain the most WM stimulus information may not contain the same degree of information during the latter stages of maintenance (Meyers et al. 2008). An alternate possibility is that visual neurons may retain information via rapid shifts in synaptic weights (Sugase-Miyamoto et al. 2008). Under such a scenario, representations could be passively stored over brief intervals, with periodic input required to keep the representations active over several seconds (Mongillo et al. 2008; Sugase-Miyamoto et al. 2008). Thus, instead of requiring sustained neural activation, the conservation of stimulus information across encoding and maintenance may be accomplished via periodic, punctate (and possibly subthreshold) reactivation of cue-evoked activity that may require much more sensitive techniques to properly document. Intriguingly, this scenario is consistent with our observation that MFG– and IFG–EC Connectivity Similarity were significantly related to accuracy, whereas Proportion Overlap in EC did not show a relationship with accuracy. Our work raises 2 important questions for future research. First, what factors contribute to individual differences in the degree of neural similarity and WM accuracy? One possibility is that strategic differences in task performance differentially engaged WM operations (Braver et al. 2008), resulting in varying degrees of neural similarity. Another nonexclusive possibility is that trait variables, such as WM capacity or
Funding This work was supported by the National Institutes of Health (R01 MH63901 and P01 NS40813 to M.D.).
Notes Conflict of Interest: None declared.
References Aguirre GK. 2007. Continuous carry-over designs for fMRI. Neuroimage. 35:1480–1494. Awh E, Jonides J. 2001. Overlapping mechanisms of attention and spatial working memory. Trends Cogn Sci. 5:119–126. Badre D, Wagner AD. 2007. Left ventrolateral prefrontal cortex and the cognitive control of memory. Neuropsychologia. 45: 2883–2901. Blumenfeld RS, Parks CM, Yonelinas AP, Ranganath C. 2011. Putting the pieces together: the role of dorsolateral prefrontal cortex in relational memory encoding. J Cogn Neurosci. 23:257–265. Bor D, Duncan J, Wiseman RJ, Owen AM. 2003. Encoding strategies dissociate prefrontal activity from working memory demand. Neuron. 37:361–367. Brady TF, Konkle T, Alvarez GA. 2009. Compression in visual working memory: using statistical regularities to form more efficient memory representations. J Exp Psychol Gen. 138:487–502. Braver TS, Gray JR, Burgess GC. 2008. Explaining the many varieties of working memory variation: dual mechanisms of cognitive control. In: Conway ARA, Jarrold C, Kane MJ, Miyake A, Towse JN, editors. Variation in working memory. New York (NY): Oxford University Press. p. 76–106. Chafee MV, Goldman-Rakic PS. 1998. Matching patterns of activity in primate prefrontal area 8a and parietal area 7ip neurons during a spatial working memory task. J Neurophys. 79:2919–2940. Chang C, Crottaz-Herbette S, Menon V. 2007. Temporal dynamics of basal ganglia response and connectivity during verbal working memory. Neuroimage. 34:1253–1269. Cox RW. 1996. AFNI: software for analysis and visualization of functional magnetic resonance neuroimages. Comput Biomed Res. 29:162–173. D’Esposito M. 2007. From cognitive to neural models of working memory. Philos Trans R Soc Lond B Biol Sci. 362:761–772. Edin F, Klingberg T, Johansson P, McNab F, Tegnér J, Compte A. 2009. Mechanism for top-down control of working memory capacity. Proc Natl Acad Sci USA. 106:6802–6807. 598 Working Memory Relies on Encoding-Maintenance Correspondence
•
Cohen et al.
Feredoes E, Tononi G, Postle BR. 2006. Direct evidence for a prefrontal contribution to the control of proactive interference in verbal working memory. Proc Natl Acad Sci USA. 103:19530–19534. Funahashi S, Bruce CJ, Goldman-Rakic PS. 1990. Visuospatial coding in primate prefrontal neurons revealed by oculomotor paradigms. J Neurophys. 63:814–831. Fuster JM. 1973. Unit activity in prefrontal cortex during delayedresponse performance: neuronal correlates of transient memory. J Neurophys. 36:61–78. Fuster JM, Alexander GE. 1971. Neuron activity related to short-term memory. Science. 173:652–4. Fuster JM, Bauer R, Jervey JP. 1985. Functional interactions between inferotemporal and prefrontal cortex in a cognitive task. Brain Res. 330:299–307. Gao Z, Li J, Yin J, Shen M. 2010. Dissociated mechanisms of extracting perceptual information into visual working memory. PLoS One. 5: e14273. Gazzaley A, Cooney JW, McEvoy K, Knight RT, D’Esposito M. 2005. Top-down enhancement and suppression of the magnitude and speed of neural activity. J Cogn Neurosci. 17:507–517. Gazzaley A, Cooney JW, Rissman J, D’Esposito M. 2005. Top-down suppression deficit underlies working memory impairment in normal aging. Nat Neurosci. 8:1298–1300. Gazzaley A, Rissman J, Cooney JW, Rutman AM, Seibert T, Clapp W, D’Esposito M. 2007. Functional interactions between prefrontal and visual association cortex contribute to top-down modulation of visual processing. Cereb Cortex. 17:i125–i135. Gazzaley A, Rissman J, D’Esposito M. 2004. Functional connectivity during working memory maintenance. Cogn Affect Behav Neurosci. 4:580–599. Grill-Spector K, Malach R. 2001. fMR-adaptation: a tool for studying the functional properties of human cortical neurons. Acta Psychol (Amst). 107:293–321. Harrison SA, Tong F. 2009. Decoding reveals the contents of visual working memory in early visual areas. Nature. 458:632–635. Henson RNA, Rugg MD. 2003. Neural response suppression, haemodynamic repetition effects, and behavioural priming. Neuropsychologia. 41:263–270. Honey GD, Fu CHY, Kim J, Brammer MJ, Croudace TJ, Suckling J, Pich EM, Williams SCR, Bullmore ET. 2002. Effects of verbal working memory load on corticocortical connectivity modeled by path analysis of functional magnetic resonance imaging data. Neuroimage. 17:573–582. Jha AP, Fabian SA, Aguirre GK. 2004. The role of prefrontal cortex in resolving distractor interference. Cogn Affect Behav Neurosci. 4:517–527. Kriegeskorte N, Goebel R, Bandettini P. 2006. Information-based functional brain mapping. Proc Natl Acad Sci USA. 103: 3863–3868. Lepsien J, Nobre AC. 2007. Attentional modulation of object representations in working memory. Cereb Cortex. 17:2072–2083. Lewis-Peacock JA, Drysdale AT, Oberauer K, Postle BR. 2012. Neural evidence for a distinction between short-term memory and the focus of attention. J Cogn Neurosci. 24:61–79. Malecki U, Stallforth S, Heipertz D, Lavie N, Duzel E. 2009. Neural generators of sustained activity differ for stimulus-encoding and delay maintenance. Eur J Neurosci. 30:924–933. McIntosh AR, Grady CL, Haxby JV, Ungerleider LG, Horwitz B. 1996. Changes in limbic and prefrontal functional interactions in a working memory task for faces. Cereb Cortex. 6:571–584. Meyers EM, Freedman DJ, Kreiman G, Miller EK, Poggio T. 2008. Dynamic population coding of category information in inferior temporal and prefrontal cortex. J Neurophys. 100:1407–1419. Miller BT, Vytlacil J, Fegen D, Pradhan S, D’Esposito M. 2010. The prefrontal cortex modulates category selectivity in human extrastriate cortex. J Cogn Neurosci. 23:1–10. Mongillo G, Barak O, Tsodyks M. 2008. Synaptic theory of working memory. Science. 319:1543–1546. Munk MHJ, Linden DEJ, Muckli L, Lanfermann H, Zanella FE, Singer W, Goebel R. 2002. Distributed cortical systems in visual shortterm memory revealed by event-related functional magnetic resonance imaging. Cereb Cortex. 12:866–876.
Downloaded from http://cercor.oxfordjournals.org/ at Acquisitions Dept.,Serials/ Milton S. Eisenhower Library/The Johns Hopkins on May 6, 2014
intelligence, may determine the degree of neural similarity during WM maintenance. Studies incorporating explicit manipulations of strategy or the examination of WM capacity, in conjunction with our neural similarity metrics, can address these possibilities. Secondly, what is the mechanism that results in neural similarity across task stages? In this study, the temporal resolution of fMRI precludes us from distinguishing between encoding-evoked activity that is sustained throughout maintenance and phasic encoding activity that is reconstituted during maintenance. Evidence exists for both possibilities: work utilizing single unit recording has identified cells that fire persistently throughout the delay (Fuster and Alexander 1971), whereas recent multivariate analyses have revealed that information conveyed by EC neurons may degrade early in the delay and be reconstituted toward the end of the delay (Woloszyn and Sheinberg 2009), possibly via input from PFC (Ranganath and D’Esposito 2005). Electrophysiological measures of neural reinstatement may be necessary to distinguish between these alternatives.
Sugase-Miyamoto Y, Liu Z, Wiener MC, Optican LM, Richmond BJ. 2008. Short-term memory trace in rapidly adapting synapses of inferior temporal cortex. PLoS Comput Biol. 4:e1000073. Takeda K, Funahashi S. 2007. Relationship between prefrontal task-related activity and information flow during spatial working memory performance. Cortex. 43:38–52. Thompson-Schill SL, D’Esposito M, Aguirre GK, Farah MJ. 1997. Role of left inferior prefrontal cortex in retrieval of semantic knowledge: a reevaluation. Proc Natl Acad Sci USA. 94: 14792–14797. Tsujimoto S, Sawaguchi T. 2004. Properties of delay-period neuronal activity in the primate prefrontal cortex during memory- and sensory-guided saccade tasks. Eur J Neurosci. 19:447–457. Woloszyn L, Sheinberg DL. 2009. Neural dynamics in inferior temporal cortex during a visual working memory task. J Neurosci. 29:5494–5507. Woodward TS, Cairo TA, Ruff CC, Takane Y, Hunter MA, Ngan ETC. 2006. Functional connectivity reveals load dependent neural systems underlying encoding and maintenance in verbal working memory. Neuroscience. 139:317–325. Yarkoni T. 2009. Big correlations in little studies: inflated fMRI correlations reflect low statistical power—commentary on Vul et al. (2009). Perspect Psychol Sci. 4:294–298. Yarkoni T, Braver TS. 2010. Cognitive neuroscience approaches to individual differences in working memory and executive control: conceptual and methodological issues. In: Saklofske DH, Zeidner M, Schwean VL, Gruszka A, Matthews G, Szymura B, editors. Handbook of individual differences in cognition. New York (NY): Springer New York. p. 87–107. Yoon J, Curtis CE, D’Esposito M. 2006. Differential effects of distraction during working memory on delay-period activity in the prefrontal cortex and the visual association cortex. Neuroimage. 29:1117–1126. Yoon JH, Hoffman JN, D’Esposito M. 2007. Segregation of function in the lateral prefrontal cortex during visual object working memory. Brain Res. 1184:217–225. Zarahn E, Aguirre GK, D’Esposito M. 1999. Temporal isolation of the neural correlates of spatial mnemonic processing with fMRI. Brain Res Cogn Brain Res. 7:255–268. Zarahn E, Aguirre G, D’Esposito M. 1997. A trial-based experimental design for fMRI. Neuroimage. 6:122–138.
Cerebral Cortex March 2014, V 24 N 3 599
Downloaded from http://cercor.oxfordjournals.org/ at Acquisitions Dept.,Serials/ Milton S. Eisenhower Library/The Johns Hopkins on May 6, 2014
Nakamura K, Kubota K. 1995. Mnemonic firing of neurons in the monkey temporal pole during a visual recognition memory task. J Neurophys. 74:162–178. Norman KA, Polyn SM, Detre GJ, Haxby JV. 2006. Beyond mindreading: multi-voxel pattern analysis of fMRI data. Trends Cogn Sci. 10:424–430. Pessoa L, Gutierrez E, Bandettini PA, Ungerleider LG. 2002. Neural correlates of visual working memory: fMRI amplitude predicts task performance. Neuron. 35:975–987. Petrides M. 2000. Dissociable roles of mid-dorsolateral prefrontal and anterior inferotemporal cortex in visual working memory. J Neurosci. 20:7496–7503. Postle BR. 2006. Working memory as an emergent property of the mind and brain. Neuroscience. 139:23–38. Postle BR, Druzgal TJ, D’Esposito M. 2003. Seeking the neural substrates of visual working memory storage. Cortex. 39:927–946. Ranganath C, DeGutis J, D’Esposito M. 2004. Category-specific modulation of inferior temporal activity during working memory encoding and maintenance. Brain Res Cogn Brain Res. 20:37–45. Ranganath C, D’Esposito M. 2005. Directing the mind’s eye: prefrontal, inferior and medial temporal mechanisms for visual working memory. Curr Opin Neurobiol. 15:175–182. Rissman J, Gazzaley A, D’Esposito M. 2008. Dynamic adjustments in prefrontal, hippocampal, and inferior temporal interactions with increasing visual working memory load. Cereb Cortex. 18:1618–1629. Rissman J, Gazzaley A, D’Esposito M. 2004. Measuring functional connectivity during distinct stages of a cognitive task. Neuroimage. 23:752–763. Rushworth MFS, Nixon PD, Eacott MJ, Passingham RE. 1997. Ventral prefrontal cortex is not essential for working memory. J Neurosci. 17:4829–4838. Rypma B, D’Esposito M. 1999. The roles of prefrontal brain regions in components of working memory: effects of memory load and individual differences. Proc Natl Acad Sci USA. 96:6558–6563. Sakai K, Rowe JB, Passingham RE. 2002. Active maintenance in prefrontal area 46 creates distractor-resistant memory. Nat Neurosci. 5:479–484. Serences JT, Ester EF, Vogel EK, Awh E. 2009. Stimulus-specific delay activity in human primary visual cortex. Psychol Sci. 20:207–214. Smith EE, Jonides J. 1998. Neuroimaging analyses of human working memory. Proc Natl Acad Sci USA. 95:12061–12068.