of hyperactive/impulsive symptoms in typically developing chil- dren. Data in this study ..... application to the hippocampus in older adults. Med Image. Comput ...
Article
Cortical Development in Typically Developing Children With Symptoms of Hyperactivity and Impulsivity: Support for a Dimensional View of Attention Deficit Hyperactivity Disorder Philip Shaw, M.D., Ph.D. Mary Gilliam, B.S. Maria Liverpool, B.S. Catherine Weddle, B.S. Meaghan Malek, B.S. Wendy Sharp, M.S.W. Deanna Greenstein, Ph.D. Alan Evans, Ph.D. Judith Rapoport, M.D. Jay Giedd, M.D.
Objective: There is considerable epidemiological and neuropsychological evidence that attention deficit hyperactivity disorder (ADHD) is best considered dimensionally, lying at the extreme end of a continuous distribution of symptoms and underlying cognitive impairments. The authors investigated whether cortical brain development in typically developing children with symptoms of hyperactivity and impulsivity resembles that found in the syndrome of ADHD. Specifically, they examined whether a slower rate of cortical thinning during late childhood and adolescence, which they previously found in ADHD, is also linked to the severity of symptoms of hyperactivity and impulsivity in typically developing children. Method: In a longitudinal analysis, a total of 193 typically developing children with 389 neuroanatomic magnetic resonance images and varying levels of symptoms of hyperactivity and impulsivity (measured with the Conners’ Parent Rating Scale) were contrasted with 197
children with ADHD with 337 imaging scans. The relationship between the rates of regional cortical thinning and severity of symptoms of hyperactivity/impulsivity was determined. Results: Youth with higher levels of hyperactivity/impulsivity had a slower rate of cortical thinning, predominantly in prefrontal cortical regions, bilaterally in the middle frontal/premotor gyri, extending down the medial prefrontal wall to the anterior cingulate; the orbitofrontal cortex; and the right inferior frontal gyrus. For each increase of one point in the hyperactivity/impulsivity score, there was a decrease in the rate of regional cortical thinning of 0.0054 mm/year (SE=0.0019 mm/year). Children with ADHD had the slowest rate of cortical thinning. Conclusions: Slower cortical thinning during adolescence characterizes the presence of both the symptoms and syndrome of ADHD, providing neurobiological evidence for dimensionality of the disorder. (Am J Psychiatry 2011; 168:143–151)
T
here is considerable debate over whether attention deficit hyperactivity disorder (ADHD) represents a diagnostic category with distinct boundaries between the disorder and health or is better understood dimensionally, with those who have the disorder lying at the extreme end of a continuum of symptoms (1–3). Much evidence supports a dimensional view, including several taxonometric studies suggesting that symptoms of ADHD and associated neuropsychological deficits lie on a continuum (4, 5). Further support for a dimensional view would be gained from linking symptom dimensions to biological constructs such as brain development. In the present study, we used neuroanatomic imaging data acquired from typically developing children with no psychiatric diagnoses to explore whether high levels of hyperactive/impulsive symptoms are underpinned by neurodevelopmental patterns that resemble those seen in children with the syndrome of ADHD.
In this study, a dynamic measure of cortical change was used, since previous studies suggest that there are ADHD diagnostic differences in trajectories of cortical development (6–9). Using a measure of cortical thickness, we previously reported that in both typically developing children and youth with ADHD, an early childhood phase of cortical increase eventually reached a peak— attained later in those with ADHD in the fronto-temporal cortex—before giving way to a phase of cortical thinning (7). There were diagnostic differences in the phase of cortical thinning, with the velocity of thinning being consistently slower in youth with ADHD (see Results section). Given that cortical thinning dominates most of late childhood and early adolescence and most of our neuroimaging data lie within the same age range, cortical thinning emerges as a potential neuroanatomic marker for ADHD.
This article is featured in this month’s AJP Audio, is the subject of a CME course (p. 227), and is discussed in an editorial by Dr. Klein (p. 111) Am J Psychiatry 168:2, February 2011
ajp.psychiatryonline.org
143
DIMENSIONAL VIEW OF ADHD
For the present study, we inquired whether similar differences in the rate of cortical thinning would occur in a typically developing group of children who have varying levels of hyperactive and impulsive symptoms. We used a version of the Conners’ Rating Scales (10), which includes a factor reflecting hyperactive and impulsive symptoms. This version does not include a factor reflecting purely inattentive symptoms, but rather a factor of learning difficulties, which while consisting of several items that reflect inattention and distractibility, includes more general learning difficulties. We did not include this learning problems factor and focused instead on the factor reflecting hyperactive and impulsive symptoms. We hypothesized that typically developing children with higher levels of hyperactive and impulsive symptoms would show cortical trajectories resembling those found in ADHD, specifically a slower rate of cortical thinning during late childhood and adolescence. To assess symptom specificity, the cortical changes associated with a measure of conduct problems in the same participants were determined, with the prediction of distinct cortical correlates for the different symptom domains.
Method Participants A total of 193 typically developing youth with no personal history of psychiatric or neurological disorders had a total of 389 neuroanatomic magnetic resonance images. Recruitment was conducted through local advertisements aimed at local parenting groups, schools, and community groups. Each participant underwent a structured diagnostic interview by a child psychiatrist to rule out any psychiatric or neurological diagnoses (11). Data from any participant who developed a mental illness during the course of the study were excluded, and all participants were free of psychotropic medications. After complete description of the study, written informed consent and assent were obtained from parents and children. Comparison was made with a group of 197 youths with DSMIV-defined ADHD. Diagnosis was based on the Diagnostic Interview for Children and Adolescents, Parent version (12), previously described elsewhere (6). This group of youths is a subset of our larger ADHD cohort (7), selected because their neuroanatomic data (total of 337 scans) were for the same age range as the data from participants in the present study and they had available Conners’ Rating Scales data. All participants completed a version of the Conners’ Parent Rating Scale (10), which assesses symptoms of hyperactivity/impulsivity and conduct problems. This questionnaire is composed of 48 items, from which parents are asked to select from four possible responses based on the child’s behavior. Responses of “not at all,” “just a little,” “pretty much,” and “very much” return scores of 0 to 3, respectively. A factor analytic study (10) showed that four items load onto a factor reflecting hyperactive/impulsive symptoms, and thus the maximum score for hyperactive/impulsive symptoms is 12. Conduct problems were also measured using the same scale, with a maximum score of 24, reflecting the eight items that load onto this factor.
Neuroimaging T1-weighted images with contiguous 1.5-mm axial slices were obtained using three-dimensional spoiled gradient recalled
144
ajp.psychiatryonline.org
echo in the steady state on a 1.5-Tesla GE Signa scanner (General Electric Co., Milwaukee). Imaging parameters were as follows: echo time=5 msec, repetition time=24 msec, flip angle=45°, acquisition matrix=256×192, number of excitations=1, field of view=24 cm. The same scanner was utilized throughout the study. Native magnetic resonance imaging (MRI) scans were masked using the Brain Extraction Tool (13), registered into standardized stereotaxic space (14) using a nine-parameter linear transformation (15), corrected for nonuniformity artifacts (16) and segmented (17). The Constrained Laplacian Anatomic Segmentation using Proximity surface extraction procedure generated surface meshes representing white and gray matter interfaces (18). The root mean square thickness between corresponding nodes on the surface meshes was calculated in native space (19). Thickness measurements were aligned using surface registration to maximize thickness value correspondence between participants in terms of gyral patterning (20). A 30-mm surface blurring algorithm, which preserves cortical topologic features, was used to reduce noise in thickness measurements (21).
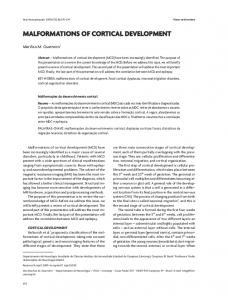
Phenotype In a previous study of our entire cohort (223 youths with ADHD and age-, sex-, and IQ-matched typically developing subjects, with a total of 824 neuroanatomic scans), we demonstrated distinct trajectories of cortical growth, particularly in the prefrontal and lateral temporal cortices (7). As shown in Figure 1, which is derived from these earlier data, the ADHD group attained its peak cortical thickness later than the typically developing group throughout most of the prefrontal and lateral temporal cortices (with the exception of the superior portions of the motor strip). Additionally, by examining the rate of cortical change, the ADHD group was found to have a slower rate of cortical thinning in the regions with a delayed peak thickness, throughout all of late childhood and adolescence. Between the ages of 8 and 18 years, the estimated rate of thinning for the typically developing group was –0.027 mm/year, compared with –0.011 mm/year for the ADHD group. Thus, a slower rate of prefrontal cortical thinning during late childhood and adolescence characterizes most of the lateral prefrontal and temporal cortices in ADHD. In the present study, we examined whether a similar slowing of cortical thinning would be associated with the presence of hyperactive/impulsive symptoms in typically developing children. Data in this study were restricted to neuroanatomic scans that lay within the period of cortical thinning (≥8 years of age).
Longitudinal Analyses We examined whether the rate of cortical thinning varies as a function of the number of hyperactive/impulsive symptoms by regressing cortical thickness against the hyperactive/impulsive symptom score, age, and interaction between the hyperactive/ impulsive symptom score and age using mixed-model regression (22). This approach was used because our data contain both multiple observations per participant, measured at different and irregular time periods, and single observations per participant. Such unbalanced longitudinal data can be explored statistically by applying mixed-effect models (23). A random effect for each individual was included to account for within-person dependence. Thus, for cortical points, the jth cortical thickness of the ith individual was modeled using the following equation, in which di is a random effects modeling within-person dependence; the intercept and β terms are fixed effects, and eij represents the residual error: Thicknessij=intercept+di+β1(age)+β2(hyperactive/impulsive symptoms)+β3 (hyperactive/impulsive symptoms*age)+eij The interaction between age and hyperactive/impulsive symptoms is given by the β3 fixed effect. This parameter provides an Am J Psychiatry 168:2, February 2011
SHAW, GILLIAM, LIVERPOOL, ET AL.
FIGURE 1. Cortical Thickness in Typically Developing Youths With Symptoms of Hyperactivity/Impulsivity Relative to Those With ADHDa Cortical Thickness (mm)
4.40 4.35 4.30 4.25 4.20 4.15 4.10 4.05
Typically Developing
4.00
ADHD
3.95 8
Am J Psychiatry 168:2, February 2011
12
13
14
15
16
17
0 –0.01 –0.02 –0.03 –0.04
Typically Developing
–0.05
ADHD
–0.06
a
The rate of cortical thinning, predominantly in prefrontal cortical regions, varied significantly with the hyperactive/impulsive symptom score, with adjustment
11
0.01
8
Neuroanatomic Findings
10
0.02
Results Among typically developing youth, hyperactive/impulsive symptom scores did not differ significantly by sex (boys: mean=1.43 [SD=1.59]; girls: mean=1.35 [SD=1.36]) and did not correlate with IQ (r=0.008, p=0.91). The ADHD group had greatly elevated hyperactive/impulsive symptom scores (mean=9.2 [SD=1.7]), and there was no overlap between the range of scores for the typically developing and ADHD groups (difference between groups: t=48.6, df=388, p2.04, df=194, p–2.14, df=194, p