and cost-efficient solutions for WSN deployment in indoor environments. 1. ... how well each point in the sensing field (service area) is monitored by the WSN.
Cost-Efficient Deployment for Full-Coverage and Connectivity in Indoor 3D WSNs Marc T. Kouakou,†1 Shinya Yamamoto,†2 Keiichi Yasumoto†1 and Minoru Ito†1 In WSNs, coverage of the target field and wireless connectivity among sensor nodes are important criteria in terms of the performance required for WSN. In indoor environments, the target field is in general 3D space, thus WSNs deployed for such environments are called 3D WSNs. The sensor node deployment problem for 3D coverage and connectivity is NP-hard even without obstacles in the target field. Furthermore, no study has systematically examined the optimal 3D WSN deployment considering both obstacles and deployment cost. In this paper, we propose a new heuristic algorithm for computing a near optimal sensor node deployment that minimizes the cost for achieving the full coverage and node connectivity of a 3D target space with obstacles. First, we represent the monitoring area as well as the sensor node deployable area in the target 3D space, by a set of grid points. Our algorithm puts sensor nodes one by one on a grid point of the deployable area in the descendant order of the cost-performance value (i.e., how many monitoring space points are covered by the deployable area point per unit deployment cost) of the deployable area points. Then, the algorithm adds extra nodes to cover the shadow area of each node’s sensing region cut off by the obstacles. Moreover, to ensure the connectivity among all WSN nodes, the algorithm adds extra nodes and/or moves each unconnected sensor node one by one towards the closest connected sensor node in order to reduce the number of extra nodes. We implemented our proposed method in the UbiREAL simulator and evaluated the performance through simulations. As a result, we have confirmed that our proposed method can provide reliable and cost-efficient solutions for WSN deployment in indoor environments.
1. Introduction The recent growth of context-aware applications in indoor environments has brought new research approaches in diverse fields including 3D WSNs, which †1 Nara Institute of Science and Technology †2 Tokyo University of Science Yamaguchi
have gained increasing interests due to their various uses in home automation and smart environment monitoring (location information collection, target’s position tracking, etc). One of the key challenges for 3D WSNs is how to achieve full coverage of the target monitoring space and sufficient network connectivity between sensor nodes while maintaining a low deployment cost. Crucially, we need to optimize the sensing performance of indoor 3D WSNs that characterizes how well each point in the sensing field (service area) is monitored by the WSN both for economic and technical reasons. Given a sensor network, the connectivity problem is to determine how well the sensor nodes communicate with each other. Due to the actual market cost of 3D sensor nodes and the requirements of their applications in real-world, the accuracy of the deployment has become a strict requirement. The 3D WSN coverage problem is NP-hard since it includes the minimum set covering problem known to be NP-hard. Numerous researches have addressed this problem and some heuristic methods have been studied either by reducing the 3D geometry to the 2D [1–5] or by neglecting the obstacles existing in the target space [6–8]. Due to abstraction of the target space, these methods may lead to some deployment errors caused by the inaccuracy of the obtained results. We need to develop an optimal deployment method for 3D WSNs taking into account sensor node deployment cost different among installation locations and obstacles (walls, ceiling, appliances, furniture, etc) that may obstruct sensing region and wireless connectivity in the target area. Existing studies do not consider the above issues. In this paper, we propose a heuristic method for determining the near optimal sensor nodes deployment while minimizing the cost for achieving the full coverage and the connectivity in a three dimensional indoor environment with obstacles. We first discretize the problem by reducing the 3D monitoring space to a set of grid points (monitoring points) and the deployable space to a set of grid points (deployable points). Given the cost of each deployable point, our algorithm computes the number of covered monitoring points per unit deployment cost and put sensor nodes one by one, until achieving the full-coverage, on deployable points with more monitoring points covered by those points than others. A
monitoring point is considered to be covered if this point is located within a node’s sensing range, and there is no obstacle that obstructs the monitoring point. To reach the desired connectivity of the network, the algorithm computes the connectivity of each deployed sensor node and changes the location of each unconnected sensor node by moving it towards the closest connected sensor node. Then, if unconnected nodes still exist, it will add extra sensor nodes to ensure the connectivity of all WSN nodes. We implemented our proposed algorithm in a smart-space simulator UbiREAL [9], designed for developing and testing ubiquitous applications. The function implemented in UbiREAL allows us to visualize the sensor nodes deployment computed by our method on a given indoor environment which includes home appliances and furniture. The remainder of this paper is structured as follows. Section 2 outlines related work in WSN coverage and connectivity. After formulating the problem in Section 3, we describe our newly proposed method in Section 4. We discuss the implementation and evaluation of the proposed method in Section 5 and conclude the paper in Section 6. 2. Related Work The coverage indicates how well information is tracked and collected by a WSN [6], while the connectivity reflects the quality of communication between the sensor nodes. Recently, many researches have addressed the deployment problem in WSN and various solutions have been proposed regarding the coverage and the connectivity. We classify the set of related existing studies in two categories. 2.1 Deployment problem in 2D There have been several studies on the deployment problem in 2D space. Huang et al., in [1], proposed a polynomial time algorithm to efficiently solve the 2dimensional coverage problem in terms of the number of deployed sensors. One closely related problem in the literature is the Art Gallery Problem in which we are to determine the minimum number of observers necessary to cover the whole
gallery. Bai et al., in [4, 5], proposed an optimal deployment pattern to achieve both full coverage and 2-connectivity, and proved its optimality for arbitrary ratio of rc /rs where rs and rc mean the radius of each sensor node’s sensing range and communication range, respectively. In [10], a new set of optimal deployment patterns is proposed to address the mutation phenomenon occurring for certain ratios of rc /rs . Though the sensor node deployment problem in the 3D space is NP-Hard, it can still be solved optimally in the 2D plane. The proposed solution determines whether a WSN provides full coverage of the monitoring area by investigating whether every point in the monitoring area is covered by at least k sensors (k-coverage). An approach based on the Delaunay Triangulation has been used in [2] to solve the problem of coverage holes and plan the position of the sensors in an environment with obstacles. Although it is possible to solve the deployment problem in 2D space, it may result in some inaccuracies that will lead to some deployment errors if we apply these 2D deployment methods to 3D coverage problem as is. 2.2 Deployment problem in 3D obstacle-free space Alam and Haas studied the problem of coverage and connectivity for 3D spaces in [11]. Based on the Kepler’s conjecture, they suggested a deployment pattern that generates the Voronoi tessellation of truncated octahedron in 3D space. Moreover, in [8] and [7], Bai et al. designed several sets of lattice patterns to achieve full-coverage and k-connectivity in three dimensional space and proved their optimality under constraints of regularity. The above studies suppose that the sensor nodes can be placed at any point of the 3D space and do not consider the deployment cost at each point in the target space. Moreover, the suggested deployment patterns do not take into account the obstacles that may exist in the target space. 3. Problem Statement In this section, we give assumptions in our proposed method and formulate the problem of sensor nodes deployment in a 3D indoor environment. We summarize
the symbols that are used in this section in Table 1. Table 1: Symbols Notation
Meaning
A
target area
Ad
sensor node deployable area (Ad ⊆ A)
Am
monitoring area (Am ⊆ A)
cost(p)
cost for deploying a sensor node at location p
O
set of obstacles
S
set of sensor nodes to achieve full coverage and connectivity
s.pos
location where sensor node s is deployed(s ∈ S)
rs
sensor node’s sensing radius
rc
sensor node’s communication radius
sink
sink node that collects data from all deployed sensor nodes
3.1 Assumptions We denote the target 3D space by A. In A, there are some objects called obstacles that may obstruct communication and/or sensing by sensor nodes. We denote the set of obstacles by O. We call the subarea to be monitored in A, monitoring area and denote it by Am . The subarea(s) of A where sensor nodes can be installed is called deployable area and we denote it by Ad . The cost for installing a sensor node changes depending on the location in Ad ⋆1 . Let cost(p) denote the cost for installing a sensor node at location p ∈ Ad . Sensor Nodes: We consider only static nodes to be deployed in the 3D WSNs: they cannot move from their location after being deployed. Each sensor node has wireless communication capability. Its sensing and communication ranges are represented by spheres of some radius with the node at its center, respectively. We assume that all the sensor nodes have identical sensing radius rs and communication radius rc . Sensor nodes within distance rc can communicate with ⋆1 In general, installing on ceiling/wall will be cheaper than in the air.
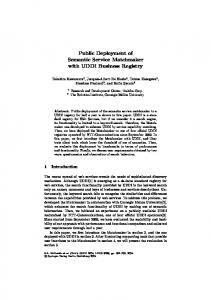
each other (no obstacles case). We denote the sensing range of sensor node s by s.range. Sensing range and communication range of each sensor node can be obstructed by obstacles. As shown in Fig. 1, we assume that the sensor node cannot sense the information from the shadow area in the sensing region generated by obstacles. Moreover, we assume that two sensor nodes within distance rc can communicate with each other only if the line of sight (LoS) exists between them, that is, no obstacle obstructs the straight line between the nodes. 3.2 Problem Formulation Given a three dimensional indoor area A, a set O of obstacles in A, sensor node deployable area (Ad ⊆ A) with cost function cost(p), the monitoring area (Am ⊆ A), a sink node sink and its position sink.pos, our target problem is to determine the number of sensor nodes and their installing positions that guarantee the fullcoverage of Am and the connectivity of all sensor nodes to sink while minimizing the total sum of deployment cost. Let S denote the set of sensor nodes for deployment. Each sensor node s ∈ S must be deployed in Ad . When we denote the deployed position of sensor node s by s.pos, the following equation holds. ∀s ∈ S, s.pos ∈ Ad
(1)
Coverage of Am : We say that each monitoring point m (m ∈ Am ) is covered by the sensor node s only if it is located within the sensing range s.range and not in the shadow area. We say that m is k-covered when it is covered by at least k sensor nodes. For k-coverage of the monitoring area Am , the following equation must hold. ∀m ∈ Am , | {s | s ∈ S ∧ m ∈ s.range\Shadow(s, O)} |≥ k
(2)
Here, Shadow(s, O) represents the shadow area in s.range by obstacles O (as shown in Fig. 1). Connectivity: We say that a sensor node s is connected when it has a connected path to the sink node sink. To ensure the connectivity of the whole WSN, the following equation must hold.
4. The Proposed Solution 4.1 Preliminaries In order to simplify the computation in the proposed algorithm, first, we discretize the monitoring area and the deployable area by a set of grid points, respectively. The set of monitoring points M is the set of points to be covered by the wireless sensor network. As shown in Fig. 2, the monitoring points are represented by a set of grid points in the monitoring area Am . The set of deployable points D is the set of points on which sensor nodes can be eventually put. As shown in Fig. 2, the deployable points are represented by a set of grid points in the deployable area Ad . We assume that the target 3D space is sufficiently covered if all the monitoring points M are sufficiently covered.
Fig. 1: Shadow area generated by obstacle in sensing range
∀s ∈ S, connected(s, sink) = true
(3)
where
Our algorithm consists of two phases: initial deployment and node selection. Also, we assume that the sensor node’s sensing radius is no more than half of its communication radius: rs ≤ 12 rc . We show the pseudo code of the algorithm in Algorithm 1.
def
connected(s, s′ ) = | (s, s′ ) |≤ rc ∧ LoS(s, s′ , O) = true ∨ ∃s1 , . . . , si ∈ S(1 ≤ i), | (s, s1 ) |≤ rc ∧ LoS(s, s1 , O) = true ∧ | (s1 , s2 ) |≤ rc ∧ LoS(s1 , s2 , O) = true ∧ . . . ∧ | (si , s′ ) |≤ rc ∧ LoS(si , s′ , O) = true
(4)
Here, LoS(s, s′ , O) is the boolean function that becomes true only if no obstacles of O obstruct the straight line between s and s′ . Using the above constraints, the objective function of our target problem is given by the following equation: minimize
∑
cost(s.pos)
s∈S
subject to constraints (2) − (4)
(5)
4.2 Initial Deployment As shown in lines 1-2 of Algorithm 1, the algorithm first computes the 3D Euclidean positions of the monitoring points M and the deployable points D, given Am , Ad , and the grid interval ∆. Here, the grid interval ∆ is no more than the node’s communication range rc (∆ ≤ rc ) and the smaller ∆ will produce the more accurate deployment although the computation cost will also increase. 4.3 Node Selection In the next step, the algorithm selects the deployable point with the highest dc ratio. The function to calculate the dc ratio is defined by: dc ratio(d) =
| {m | m ∈ M ∧ m ∈ sphere(d, rs )\Shadow(d, rs , O)} | cost(d)
(6)
where sphere(d, rs ) means the sphere with radius rs centered at a deployable
point d and Shadow(d, rs , O) means the shadow area generated by obstacles O in sphere(d, rs ).
Fig. 2: Monitoring points and deployable points
At first, the dc ratio is computed for each deployable point d ∈ D and the algorithm selects d∗ with the highest dc ratio as shown in lines 5-11 of Algorithm 1. A sensor node s is then placed on d∗ (line 12). The coverage level of the monitoring points newly covered by s is updated, and those with a sufficient coverage level are removed from the set of monitoring points (lines 14-15). We then once again compute the dc ratio at each empty deployable point and repeat the above steps until all the monitoring points are sufficiently covered. After reaching the required level of coverage of the 3D environment, the algorithm focuses on the connectivity problem. Let su be the sensor node element of unconnected sensor nodes U under consideration. The algorithm selects a node sc in the connected sensor nodes C that is the closest to su and computes the new “virtual” position p′ of su by moving it toward sc as long as the set of monitoring points initially covered by su remains unchanged. If the sensor node su is still unconnected after changing its position, extra nodes are put on the line segment with endpoints su and sc so that su and sc are connected, as shown in Fig. 3.
Algorithm 1 Node Selection for 3D Coverage and Connectivity 1: D = computeDeployableP oints(Ad , ∆) 2: M = computeM onitoringP oints(Am , ∆) 3: S = ∅, maxdc = 0 4: while M is not k-covered do 5: for each d ∈ D do 6: dc = coverM onitoringP oints(d)/deploymentCost(d) 7: if maxdc < dc then 8: maxdc = dc 9: d∗ = d 10: end if 11: end for 12: s.pos = d∗ 13: S = S ∪ {s} 14: D = D \ {d∗ } 15: updateCoverageLevel(M, S) 16: end while 17: C = connectedSensors(S) 18: U = S \ C 19: for each su ∈ U do 20: sc = closestSensor(C, su ) 21: su .pos = moveT owards(sc ) 22: if not connected(su , sc ) then 23: addM oreSensors(S, su , sc ) 24: end if 25: U = U \ {su } 26: C = C ∪ {su } 27: end for
4.4 Example In the following example, we illustrate the proposed algorithm step by step.
(a) Computation of dc-value
(b) Node Selection for coverage
(c) Node Refinement for Connectivity
(d) Final Result
Fig. 3: Each unconnected is moved towards the closest connected sensor node
We are given an indoor environment in which we have to deploy sensor nodes to ensure the full-coverage and the connectivity of the WSN. A sink node is placed in the 3D space at an arbitrary position. The deployment cost is different among the positions in the sensor node deployable area. After the initial deployment (generation of the monitoring points and the deployable grid points), the dc ratio is computed at each deployable grid point as shown in Fig. 4(a). Then, the algorithm puts a sensor node on the grid point having the highest dc ratio (0.85). The two previous steps are iteratively executed until all the monitoring points are sufficiently covered as shown in Fig. 4(b). The connectivity of each deployed sensor node is then computed and all the unconnected sensor nodes are moved towards the nearest connected nodes, respectively, as shown in Fig.4(c). In this case, unconnected sensor nodes still remain, new nodes are added to ensure the wireless connectivity in Fig. 4(c). The final result of our deployment method is shown in Fig. 4(d). 5. Implementation - Performance Evaluation We implemented our proposed solution in the UbiREAL simulator that al-
Fig. 4: Illustration of the different steps of the algorithm
lows us to easily visualize and simulate the behavior of home appliances. We then conducted simulation-based experiments, to show the performance of our algorithm. 5.1 Simulation Configuration For the simulation, we are given an indoor environment in which we are to deploy wireless sensor nodes for full-coverage and 1-connectivity. The simulation
configuration parameters are shown in Table 3.
with our proposed method..
Table 2: Simulation Parameters Target space
10m x 10m x 3m
Node’s sensing range rs
1.5m
Node’s connectivity range rc
5m
Table 3: Deployment Cost
Regions Horizontal Regions
Vertical Regions
Fig. 5: Initial Configuration (Front View)
The monitoring area Am is a plane located at mid height of the target space (h = 1.5m) as shown in Fig. 5. Moreover, we divided the deployable area in horizontal (ceiling deployment) and vertical (wall deployment) regions with a variable deployment cost. We set the deployment cost for each region as shown in Table 3. We then set the grid spacing ∆ to 0.5m in the deployable and the monitoring grids. The program outputs both the position and the cost of all the sensor nodes required to fully cover the defined monitoring area while ensuring the nodes’ connectivity. We applied the same conditions to the triangular lattice pattern proposed in [4] and compared the obtained deployment cost of the method in [4]
h=3.0m h=2.5m h=2.0m h=1.5m all
cost 5 10 15 20 5
5.2 Result of the comparison The experimental results are shown in Table 4. By using the triangular lattice pattern method, that has been proved to be an optimal deployment method, we achieve the full-coverage and 1-connectivity of the target area with 22 sensor nodes scattered in a regular pattern. However, since all the deployed positions of sensor nodes are in the same horizontal plane (h=1.5m), the same deployment cost is applied to all of them, i.e. 20 as shown in Table 3. The total deployment cost is then 440. On the other hand, our proposed method achieved the deployment for the same monitoring area with a total deployment cost of 270. Although, the number of deployed sensor nodes is much larger than the number obtained with the triangular pattern, the total deployment cost is about 40% smaller. We confirmed that our proposed method provides better cost-efficient deployment results than existing methods. Table 4: Comparative results of the two methods Number of sensors
Total cost
Cost-efficient deployment
Method
39
270
Triangular Lattice
22
440
6. Conclusion In this paper, we studied the problem of sensor nodes deployment in threedimensional WSNs and proposed a heuristic algorithm that provides a near optimal deployment that ensures full-coverage and connectivity at minimal cost. Our method considers the obstacles residing in the 3D target space and computes the semi-optimal sensor node deployment taking into account their influence on the coverage and the connectivity among sensor nodes. Based on this method, we implemented a WSN simulator using the UbiREAL simulator and evaluated the performance of the algorithm through visualization. As part of the future work, we will evaluate the proposed method under more practical conditions. This will allow us to improve the deployment algorithm to maintain better performances while minimizing the cost. We will complete our studies by investigating the case where rs > 21 rc . In parallel, we will conduct experiments on a WSN testbed and extend the WSN simulator to simulate realistic sensing/communication ranges depending on types of sensors/wireless communication standards and actual influence by obstacles. References 1) C. F. Huang and Y. C. Tseng: “The coverage problem in a wireless sensor network,” Proc. of WSNA, pp. 115-121, 2003. 2) C. H. Wu, K. C. Lee, and Y. C. Chung: “A Delaunay Triangulation based method for wireless sensor network deployment,” Computer Communications, Vol. 30, No. 14-15, pp.2744-2752, 2007. 3) Y. C. Wang, C. C. Hu, and Y. C. Tseng: “Efficient deployment algorithms for ensuring coverage and connectivity of wireless sensor networks,” Proc. of the Wireless Internet Conference (WICON), pp. 114-121, 2005. 4) X. Bai, D. Xuan, Z. Yun, and T. H. Lai: “Complete optimal deployment patterns for full-coverage and k-connectivity (k ≤ 6) wireless sensor networks,” Proc. of the 9th ACM Mobihoc, pp. 401-410, 2008. 5) X. Bai, S. Kumar, D. Xuan, Z. Yun, and T. H. Lai: “Deploying wireless sensors to achieve both coverage and connectivity,” Proc. of the 7th ACM Mobihoc, pp. 131-142, 2006. 6) C. F. Huang, Y. C. Tseng, and L. C. Lo: “The Coverage Problem in ThreeDimensional Wireless Sensor Networks,” Proc. of GlobeCom 2004, pp. 3182-3186,
2004. 7) X. Bai, C. Zhang, D. Xuan, and W. Jia: “Full-Coverage and k-Connectivity (k = 14, 6) Three Dimensional Networks,” Proc. of INFOCOM 2009, pp. 388-396, 2009. 8) X. Bai, C. Zhang, D. Xuan, J. Teng, and W. Jia: “Low-Connectivity and FullCoverage Three Dimensional Wireless Sensor Networks,” Proc. of MobiHoc 2009, pp. 145-154, 2009. 9) H. Nishikawa, S. Yamamoto, M. Tamai, K. Nishigaki, T. Kitani, N. Shibata, K. Yasumoto, and M. Ito: “UbiREAL: Realistic Smartspace Simulator for Systematic Testing,” Proc. of UbiComp 2006, pp. 459-476, 2006. 10) X. Bai, Z. Yun, D. Xuan, W. Jia, and W. Zhao,: “Pattern Mutation in Wireless Sensor Deployment” Proc. of INFOCOM, 2010. 11) S. M. N. Alam and Z. J. Haas: “Coverage and connectivity in three-dimensional networks,” Proc. of MobiCom 2006, pp.346-357, 2006.