usern s1 s2 sm. Similarity. Measure useri = { FCSP1,. FCSP2, ⦠, FCSPk }. Clustering. Algorithm output similarity matrix. Clusters of web users. Fig. 3. Overview ...
COWES: Clustering Web Users Based on Historical Web Sessions Ling Chen1,2 , Sourav S. Bhowmick1 , Jinyan Li2 1
School of Computer Engineering, Nanyang Technological University, Singapore, 639798 2 Institute for Infocomm Research, Singapore, 119613
Abstract. Clustering web users is one of the most important research topics in web usage mining. Existing approaches cluster web users based on the snapshots of web user sessions. They do not take into account the dynamic nature of web usage data. In this paper, we focus on discovering novel knowledge by clustering web users based on the evolutions of their historical web sessions. We present an algorithm called COWES to cluster web users in three steps. First, given a set of web users, we mine the history of their web sessions to extract interesting patterns that capture the characteristics of their usage data evolution. Then, the similarity between web users is computed based on their common interesting patterns. Then, the desired clusters are generated by a partitioning clustering technique. Web user clusters generated based on their historical web sessions are useful in intelligent web advertisement and web caching.
1
Introduction
Web Usage Mining (WUM)—the application of data mining techniques to discover usage patterns from web data—has been an active area of research and commercialization [9]. Existing web usage data mining techniques include statistical analysis [9], association rules [8], sequential patterns [13], classification [7]etc. An important topic in web usage mining is clustering web users—discovering clusters of users that exhibit similar information needs, e.g., users that access similar pages. By analyzing the characteristics of the clusters, web designers may understand the users better and thus can provide more suitable, customized services to the users [12]. There are quite a few methods for clustering web users proposed in the literature [5] [12] [11]. Generally, existing web user clustering consists of three phases: data preparation, cluster discovery, and cluster analysis. Since the last phase is applicationdependent, let us briefly describe the first two phases. In the first phase, web sessions of users are extracted from the web server log by using some user identification and session identification techniques [4]. A web session, which is an episode of interaction between a web user and the web server, consists of pages visited by a user in the episode [5]. For example, Figure 1 (a) shows four requests from one session. The first line means that the user at foo.ntu.edu accessed the page www.uow.edu/sce/Jeffrey/pub.html at 10:30:05 on January 01, 2005. In the
www.uow.edu
foo.cs.ntu.edu — [01/Jan/2005:10:30:05 -0800] “GET / www.uow.edu/sce/Jeffrey/pub.html HTTP/1.0” 200 3027 foo.cs.ntu.edu — [01/Jan/2005:10:30:08 -0800] “GET / www.uow.edu/sce/Jeffrey/ HTTP/1.0” 200 1205 foo.cs.ntu.edu — [01/Jan/2005:10:30:18 -0800] “GET / www.uow.edu/sce/ HTTP/1.0” 200 1967 foo.cs.ntu.edu — [01/Jan/2005:10:30:23 -0800] “GET / www.uow.edu/sce/Henry HTTP/1.0” 200 994
www.uow.edu/sce www.uow.edu/ sce/Henry
www.uow.edu/ sce/Jeffrey www.uow.edu/ sce/Jeffrey/ pub.html
(b)
(a)
Fig. 1. Web session and page hierarchy.
second phase, clustering techniques are applied to generate clusters of users. For example, given the web sessions of three users, u1 , u2 and u3 as in Figure 2 (c) (left part), where only the accessed pages are presented, existing web user clustering methods [5] will group them together as their sessions share common web pages. 1.1 Motivating Example Existing web user clustering methods cluster users based on the snapshots of their web sessions. However, the web usage data is dynamic in nature. For example, Figures 2 (a), (b) and (c) (left parts) show the historical web sessions of users u1 , u2 and u3 at time T1 , T2 and T3 respectively with a specific time granularity (e.g. day, week, month etc). It can be observed that pages visited by web users at different time points are different. This can be attributed to various factors, such as users’ variation of their information needs and changes to the content of the web site etc. Such dynamic nature of web usage data poses both challenges and opportunities to web user clustering. In particular, the dynamic nature of web usage data leads to the following two challenging problems: – Maintenance of web user clustering results: Take the web sessions in Figure 2 as an example. Web user clusters generated by existing techniques at time T1 does not include the usage data at time T2 and beyond. Hence, the clustering results have to be updated constantly along with the change of web usage data. This requires development of efficient incremental web user clustering techniques. – Discovery of novel web user clusters: Web user clusters generated by existing techniques at time T3 does not include the usage data at time T2 and before. While knowledge extracted from the snapshots of web sessions is important and useful, interesting and novel knowledge can be discovered from the historical web sessions. For example, we can discover clusters of users that exhibit similar characteristics in the evolution of their usage data, e.g. users share common change patterns in their historical web sessions. In this paper, we focus on discovering novel knowledge by clustering web users based on the change patterns in their historical web sessions. Various types of change patterns can be mined from historical web usage data. In this paper,
UID
T1
u1 u2 u3
a
a
sessions < a/b/f, a/b/g, a/c/i, a/d/m > < a/b/e, a/c/h, a/c/i, a/d/m, a/d/k > < a/b/e, a/c/h, a/c/j, a/d/l >
b f
g
c
d
b
i
m
e
a
c
d
h
m
i
b k
c j
h
e
u2
u1
d l
u3
(a) UID
T2
u1 u2 u3
a
a
sessions < a/b/e, a/b/f, a/c/i, a/d/m > < a/b/e, a/c/h, a/c/j, a/d/l, a/d/m > < a/b/e, a/c/i, a/c/j, a/d/l, a/d/k >
b e
f
c
d
b
i
m
e
a
c h
d l
j
b m
e
c
d
i
l
j
k
u3
u2
u1
(b)
UID
T3
u1 u2 u3
a
sessions < a/b/e, a/c/i, a/d/m > < a/b/e, a/c/i, a/d/m > < a/b/e, a/c/i, a/d/m >
b e u1
a
a c
d
b
c
i
m
e
i
(c)
u2
d
b
m
e
c
d
i
m
u3
Fig. 2. Historical web sessions.
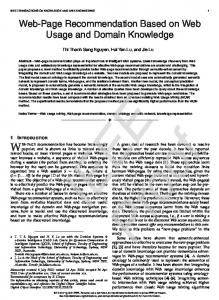
we mine a particular change pattern called Frequently Changed Subtree Patterns (FCSP ), which was proposed by us in the context of XML documents in [3] before. We briefly introduce the idea of FCSP as follows. Pages accessed in a web session can be organized into a hierarchical structure, called a page hierarchy, based on the URLs of the pages [5]. For example, the page hierarchy constructed for the pages in the web session in Figure 1 (a) is shown in Figure 1 (b). Obviously, a page hierarchy represents the information needs of a user. Similarly, the sequences of historical web sessions of web users u1 , u2 and u3 are represented as sequences of page hierarchies in Figure 2 (right part), where a gray node represents a page that will disappear in the next web session, and a dark node is a page that newly occurs in current session. The changes to the structure of a page hierarchy, e.g. the insertions and deletions of nodes, reflect the variation of user’s information needs. A FCSP is a set of subtrees, in a page hierarchy, whose structures frequently change together in a sequence of historical web sessions. For example, since the structures of the subtrees rooted at nodes c and d (depicted by dotted line) frequently changed together in the historical sessions of user u2 , the two subtrees will be discovered as a 2-FCSP of u2 , according to some metrics we define later in Section 2 (A k-FCSP is a FCSP consisting of k subtrees). Similarly, the two subtrees will be discovered as a 2-FCSP for user u3 as well. For user u1 , the subtree rooted at node b will be discovered as a 1-FCSP. We use the set of FCSPs, mined from the historical web sessions of a user, as the change patterns to capture the characteristics of the evolution of his usage data. Hence, users having similar FCSPs will be clustered. For example, the users u2 and u3 in Figure 2 will be grouped together as they share the common FCSP while u1 will be a singular cluster.
...
sm
s1
s2
user1
...
sm s1
s2
input
user2
FCSP Extraction
useri = { FCSP1, FCSP2, … , FCSPk }
Similarity Measure
similarity matrix
Clustering Algorithm
output
Clusters of web users
... ...
sm s1
usern
s2
Fig. 3. Overview of COWES.
We present an algorithm for Clustering Of Web users based on their historical wEb Sessions, called COWES. The overview of COWES is presented in Figure 3. Given a collection of web users {u1 , · · · , un }, where each user is associated with a sequence of historical web sessions, we extract FCSPs from their historical web sessions first. Then, each web user is represented as a set of FCSPs. We define a similarity metric to measure the proximity between each pair of users based on their FCSP s. The output of the this step is a similarity matrix of web users. Finally, we perform a partitioning clustering algorithm on the similarity matrix to generate the clusters. 1.2 Applications Web user clusters generated by COWES are useful at least in the following two applications: – Intelligent Web Advertisement: 99% of all web sites offer standard banner advertisements [1]. This shows the importance of this form of online advertising. One of the ways to maximize revenues for the party who owns the advertising space is to design intelligent techniques for the selection of an appropriate set of advertisements to display in appropriate web pages. Web user clusters generated by COWES can be beneficial for designing intelligent advertisement placement strategies. For example, after clustering users in Figure 2 based on historical web sessions, we knew that the variation of information needs of u1 is different from that of users u2 as well as u3 . Although all users accessed the page a/b/e at time T3 , u1 frequently changes his information needs under a/b. Thus, it makes sense to put relevant advertisement banners in page a/b instead of page a/b/e for u1 in order to maximize revenues. – Proxy Cache Management: Web caching is an interesting problem in web research area [2] [13] as web caches can reduce not only network traffic but also downloading latency. Because of the limited size of cache region, it is important to design effective replacement strategies to maximize hit rates. One of the frequently used replacement strategies is LRU, which assigns priorities to the most recently accessed pages. Web user clusters generated by COWES can be used with LRU to manage the caching region more optimally. For example, after time T3 , LRU will cache the pages under a/c
and a/d for user u2 (u3 ). When u2 accesses pages at next time point such as T4 , once it is detected that u2 changed his information needs under a/c, we can degrade the priority of pages under a/d and hasten the eviction of these pages. This is based on the knowledge obtained from the results of COWES, which indicates that u2 frequently changes his information needs under a/c and a/d together. 1.3 Contributions The main contributions of this paper are summarized as follows. – We propose an approach that, to the best of our knowledge, is the first one to discover novel knowledge by clustering web users based on their historical web sessions. – We capture the characteristic of the evolution of web usage data with an interesting change pattern and show that user clusters generated based on this pattern are useful in real life applications. – We define two similarity metrics which measure the likeness of the change patterns and web users in terms of their change patterns respectively. – We present the results of extensive experiments that were conducted to demonstrate the performance of our algorithm and the novelty of generated clusters. The rest of the paper is organized as follows. In Section 2, we explain the notion of FCSP that is used as the clustering feature in our algorithm. We define the similarity metrics in Section 3. In Section 4, we present the framework of COWES. We evaluate the performance of COWES in Section 5 and review related works in Section 6. Section 7 concludes this paper.
2
Frequently Changed Subtree Pattern (FCSP)
As mentioned above, in order to cluster web users based on their historical web sessions, we extract the set of FCSPs first to capture the characteristics in the evolution of their usage data. We briefly introduce the notion of FCSP in this section. Readers can refer to our previous work [3] for details. As in [5], pages in a web session can be organized into a page hierarchy based on their URLs. Hereafter, we refer to a page hierarchy of a web session as a web session tree. Formally, a web session tree is an unordered tree T =< N, E >, where N is the set of nodes where a leaf node represents a web page corresponding to a file in the web server and a non-leaf node represents a web page corresponding to a directory in the server, E is the set of edges where each edge from a parent node to a child node represents the consisting-of relationship between the corresponding pages. Particularly, a node r, r ∈ N , is the root of the tree which represents the home page of a web site. An example web session tree is shown in Figure 1. Accordingly, a tree ti =< Ni , Ei > is a web session subtree, denoted as ti ≺ T , iff Ni ⊆ N and for all (x, y) ∈ Ei , x is a parent of y in T. Given a sequence of historical web session trees of a web user, we are interested in how the structures of the trees change, which reflects the variation of the user’s information needs. Hence, we first define two basic operations that change the structure of a tree as follows.
T1
a b c
d e
b f
c
a
d g
e
a
b f
h
T4
T3
T2
a
c
d g
e
b h
c
g
d i
j
h
Fig. 4. Four historical sessions of a web user.
– Insert(x, y): This operation creates a new node x as a child node of node y in a web session tree. – Delete(x): This operation is the inverse of the insertion one. It removes node x from a web session tree. A web session tree (subtree) is considered as changed once a change operation, i.e. insertion or deletion, occurs to it. Figure 4 shows four historical web session trees of a web user in sequence, where the black nodes depict the newly inserted nodes in the current session and the grey nodes depict the nodes that will be deleted in the next session. Compared with the session tree T 1 , a new node g is inserted in the subtree a/b (Hereafter, we use the path from the root to node x to denote a web session subtree rooted at x). Thus, the subtree a/b is considered as changed in session T 2 . Similarly, the subtree changed in session T 4 again. Each changed web session subtree is associated with a value which reflects its change degree. Intuitively, the more number of nodes inserted to/removed from a subtree, the more significantly the subtree changed. Then, a metric called Degree of Change (DoC ) is defined as follows. Definition 1 (DoC ). Let ti =< N i , E i >, ti+1 =< N i+1 , E i+1 > be two versions of a web session subtree t. The Degree of Change for subtree t is: |{x|x ∈ {N i ∪ N i+1 } && x ∈ / {N i ∩ N i+1 }}| u t i i+1 |{x|x ∈ {N ∪ N }}| That is, the DoC of a subtree in two versions is computed as the ratio of the number of inserted/deleted nodes to the total number of unique nodes of the subtree in the two versions. For example, in Figure 4, the DoC of the subtree a/b in the first two sessions is 1/3. Basically, a FCSP is a set of web session subtrees satisfying the following two conditions: i) the set of subtrees frequently change together; ii) the set of subtrees frequently undergo significant changes together. Correspondingly, we define two metrics, Frequency of Change (FoC ) and Significance of Change (SoC ), to measure the change frequency and change significance of a set of subtrees. DoC(t, i, i+1) =
Definition 2 (FoC ). Let < T 1 , T 2 , . . . , T n > be a sequence of n historical web session trees of a web user. Let P be a set of subtrees, P = {t1 , t2 , . . . , tm }, where tji ≺ T j (1 ≤ j ≤ n). Let DoC(ti , j, j + 1) be the Degree of Change for subtree ti from jth version to (j + 1)th version. The Frequency of Change for the set of P Pn−1 is: j=1 Vj FoC(P) = n−1
where Vj =
m Y
½ Vji and Vji =
i=1
1, if DoC(ti , j, j + 1) 6= 0 0, if DoC(ti , j, j + 1) = 0
u t
Obviously, FoC of a set of subtrees P is the fraction of sessions where all subtrees in P changed. The more times the set of subtrees change together, the higher the FoC. For example, consider the sequence in Figure 4 again. Let P be two subtrees: a/b and a/d. Then, F oC(P ) = 2/3 as both subtrees changed together in sessions T 2 and T 4 . Definition 3 (SoC ). Let < T 1 , T 2 , . . . , T n > be a sequence of n historical web session trees of a web user. Let P be a set of subtrees, P = {t1 , t2 , . . . , tm }. The Significance of Change of the set of subtrees is defined as follows: Pn−1 j=1 Dj SoC(P ) = (n − 1) ∗ F oC(P ) ½ m Y 1, if DoC(ti , j, j + 1) ≥ α u t where Dj = Dji and Dji = 0, otherwise i=1
That is, the SoC of a set of subtrees P is computed as the ratio of the number of sessions all subtrees in P change significantly (compared with the threshold of DoC ) to the number of sessions all subtrees in P changed together. For example, let P be the two subtrees of a/b and a/d in Figure 4. Suppose the threshold of DoC is 0.3. Then, SoC(P ) = 1/2 as the two subtrees changed together in two sessions and both of them changed significantly only in the session T 4 . Based on the above metrics, the Frequently Changed Subtree Pattern can be defined as follows. Definition 4 (FCSP). Let < T 1 , T 2 , . . . , T n > be a sequence of n historical web session trees of a web user. Let P be a set of subtrees, P = {t1 , t2 , . . . , tm }. Given the user-defined minimum DoC α, minimum FoC β and minimum SoC γ, P is a Frequently Changed Subtree Pattern F CSP if it satisfies the following two conditions: i) F oC(P ) ≥ β;ii) SoC(P ) ≥ γ. u t That is, a FCSP is a set of web sessions subtrees that frequently change together and frequently undergo significant changes together.
3
Similarity Measure
As we use the set of FCSPs, mined from the historical web sessions of each user, as our clustering feature, we need to define the similarity between web users based on their FCSPs. In this section, we first define two types of FCSPs that can be shared by web users. Then, we define the Similarity of FCSPs and the Similarity of Users sequentially. 3.1
Types of Shared FCSPs
Recall that each FCSP is a set of web session subtrees. We define two types of FCSP s that can be shared by two web users, Identical FCSP s and Approximate FCSP s, based on their subtrees.
C - Company, P - Products, T - Training, S - Service, p 1- product1, p2 - product2, c1- course1, c2 - course2
u1 = { P11 = { C/P, C/T }, P12 = { C/P, C/S } }
C
u2 = { P21 = { C/P, C/T } } P u3 = {
P31 =
{ C/P, C/S },
P32 =
u4 = { P41 = { C/P, C/T/c1 } }
S
T
{ C/P/p1, C/T/c1 } } p1
(a)
p2
c1
c1
(b)
Fig. 5. FCSP s of web users.
Before giving the definitions of the two types of FCSPs, we explain them with an example. Figure 5 (a) shows four web users {u1 , u2 , u3 , u4 }, where each user is associated a set of FCSPs, e.g. u1 = {P11 , P12 } (we use the subscript to denote the identity of the user and the superscript to denote the identity of the FCSP of the user). Each FCSP is a set of web session subtrees, e.g. P11 = {Company/P roducts, Company/T raining}. Figure 5 (b) shows the ancestor relationship between the web session subtrees. Consider the two FCSP s P11 and P12 . Both indicate the two subtrees, Company/Products and Company/Training, frequently changed together in a sequence of historical web sessions. Hence, P11 and P12 contribute in the similarity of the evolution of usage data for users u1 and u2 . We call such a pair of FCSPs Identical FCSPs. Definition 5 (Identical FCSPs). Let P1 = {t1 , · · ·, tm }, P2 = {t1 , · · ·, tn } be two FCSPs. Let L(t) be the path from the root of the web session tree to the root of the web session subtree t. If m = n and ∀i(1 ≤ i ≤ m), ∃j(1 ≤ j ≤ n) s.t. L(ti ) = L(tj ) and vice versa, then the two FCSPs are Identical FCSPs, denoted as P1 = P2 . u t That is, two FCSP s are Identical FCSPs if there is a one-to-one mapping between the subtrees of the two FCSPs and the corresponding subtrees are rooted at the same node. For example, the two users u1 and u3 in Figure 5 share the pair of Identical FCSPs P12 and P31 . Consider the example in Figure 5 again. Although P11 and P32 are not Identical FCSP s, they are similar to some extend in their semantics because their corresponding web session subtrees have the ancestor relationships. Hence, this pair of FCSPs contribute to the similarity of the evolution of usage data for u1 and u3 as well. We call such a pair of FCSP s Approximate FCSPs, which is defined as follows. Definition 6. [Approximate FCSPs] Let P1 = {t1 , . . . , tm } and P2 = {t1 , . . . , tn } be two FCSPs. Let L(t) be the path from the root of the web session tree to the root of the web session subtree t. A subtree ti is an ancestor of another subtree tj , denoted as tj ¹ ti , if L(ti ) is a prefix of L(tj ). If m = n and
∀i(1 ≤ i ≤ m), ∃j(1 ≤ j ≤ n) s.t. ti ¹ tj or ti º tj and vice versa, then the two FCSPs are Approximate FCSPs, denoted as P1 ≈ P2 . u t For example, the two users u1 and u4 in Figure 5 share the pair of Approximate FCSPs P11 and P41 . Note that, the definition of Identical FCSPs is a special case of that of Approximate FCSPs. 3.2 Similarity of FCSPs According to above discussion, two web users share Identical FCSPs and/or Approximate FCSPs. For each pair of shared FCSPs, we need to measure how similar they are. Note that each FCSP has a set of elements (subtrees) and is associated with two values, FoC and SoC, which reflect its strength. We then define the Similarity of FCSPs based on their Element Similarity and Strength Similarity. The former measures the proximity of two FCSPs in terms of their subtrees and the later measures the proximity of two FCSPs in terms of their FoC and SoC. Element Similarity Since a pair of Approximate FCSPs are different in their contained subtrees, we define the Element Similarity to measure the distance between a pair of FCSPs in terms of their subtrees. Intuitively, the closer the corresponding subtrees of the FCSP s in their ancestor relationship, the more similar the pair of FCSPs. Hence, we first define the Ancestor Level to measure the distance of two subtrees in their ancestor relationship. Definition 7 (Ancestor Level ). Let ti and tj be two web session subtrees s.t. tj ¹ ti . The ancestor level between ti and tj , denoted as AL(ti , tj ), is the length of the path from the root of ti to the root of tj . u t Consider the example in Figure 5 again. Let ti be the subtree Company/Products and tj be the subtree Company/Products/product 1 . Then, AL(ti , tj ) is 1. 1 Definition 8 (Element Similarity ). Let P1 = {t11 , . . . , tm 1 } and P2 = {t2 , . . . , i i i i m t2 } be a pair of Identical/Approximate FCSPs s.t. t1 ¹ t2 or t1 º t2 (1 ≤ i ≤ m). The Element Similarity of the pair of FCSPs, denoted as ES(P1 , P2 ), is defined as, Pm i i u t ES(P1 , P2 ) = 2− i=1 AL(t1 ,t2 ) The Element Similarity of a pair of Identical/Approximate FCSPs has value in (0, 1]. When the pair of FCSPs is Identical FCSPs, the Element Similarity has the maximum value 1 since the Ancestor Level of each pair of corresponding subtrees is zero. The higher the value, the more similar the two FCSPs in terms of their subtrees. For example, consider the pair of Approximate FCSPs in Figure 5, {P11 = {C/P, C/T }, P32 = {C/P/p1 , C/T /c1 }}. ES(P11 , P32 )=2−2 =1/4.
Strength Similarity With regard to Strength Similarity, we consider the similarity between a pair of FCSPs in terms of the values of their FoC and SoC, which reflect the change frequency and the change significance of the pattern respectively. We adopt the Euclidean distance to measure the distance between the values of the two metrics for a pair of shared FCSPs and then convert the distance to a similarity measure by using a monotonic decreasing function.
u1
u2
u3
FCSP_ID
FCSP
FoC
SoC
FoC
SoC
1(P11, P21) 2(P12, P31)
{ C/P, C/T } { C/P, C/S }
0.6 0.4
0.75 0.7
0.55
0.8
3(P32) 4(P41)
{ C/P/p1, C/T/c1 } { C/P, C/T/c1 }
u4
FoC
SoC
0.6
0.9
0.5
0.8
FoC
SoC
0.65
0.85
Fig. 6. FoC and Weight of FCSP s.
Definition 9 (Strength Similarity ). Let P1 and P2 be a pair of Identical/ Approximate FCSPs. Suppose F oC(P1 ) = f1 , SoC(P1 ) = s1 , F oC(P2 ) = f2 and SoC(P2 ) = s2 . Then the Strength Similarity of the pair of FCSPs, denoted as SS(P1 , P2 ), is defined as, SS(P1 , P2 ) = e−d(P1 ,P2 ) , where d(P1 , P2 ) =
p
(f1 − f2 )2 + (s1 − s2 )2
u t
The Strength Similarity has value in (0, 1]. The closer the values of FoC and SoC of the two FCSP s, the higher the Strength Similarity. For example, suppose the FoC and SoC of the FCSP s in Figure 5 with respect to each user are√shown in Figure 6. For the pair of Identical FCSPs {P11 , P21 }, its SS is 2 2 e− (0.6−0.55) +(0.75−0.8) = 0.931. Similarity of FCSPs Now we define the Similarity of FCSPs by considering both Element Similarity and Strength Similarity. Definition 10 (Similarity of FCSPs). Let P1 and P2 be a pair of FCSPs. Let ES(P1 , P2 ) be their Element Similarity and SS(P1 , P2 ) be their Strength Similarity. Then, the similarity of the two FCSPs, denoted as SoF (P1 , P2 ), is defined as, ½ ES(P1 , P2 ) ∗ SS(P1 , P2 ), if P1 = P2 or P1 ≈ P2 SoF (P1 , P2 ) = u t 0, otherwise That is, if a pair of FCSPs is Identical/Approximate FCSPs, then the Similarity of FCSPs is the product of their Element Similarity and their Strength Similarity. If the two FCSPs are neither Identical nor Approximate, their similarity is zero. Hence, SoF has value in [0,1]. The higher the value, the more similar the two FCSPs. 3.3
Similarity of Web Users
For two web users that are represented as two sets of FCSPs, we should measure their proximity by taking into account not only the number of shared FCSP s but also the SoF of shared FCSP s. Thus, we define the Similarity of User as follows. Definition 11 (Similarity of Users). Let u1 = {P11 , P12 , . . . , P1m } and u2 = {P21 , P22 , . . . , P2n } be two web users that are represented as two sets of FCSPs.
Suppose there exists k (0 ≤ k ≤ m ≤ n) s.t. P11 = P21 or P11 ≈ P21 , · · ·, P1k = P2k or P1k ≈ P2k . The Similarity of Users, denoted as SoU (u1 , u2 ), is defined as, Pk SoU (u1 , u2 ) =
i=1
SoF (P1i , P2i ) m+n 2
u t
If two web users share all their FCSP s and each pair of shared FCSP s has the SoF of 1, then the Similarity of Users has the maximum value of 1. Otherwise, if the two web users share no FCSP, the Similarity of Users is 0.
4
Framework of COWES
Given a collection of web users, where each user is associated with a sequence of his historical web sessions, COWES generates the clusters of users in the follows phases: – Phase I. From the historical web sessions of each user, we extract a set of FCSP s, which will be treated as a vector of features for clustering. – Phase II. Compute the similarity between pairs of web users in terms of their FCSP s based on defined similarity metrics. – Phase III. Perform clustering on the generated similarity matrix of web users. In [3], we proposed an algorithm that discovers FCSPs from a sequence of historical tree structures. Thus, we omit the details of Phase I and interested readers can refer to [3] for the details. We discuss the Phases II and III in the following subsections. 4.1 Similarity Computation As the output of Phase I, each web user is represented as a set of FCSPs. We need to compute the similarity between each pair of users in the second phase. Given two sets of FCSPs of two users, we first compute an optimal alignment of their FCSPs so that the total Element Similarity between matching FCSP s can be maximized. For example, suppose u1 = {P11 } where P11 = {Company/Products, Company/Training}, and u2 = {P21 , P22 } where P21 ={ Company/Products, Company/Training /course 1 } and P22 ={Company/Products /product 1 , Company/Training/course 1 }. Although P11 is approximate with both P21 and P22 , we align P11 with P21 so that the total Element Similarity between the matching FCSP s is maximized. After getting the optimal alignment, the SOF of the matching FCSPs can be computed and the SoU of the two users can be obtained accordingly. 4.2 Cluster Generation After Phase II, we can get a similarity matrix of web users. Then, many appropriate algorithms can be used to generate the clusters. However, different algorithms will have different performance with respect to the characteristics of the data. Here, we employ the well-known K -medoid [6] clustering technique. Obviously, K -medoid is by no means the only available method for clustering based on the similarity matrix, but it is the more preferable one as shown by
Table 1. Parameter and Results. D S G F P T N
Number Average Number Average Number Average Number
of web users number of FCSP s per user of FCSP groups number of FCSP s of each group of FCSP s number of subtrees of each FCSP of nodes of general session tree (a) Parameter List
5000 5 40 4 150 3 500
D 2K 3K 4K 5K 6K 7K
Step 2 10.31 25.91 41.39 79.19 96.66 140.65
Step 3 5.92 17.00 23.20 38.98 95.12 199.13
(b) Time
our experimental results. We need to point out that the novelty here is not the clustering algorithm, but the extraction of appropriate information from historical web sessions as a base for clustering and the similarity metrics we defined to measure the proximity of web users in terms of their characteristics in usage data evolution.
5
Experimental Results
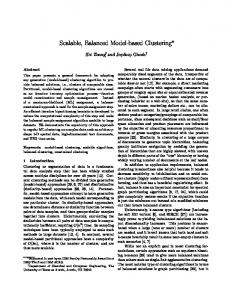
In this section, we evaluate the performance of COWES via experiments on both synthetic and real data sets. All experiments are carried out on a Pentium IV 2.8GHz PC with 512MB memory. The operating system is Windows 2000 professional. 5.1 Experiments on Synthetic Data We conduct two experiments on the synthetic data. The first experiment is carried out to illustrate our decision on employing a partitioning clustering algorithm. The second experiment is used to show the processing costs of different phases of our clustering approach. We implemented a synthetic FCSPs generator which is a process of the following steps. First, we generate a general web session tree with the given number of nodes. Then, we select subtrees from the tree structure to compose FCSP s. We organize the FCSPs into groups by controlling the overlap between each pair of groups. We select FCSP groups for each web user and assign FoC and SoC to each FCSP. Parameters of the synthetic FCSPs generating process is shown in Table 1 (a), where the third column shows the default values of the parameters. Result Analysis Firstly, we conduct experiments to show why we decide to employ a partitioning clustering algorithm. Particularly, we compare the following three well-known clustering algorithms: the agglomerative algorithm, the partitioning algorithm and the graph-based algorithm [14]. Figure 7 shows the gray scale images of the same similarity matrix ordered by the clusters generated by the three algorithms. The shade of each point in the images represents the value of the corresponding entry in similarity matrix. In extreme cases, white and black correspond to the similarity values of 1 and 0 respectively. Hence, for a good clustering, the rectangles on the diagonal should be as white as possible as they represent the web users in same clusters, while the remaining areas
(a) agglomerative
(b) partitioning
(c) graph-based
Fig. 7. Similarity matrix ordered by clustering results. Num of Clusters 5 6 7 8
Dataset I COWES STRUCTURE IS ES IS ES 0.36 0.013 0.09 0.007 0.22 0.014 0.08 0.006 0.38 0.017 0.21 0.006 0.39 0.019 0.18 0.008
Num of Clusters 3 4 5 6
Dataset II COWES STRUCTURE IS ES IS ES 0.67 0.24 0.35 0.24 0.72 0.39 0.37 0.24 0.73 0.34 0.38 0.23 0.72 0.32 0.40 0.22
Fig. 8. Comparison of clustering algorithms.
should be as black as possible. From Figure 7, we observe that the partitioning algorithm performs the best not only in achieving the best accuracy but also in controlling the balance of the cardinality of the clusters. We also conduct experiments on the set of synthetic data to evaluate the processing costs of the different phases of COWES. Since the performance of the first phase has been evaluated in our previous work [3], we do not report it again. Table 1 (b) shows the execution time of the second and third phases of COWES with respect to the variation of the number of users. It can be observed that both the costs of computing SoU and generating clusters increase quadratically with the number of users. 5.2
Experiments on Real Data
We conducted two experiments on real-life data. The first one is carried out to evaluate the accuracy of COWES and to demonstrate the novel clusters that can be discovered by COWES. The second one is conducted to compare the effectiveness of our similarity metric against an alternative one which ignores the Approximate FCSPs. DataSets The real-life datasets are collected from Internet Traffic Archive (http://ita.ee.lbl. gov), sponsored by ACM SIGCOMM. We use the trace that contains a day’s worth of all HTTP requests to the EPA WWW server located at Research Triangle Park, NC. In considering the evolution of web usage data, the requests of a host are grouped with a time interval of one hour. All the requests of all 2333 hosts in the trace form the Dataset I. In order to study the novel knowledge that can be discovered by COWES, we collect the requests of 57 hosts that browse the subtree of the two paths, “/docs/WhatsNew.html” and “/docs/WhatsHot.html” to form the Dataset II. Since hosts in the Dataset
Num of Clusters 5 6 7 8
Dataset I Approximate Identical IS ES IS ES 0.36 0.013 0.21 0.015 0.36 0.014 0.22 0.015 0.38 0.017 0.38 0.019 0.39 0.019 0.30 0.024
Num of Clusters 3 4 5 6
Dataset II Approximate Identical IS ES IS ES 0.67 0.24 0.59 0.21 0.72 0.39 0.67 0.34 0.73 0.34 0.65 0.31 0.72 0.32 0.65 0.29
Fig. 9. Comparison of similarity metrics.
II are similar in their requests, they may not be distinguished by existing cluster algorithms. We study to see whether COWES can generate clusters of high quality based on evolutionary features of the requests. Result Analysis We first conduct experiments to evaluate the accuracy of COWES. The results are shown in Figure 8. The quality of the clustering results is measured with two metrics, the overall mean inner cluster similarity and the overall mean inter cluster similarity, that are defined in [6] and referred to as IS and ES respectively in Figure 8. Basically, for a good clustering, the former should be large while the latter should be small. In order to evaluate the values of IS and ES of COWES, we employed an algorithm [10], which is referred to as STRUCTURE in Figure 8, that clusters the web users by the similarity in the structure of web session trees and ignores the evolutions of the sessions. We observed from Figure 8 that for Dataset I, COWES can achieve competitive accuracy. For Dataset II where users share similar structures in web sessions, COWES can distinguish them with their evolutionary features and generate clusters with much higher quality. Then we conduct experiments to compare the effectiveness of our similarity metric, which is referred to as “Approximate” in Figure 9, with an alternative similarity metric considering the Identical FCSPs only, which is referred to as “Identical” in Figure 9. As shown by the results in Figure 9, although both similarity metrics have similar performance in ES, our similarity metric works better in IS.
6
Related Work
Clustering of web users is an important task of web usage mining. Existing works on web user clustering usually extract access patterns of users from web server log files and organize them into web sessions. Xiao et al. [12] clustered web user sessions based on various similarity measures, such as the number of shared web pages, the frequency of accessing the shared web pages etc. Rather than clustering the web users based on web sessions directly, Fu et al. [5] first generalized the sessions so that pages representing the similar semantics are collapsed. By this manner, the dimension of clustering feature can be reduced significantly. Wang and Zaiane [11] also cluster web users based on snapshots of web sessions. They represented web sessions as vectors of encoded page IDs and then a clustering algorithm handling categorical data was employed. The critical difference between existing works on clustering web users and our effort is that we address the dynamic nature of web usage data. We measure the proximity of web
users based on the characteristics of their usage data evolution. Existing works measure the likeness between web users based on the information in snapshot web sessions. Consequently, the clusters generated by our algorithm indicate different knowledge and thus have different applications.
7
Conclusions
In this paper, we take into account the dynamic nature of web usage data to cluster web users. A novel method, COWES, for clustering web users by historical web sessions is presented. From a sequence of historical web sessions of each user, we first mine a set of Frequently Changed Subtree Patterns (F CSP s) to capture the characteristics in the evolution of his usage data. Then, the similarity between web users are computed based on their common FCSPs in terms of the Element Similarity as well as the Strength Similarity. Finally, a partitioning clustering technique is employed to generate clusters of web users. The experimental results show that our approach is effective in distinguishing web users with different characteristics in usage data evolution.
References 1. C. Buchwalter, M. Ryan, and D. Martin. The state of online advertising: data covering 4th Q 2000. In TR Adrelevance, 2001. 2. P. Cao and S. Irani. Cost-aware www proxy caching algorithms. In Proc. of USENIX SITSY, 1997. 3. L. Chen, S. S. Bhowmick, and L. T. Chia. Mining association rules from structural deltas of historical xml documents. In Proc. of PAKDD, 2004. 4. R. Cooley, B. Mobasher, and J. Srivastava. Data preparation for mining world wide web browsing patterns. In Knowledge and Information Systems. No. 1, 1999. 5. Y. Fu, K. Sandhu, and M. Shih. A generalization-based approach to clustering of web usage sessions. In Proc. of WEBKDD’99, 1999. 6. L. Kaufman and P. Pousseeuw. Finding groups in data: An introduction to cluster analysis. In John Wiley and Sons, 1990. 7. T. Li, Q. Yang, and K. Wang. Classification pruning for web-request prediction. In Proc. of WWW, 2001. 8. B. Mobasher, H. Dai, T. Luo, and M. Nakagawa. Effective personalization based on association rule discovery from web usage data. In Proc. of WIDM, 2001. 9. J. Srivastava, R. Cooley, M. Deshpande, and P.-N. Tan. Web usage mining: Discovery and applications of usage patterns from web data. In SIGKDD Explorations, 1(2):12-23, 2000. 10. L. Wang, D. W.-L. Cheung, N. Mamoulis, and S.-M. Yiu. An efficient and scalable algorithm for clustering xml documents by structure. In IEEE TKDE, 16(1): 82-96, 2004. 11. W. Wang and O. R. Zaiane. Clustering web sessions by sequence alignment. In Proc. of DEXA, 2002. 12. J. Xiao and Y. Zhang. Clustering of web users using session-based similarity measures. In Proc. of ICCNMC’01, 2001. 13. Q. Yang, H. H. Zhang, and T. Li. Mining web logs for predicition models in www caching and prefetching. In Proc. of ACM SIGKDD, 2001. 14. Y. Zhao and G. Karypis. Evaluation of hierarchical clustering algorithms for document datasets. In Proc. of CIKM, 2002.