Measurement in Physical Education and Exercise Science
ISSN: 1091-367X (Print) 1532-7841 (Online) Journal homepage: http://www.tandfonline.com/loi/hmpe20
Cross-Validation of a Recently Published Equation Predicting Energy Expenditure to Run or Walk a Mile in Normal-Weight and Overweight Adults Cody E. Morris , Scott G. Owens , Dwight E. Waddell , Martha A. Bass , John P. Bentley & Mark Loftin To cite this article: Cody E. Morris , Scott G. Owens , Dwight E. Waddell , Martha A. Bass , John P. Bentley & Mark Loftin (2014) Cross-Validation of a Recently Published Equation Predicting Energy Expenditure to Run or Walk a Mile in Normal-Weight and Overweight Adults, Measurement in Physical Education and Exercise Science, 18:1, 1-12, DOI: 10.1080/1091367X.2013.807264 To link to this article: http://dx.doi.org/10.1080/1091367X.2013.807264
Published online: 09 Dec 2013.
Submit your article to this journal
Article views: 610
View related articles
View Crossmark data
Full Terms & Conditions of access and use can be found at http://www.tandfonline.com/action/journalInformation?journalCode=hmpe20 Download by: [University of Mississippi]
Date: 02 October 2015, At: 05:30
Measurement in Physical Education and Exercise Science, 18: 1–12, 2014 Copyright © Taylor & Francis Group, LLC ISSN: 1091-367X print / 1532-7841 online DOI: 10.1080/1091367X.2013.807264
Cross-Validation of a Recently Published Equation Predicting Energy Expenditure to Run or Walk a Mile in Normal-Weight and Overweight Adults Downloaded by [University of Mississippi] at 05:30 02 October 2015
Cody E. Morris and Scott G. Owens Department of Health, Exercise Science, and Recreation Management, University of Mississippi, University, Mississippi
Dwight E. Waddell Department of Electrical Engineering, University of Mississippi, University, Mississippi
Martha A. Bass Department of Health, Exercise Science, and Recreation Management, University of Mississippi, University, Mississippi
John P. Bentley Department of Pharmacy Administration, University of Mississippi, University, Mississippi
Mark Loftin Department of Health, Exercise Science, and Recreation Management, University of Mississippi, University, Mississippi
An equation published by Loftin, Waddell, Robinson, and Owens (2010) was cross-validated using ten normal-weight walkers, ten overweight walkers, and ten distance runners. Energy expenditure was measured at preferred walking (normal-weight walker and overweight walkers) or running pace (distance runners) for 5 min and corrected to a mile. Energy expenditure per mile was predicted using the Loftin et al. (2010) equation yielding a mean predicted value of 99.7 ± 13.8 kcal · mile−1 . This was significantly different (p < .05) than the mean actual value from the cross-validation group (107.8 ± 15.5 kcal · mile−1 ), although the difference was within the published standard error of estimate. A Chow test revealed no significant differences between regression coefficients of the original equation and the cross-validation group equation. It appears the Loftin et al. (2010) regression
Correspondence should be sent to Cody E. Morris, Department of Health, Exercise Science, and Recreation Management, University of Mississippi, 215 Turner Center, University, MS 38677. E-mail:
[email protected]
2
MORRIS ET AL.
equation is useful for exercise prescription of energy expenditure for walking or running a mile in normal-weight and overweight adults. Key words: energy expenditure, cross-validation
Downloaded by [University of Mississippi] at 05:30 02 October 2015
INTRODUCTION The ability to accurately predict energy requirements for individuals is important for weight management (Mifflin, St. Jeor, Hill, Scott, Daugherty, & Koh, 1990; Williams, 2012). Even a modest weight loss of 10% can generate many positive effects, not only in physical health but also for an individual’s self-esteem (Larsson & Mattsson, 2003). Studies have found that when overweight participants work at a fixed submaximal treadmill speed, they must operate at a higher percentage of their previously determined aerobic capacity than normal-weight participants (Browning & Kram, 2005; Ekkekakis & Lind, 2006). An accurate method for determining overall energy requirements and expenditure is important for normal-weight and overweight populations (Mifflin et al., 1990; Williams, 2012). Limited research has examined overweight men and women when assessing energy expenditure (EE) to walk or run a mile (Loftin, Waddell, Robinson, & Owens, 2010). Total EE (TEE) can be increased by prolonging exercise activity or raising the intensity of exercise (Wing, 1999). However, overweight individuals tend to experience a greater amount of muscular and skeletal pain or intolerance to increases in exercise intensity, thus leading to a lesspleasant experience and greater likelihood of cessation of regular exercise (Ekkekakis & Lind, 2006). Additionally, it has been reported that overweight and obese individuals have expressed higher perceived exertion ratings with increased exercise intensity compared to normal-weight participants as well as an inability to tolerate an increase in intensity (Ekkekakis & Lind, 2006). Determining types of exercise programs that are beneficial to overweight participants is an important topic of research. Both overweight and normal-weight adults who are able to walk continually for 1 hr at their preferred pace can expect to complete about 3 miles; this amount meets the daily physical activity guidelines of the American College of Sports Medicine (ACSM) of daily walking at 3.0 mph for 1 h (ACSM, 2010; Loftin et al., 2010). To date, limited study has been conducted on caloric cost over a defined distance (Loftin et al., 2010). In order to perform the same relative amount of work as a normal-weight person, overweight individuals must put forth an increased amount of effort to overcome their greater body mass due to excess adipose tissue. Researchers have noted that the metabolic cost (VO2 relative to mass) was greater in overweight as compared to normal-weight participants (Browning & Kram, 2005; Larsson & Mattsson, 2003). Treuth et al. (1998) studied exercise ability of overweight children and found that the additional energy required to perform work was due to an increased body mass. Limited research has determined how much the metabolic rate cost per distance varies for overweight adults at varying speeds (Browning & Kram, 2005). In research examining the contribution of body composition factors contributing to the EE to complete a marathon, Loftin et al. (2007) observed that larger men and women runners had slower times and overall expended more calories than the runners who were considered smaller. In this same study, while running at marathon pace for 1 hr, men expended significantly more energy compared to women when values were corrected to marathon time (Loftin et al., 2007). The researchers noted that the main differences were due to body mass, while gender differences
Downloaded by [University of Mississippi] at 05:30 02 October 2015
CROSS-VALIDATION OF A RECENTLY PUBLISHED EQUATION
3
were probably due to variance in body size and composition (Loftin et al., 2007). It has been reported that while standing and comparing EE to body mass only, obese participants had a 20% lower VO2 than normal-weight participants (Browning, Baker, Herron, & Kram, 2006). However, when this data is evaluated to amount of lean body mass, no differences can be distinguished between obese and normal-weight participants (Browning et al., 2006). Loftin et al. (2010) found that evaluating EE per mile relative to amount of fat-free mass (FFM) showed similar results between overweight walkers (OW), normal-weight walkers (NWW), and marathon runners. The ability to correctly evaluate how much energy is spent metabolically during exercise is an essential component of any weight-management program (Browning et al., 2006; Williams, 2012). Loftin et al. (2010) noted that when comparing the EE per mile of OW, NWW, and marathon runners, groups were not significantly different from each other. Results showed that as body mass increased, EE per mile (kcal) increased, but whether the mile was walked or run was not significant (Loftin et al., 2010). In the regression equation devised for predicting EE to walk or run a mile, it was noted that 59.1% of the variance was due to body mass with an additional 4.1% accounted for by gender (Loftin et al., 2010). Browning et al. (2006) also showed that part of the difference in EE can be justified by the differences in amount of body fat a person has, although the specific location of adipose tissue was not found to be a significant factor in differences in EE. This same study also found that the net metabolic cost of walking for the obese walkers was about 10% greater per kilogram of body weight (BW) than the normal-weight group (Browning et al., 2006). Establishing a caloric prediction equation to more accurately estimate EE is an important goal. Research suggests that self-reported distance walked may be able to provide a more accurate and reliable method for calculating EE compared to self-reported time walked (Williams, 2012). The primary purpose of this study was to cross-validate the Loftin et al. (2010) equation.
METHOD Participants A total of 30 participants were recruited from the University of Mississippi and Oxford, MS, communities. The participants consisted of ten NWW, ten OW, and ten distance runners (DR). An even number of males and females were recruited and tested for each category (five males and five females per group). The research was approved by the Institutional Review Board committee at the University of Mississippi for the use of human subjects, and each participant signed an informed consent. Exercise Testing Procedures Pre-screening was conducted to determine contraindications to exercise. The Physical Activity Readiness Questionnaire (PAR-Q; Thomas, Reading, & Shephard, 1992) was used in order to screen for any contra-indications to exercise. Participants completed a 7-day physical activity questionnaire to determine physical activity status (Sallis, Haskell, & Wood, 1985). The participants in the OW group were considered healthy as determined by answers to the PAR-Q.
Downloaded by [University of Mississippi] at 05:30 02 October 2015
4
MORRIS ET AL.
Self-reported height and weight were obtained prior to arrival for calculating BMI for group placement of potential walker participants. Walker participants with BMI greater than 25.0 kg/m2 were initially assumed to be in the OW group and those below 25.0 kg/m2 in the NWW group. However, body fat percentage was the final group determinant and would override BMI if necessary (Adams et al., 2007). Body fat percentage ranges for consideration in the NWW and OW groups were determined using previously published recommendations based on gender and age (ACSM, 2010; Gallagher, Heymsfield, Heo, Jebb, Murgatroyd, & Sakamoto, 2000). Each participant’s body composition was evaluated using dual energy x-ray absorptiometry (DXA) as measured by a Hologic Delphi, QDR series (Bedford, MA) apparatus. Indirect calorimetry was used to measure EE during treadmill walking or running. All metabolic data (oxygen uptake, carbon dioxide production, pulmonary ventilation) were measured using a ParvoMedics TrueOne 2400 (Sandy, UT) measurement system. Before any metabolic testing was conducted, the system was calibrated against standard gases (O2 = 16.0%, CO2 = 4.0%). EE was measured in absolute units (kcal) as well as relative to mass or FFM; all caloric data were corrected to a 1-mile distance. Each participant had their caloric expenditure predicted for a 1-mile walk or run using the EE prediction equation developed by Loftin et al. (2010). The NWW and OW were evaluated by walking on a treadmill at their preferred pace. This speed was determined by evaluating their pace from six timed 50-foot trials on an indoor track. After a brief warm-up, the NWW and OW walked for 5 min on the treadmill at their preferred pace. Immediately following the 5-min walk, NWW and OW participants stood on the treadmill for an additional 5 min to assess excess post-exercise oxygen consumption (EPOC). After the 5-min standing period ended, NWW and OW participants were provided a brief rest period long enough for their heart rate (HR) to be within ten beats of resting HR. Once the rest period ended, participants performed a submaximal treadmill test to predict VO2 max using a modified Balke protocol (Froelicher, Brammell, Davis, Noguera, Stewart, & Lancaster, 1974). Exercise continued until HR reached 60% of predicted HR reserve (HRR). Independent regression equations were used to examine the VO2 –HR association, and VO2 max was estimated at the extrapolated HR max. After a brief warm-up, the DR were asked to run at their distance training pace for 5 min to project the pace of running a mile. Their training pace was determined from their self-reported race times (10 K, half marathon, or full marathon) from the previous 6 months. Immediately following the 5-min run, DR participants stood on the treadmill for an additional 5 min to assess EPOC. After the 5-min standing period ended, DR participants were provided a brief rest period long enough for their HR to be within ten beats of resting HR. Once rest period ended, participants performed a submaximal treadmill test using a modified Balke protocol until their HR reached the target HR of 60% of HRR. The protocol involved stages which increased by 1 mph and 1% grade every minute. The first stage began with the treadmill at 4 mph and 4% grade. The protocol was ended when the subject reached 60% of HRR.
Statistical Analysis The primary statistical analysis was a cross-validation (CV) of Loftin et al.’s (2010) published equation: kcal = mass (in kg) × 0.789 – gender (men = 1, women = 2) × 7.634 + 51.109.
CROSS-VALIDATION OF A RECENTLY PUBLISHED EQUATION
5
TABLE 1 Physical Characteristics of Participants Variable
Group
M
Standard Error
Minimum
Maximum
Age (years)
NWW OW DR NWW OW DR NWW OW DR NWW OW DR NWW OW DR NWW OW DR
22.6a 23.0a 28.7b 71.9a 86.8b 69.7a 1.75a 1.72a 1.73a 19.5a 30.7b 19.0a 13.4a 26.5b 13.1a 58.4a 60.3a 56.6a
0.8 0.9 2.3 5.5 2.6 3.0 0.03 0.03 0.03 1.9 2.1 1.7 1.1 1.8 1.1 5.3 2.9 3.0
18.0 20.0 21.0 50.5 76.4 55.5 1.63 1.56 1.56 9.7 21.4 12.1 7.5 16.8 7.8 38.1 47.0 42.7
25.0 29.0 42.0 104.0 101.0 84.6 1.87 1.91 1.92 29.1 40.5 26.9 19.4 36.9 19.9 84.3 72.8 71.7
Mass (kg)
Downloaded by [University of Mississippi] at 05:30 02 October 2015
Height (m)
Body fat %
Fat mass (kg)
FFM (kg)
∗ Different letters (a, b, or c) indicate significant differences (p < 0.05) between groups in the variables noted. The same letter indicates the variables are not significantly different.
A dependent t test was employed to compare the measured EE of the CV group to the predicted EE from the above-noted equation. Regression coefficients generated from the CV group were compared to the original equation’s coefficients using a Chow test (1960). Statistical shrinkage was also evaluated between R2 values of the original equation and CV regression analysis. Finally, one-way ANOVA was used to compare EE among the NWW, OW, and DR in the CV group. Statistical significance was set at the .05 level.
RESULTS Subject Characteristics Characteristics of each group are presented in Table 1. The OW group was found to have a significantly higher mass than both the NWW and DR, as well as having a higher body fat percentage. Fat weight was found to be significantly greater in the OW as compared to the NWW and DR, while fat-free weight showed no significant difference between groups. Height was similar across the three groups, as no significant difference in height was evident. The DR group was also found to be older than both the NWW and OW. The ethnic makeup of the participants consisted of 25 Caucasians and 5 African-Americans. Fourteen of the 25 Caucasians were males, 11 were females. One of the African-Americans was male and four were females.
6
MORRIS ET AL.
TABLE 2 EE to Walk or Run a Mile
Downloaded by [University of Mississippi] at 05:30 02 October 2015
Variable
M
SD
Group
M
SD
Measured kcal · mile−1
107.8
15.5
Predicted kcal · mile−1
99.7
13.8
NWW OW DR NWW OW DR NWW OW DR NWW OW DR
100.2a 115.6a 107.8a 96.4a 108.1b 94.7a 1.43a 1.33b 1.55c 1.79a 1.94a 1.92a
15.3 12.4 15.8 17.2 9.3 10.4 0.18 0.10 0.14 0.32 0.22 0.23
kcal · mile−1 kgBW−1
1.44
0.16
kcal · mile−1 kgFFM−1
1.88
0.26
∗ Different letters (a, b, or c) indicate significant differences (p < 0.05) between groups in the variables noted. The same letter indicates the variables are not significantly different.
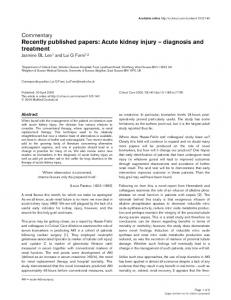
Caloric Expenditure per Mile Measurements The results presented in Table 2 refer to the kilocalories (both measured and predicted) expended per mile for each group. Predicted kcal/mile was determined using the Loftin et al. (2010) equation. The mean predicted kcal to walk or run a mile was 99.7 ± 13.8 kcal · mile−1 . The overall mean for the measured kcal expended when corrected to a 1-mile distance was 107.8 ± 15.5 kcal · mile−1 . A dependent t test revealed the Loftin et al. (2010) equation significantly underestimated the kcal to walk or run a mile in the CV group; however, the measured kcal was within the standard error of estimate (SEE; SEE = 10.9 kcal · mile−1 ) of the original equation. Regression Analysis The predicted kcal values and measured values in the CV group were found to have a strong, positive correlation (cross-validated, R = .778 and R2 = .605). A scatter plot indicating the relationship of mass and kcal to walk or run a mile can be found in Figure 1. Using data from the CV group, a regression equation was estimated in order to compare coefficients with the original Loftin et al. (2010) equation. The coefficient for mass was .825 for the CV group compared to .789 for the original sample (Loftin et al., 2010). The coefficient for gender was –1.687 for the CV group compared to –7.634 for the original sample (Loftin et al., 2010). The constant was 47.582 for the CV group compared to 51.109 for the original sample (Loftin et al., 2010). A Chow test (1960) was performed to evaluate any differences between the regression coefficients for gender and weight of the Loftin et al. (2010) equation and regression coefficients of the CV group. The effects of these predictors (i.e., the regression coefficients) were not significantly different between the original sample and the CV group (p = .539). R2 -values were also similar in both groups; for the CV group R2 = 0.625, while R2 = 0.632 for the Loftin et al. (2010) equation. As previously mentioned, cross-validated R2 (i.e., the square of the correlation between actual values from the CV group and predicted values in this group using
CROSS-VALIDATION OF A RECENTLY PUBLISHED EQUATION
7
150 140 130
Downloaded by [University of Mississippi] at 05:30 02 October 2015
Kcal · mile–1
120 110 100 90 80
Kcal = (Mass x 0.825) − [1.687 x (gender , m = 1 f = 2)] + 47.582 [SEE = 9.82, R2 = 0.625]
70 60 50
40
60
70 80 Mass (kg)
Cross-validation group (N = 30)
90
100
110
Cross-validation
FIGURE 1 Scatter plot of the CV group (kcal · mile−1 versus mass) (color figure available online).
the prediction equation from Loftin et al. [2010]) and the estimated shrinkage on CV was 0.027 (i.e., 0.632 – 0.605 = 0.027), which is minimal and suggestive of no significant difference in R2 values. A regression scatter plot is presented in Figure 1. Comparison of predictive ability of Loftin et al.’s (2010) equation and CV equation is presented in Figure 2.
EE Relative to Mass In addition to data collected for the purpose of cross-validating the equation, data were collected at rest as well as relative to mass and FFM. When gross caloric expenditure was expressed relative to mass, the DR group was found to expend more kcal · mile−1 than the other two groups. However, when EE per mile were compared relative to FFM, results were found to be similar across groups. Table 3 presents data relating the time to complete 1 mile by group as well as an assessment of percentage of VO2 max performed during the 5-min run or walk. When VO2 max was predicted from performing a VO2 sub-max test, predicted VO2 max was found to be significantly higher for the DR group compared to both walker groups. The DR group performed their 5-min run at a significantly higher percentage of their VO2 max as determined from the VO2 sub-max test than both the NWW and OW groups. As would be expected, the DR group’s treadmill speed was significantly greater than the pace for both the NWW and OW. Because the DR group was running
8
MORRIS ET AL.
150 140
Downloaded by [University of Mississippi] at 05:30 02 October 2015
Kcal · mile–1
130 120 110 100 Loftin et al. (2010): Kcal = Mass x (0.789) − 7.634 x (gender, m = 1 f = 2) + 51.109 [SEE = 10.9, R2 = 0.632]
90
Cross-validation group: Kcal = Mass x (0.825) − 1.687 x (gender, m = 1 f = 2) + 47.582 [SEE = 9.82, R2 = 0.625]
80 70 50
60
70
80
90
100
110
120
Mass (kg) Loftin et al. (2010)
Cross-validation Group
FIGURE 2 Predicting kcal · mile−1 based on body mass (color figure available online). TABLE 3 Oxygen Consumption at Preferred Pace and Time to Complete 1 Mile Variable
Group
M
SD
VO2 max (mL kg−1 min−1 )
NWW OW DR NWW OW DR NWW OW DR NWW OW DR
46.3a 39.1a 63.5b 35.1a 37.0a 59.8b 3.14a 3.05a 6.82b 19.3a 20.0a 8.9b
10.4 6.9 4.0 9.2 6.8 10.2 0.31 0.41 0.72 0.60 0.87 0.28
Percent of VO2 max worked during 5-min walk/run Preferred pace (mile hour−1 )
Time to complete one mile at preferred pace (min)
∗ Different letters (a, b, or c) indicate significant differences (p < 0.05) between groups in the variables noted. The same letter indicates the variables are not significantly different.
and traveling at a much faster pace than both walker groups, the DR would take a significantly shorter amount of time to complete 1 mile.
CROSS-VALIDATION OF A RECENTLY PUBLISHED EQUATION
9
DISCUSSION
Downloaded by [University of Mississippi] at 05:30 02 October 2015
CV The main focus of this study was to cross-validate the recently published Loftin et al. (2010) prediction equation using NWW, OW, and DR. The findings of this study suggest that there is sufficient evidence to indicate that the original equation is valid in predicting the number of kilocalories required to walk or run 1 mile at an individual’s preferred pace taking into account mass and gender. It appears the equation is useful for exercise prescription in that it allows for the prediction of EE for either walking or running a mile in normal-weight and overweight adults. The CV sample consisted of 30 total participants (10 NWW, 10 OW, and 10 DR). The original published Loftin et al. (2010) study had a sample size of 50 total participants (19 NWW, 11 OW, and 20 marathon runners). The sample size of 30 in the current study represents 60% of the sample size used by Loftin et al. (2010). When examining previously published studies that have performed CV analyses related to EE, the percentage of this study was consistent with the number of participants relative to the original population used in those CVs (Demura, Sato, Noguchi, & Nakata, 2007; Malek, Housh, Berger, Coburn, & Beck, 2005; Metsios et al., 2008). One method of CV used in this study was to assess whether the effects of the gender and mass predictors (i.e., the regression coefficients) were significantly different in the original equation and the CV equation. This was assessed via the Chow test using a single regression equation that combined the CV sample (n = 30) and the original Loftin et al. (2010) data (n = 50). The approach used a dummy variable to represent the sample from which the data came (i.e., CV or Loftin et al.) and interactions between this dummy variable and the gender and mass variables. A test of whether the coefficients for these two interactions terms equaled zero, given that all the lower-order terms (the single variable terms or “main effects” for gender, mass, and group membership—or the dummy variable) are already in the model, provides a test of whether the effects of gender and mass differ across groups (i.e., the Chow test). A sample size calculation for this Chow test would ask whether all members of a subset that contains k = 2 of the p = 5 coefficients are equal to zero. If it is assumed that the R2 without the interactions is equal to .6, which is close to the R2 from the original Loftin et al. (2010) equation, and that the two interaction effects explain an additional 4% of the variance (unique explained variance of 4% for these two interaction effects—a small to moderate effect on the R2 metric [Cohen, 1988]), and using an alpha of .05 and power of .8, the required sample size is 90. This is close to the combined sample size (n = 30 + 50 = 80) used in the present study to test the hypothesis of no differential effect of gender and mass in the original sample (50 participants) and the CV sample (30 participants). Thus, given earlier-described previously published studies that have performed CV analyses and the results of this sample size calculation, the sample size appears to be adequate. Measured and predicted kcal · mile−1 were assessed per walk or run group as well as a CV group mean and predicted mean using the Loftin et al. (2010) equation. Although a dependent t test yielded a significant difference between the means of the measured kcal · mile−1 and the predicted kcal · mile−1 , the difference in means (8.1 kcal · mile−1 ) was within the published SEE (10.9 kcal · mile−1 ; Loftin et al., 2010). Because the SEE of the original equation and the CV were similar, the Chow test (1960) was selected for further analysis. The Chow test results furthers the case of what was previously stated about the SEE, showing no significant difference
Downloaded by [University of Mississippi] at 05:30 02 October 2015
10
MORRIS ET AL.
between the two regression equations to warrant rejecting the original equation for a new one. This is suggestive of the Loftin et al. (2010) equation having the ability to accurately predict EE per mile based on mass and gender. The R2 value of the CV regression equation (R2 = .625) was found to be similar to the published R2 = .632 from Loftin et al. (2010). The size of the cross-validated R2 was similar with minimal shrinkage. The degree of shrinkage can be used as a guide to represent consistency and uniformity across samples (Guan, Xiang, & Keating, 2004). The closer this value is to zero, the greater the reliability that the data are stable and reproducible between groups (Guan et al., 2004). This difference of .027 is minimal and suggestive of no significant difference in R2 values. Additionally, by using measured kcal, mass, and gender as the factors, a regression equation was derived from the CV participants. Regression slopes showed similar trends and inspection of the graphs of the lines with the SEE of both lines included shows that their standard error bars overlap each other, echoing the statement that the equations do not produce significantly different results. This data suggests that the difference between the CV data and original data published by Loftin et al. is not significant enough to warrant rejecting the Loftin et al. (2010) equation in favor of a new one. EE Across Sub-Groups No significant differences among the NWW, OW, and DR groups were noted for kcal · mile−1 . These results are similar to findings in other related studies assessing gross EE between normalweight and overweight individuals over a defined distance or time (Browning et al., 2006; Loftin et al., 2010; Welle, Forbes, Statt, Barnard, & Amatruda, 1992). These data suggest that when considering the gross caloric expenditure to walk or run 1 mile, caloric expenditure will be similar whether walking or running. Consequently, an individual beginning an exercise regimen would expend similar kcal either running or walking for a given distance. Data suggest that if a person can begin his/her exercise with a light- to moderate-intensity walk, they could perform the necessary amount of exercise at his/her own pace while decreasing the risk for injury or over-exertion. That added pain or discomfort could potentially lead to greater likelihood of failing to complete their prescribed exercise (Ekkekakis & Lind, 2006). The DR group was found to have a significantly higher VO2 max than both walker groups, with no significant difference noted between NWW and OW. These results are not surprising due to the process involved in recruiting the DR participants. Race times for a 10 K, half-marathon, or marathon from the past 6 months were asked of them to determine preferred pace. Therefore, it was expected that DR would have a significantly higher VO2 max than the walker groups due to the considerable training that they have previously performed for these races. The finding that NWW and OW were walking at similar percentages of their VO2 max differs from previous studies. Browning and Kram (2005) reported that the overweight women exercised at 51% of their VO2 max at preferred walking speed, while normal-weight women walked at 36% of their VO2 max. Ekkekakis and Lind (2006) also noted that overweight women performed the walk at the preferred pace at a significantly higher percentage of their VO2 max than normalweight women. The NWW and OW groups were both found to prefer to walk at similar speeds, echoing what has been published in previous studies (Browning & Kram, 2005; Ekkekakis & Lind, 2006; Loftin et al., 2010).
CROSS-VALIDATION OF A RECENTLY PUBLISHED EQUATION
11
Downloaded by [University of Mississippi] at 05:30 02 October 2015
EE Relative to Mass Similar findings reporting significant differences when comparing kcal per kg of BW have been reported (Browning et al., 2006; Loftin et al., 2010; Treuth et al., 1998). However, when this same kcal · mile−1 data were assessed relative to FFM, no significant differences across groups were found. Other studies assessing preferred speed of walking for both normal-weight men and women have found similar data in their study when kcal · mile−1 was compared relative to FFM (Browning et al., 2006; Loftin et al., 2010). Welle et al. (1992) studied normal-weight and overweight women in free-living conditions and measured their EE using the doubly labeled water method and also found that TEE was greater in the overweight than normal-weight participants but that differences disappeared when TEE was made relative to FFM. Treuth et al. (1998) reported similar findings in their study of female children between the ages of 7 and 10 years. In summary, the CV results of this study provide support for the validity of the original equation (Loftin et al., 2010). However, as previously mentioned, the small sample size is a limitation of the present study. Given this information, the original equation to predict EE to run or walk a mile across normal-weight and overweight adults is recommended, but additional research with larger samples is needed for full validation to be confirmed.
REFERENCES Adams, T. D., Heath, E. M., LaMonte, M. J., Gress, R. E., Pendleton, R., Strong, M., . . . Hunt, S. C. (2007). The relationship between body mass index and per cent body fat in the severely obese. Diabetes, Obesity, and Metabolism, 9, 498–505. American College of Sports Medicine (ACSM). (2010). ACSM’s guidelines for exercise testing and prescription (8th ed., 6–64). Philadelphia, PA: Wolters Kluwer/Lippincott Williams & Wilkins. Browning, R. C., Baker, E. A., Herron, J. A., & Kram, R. (2006). Effects of obesity and sex on the energetic cost and preferred speed of walking. Journal of Applied Physiology, 100, 390–398. Browning, R. C., & Kram, R. (2005). Energetic cost and preferred speed of walking in obese vs. normal weight women. Obesity Research, 13, 891–899. Chow, G. C. (1960). Tests of equality between sets of coefficients in two linear regressions. Econometrica, 28, 591–605. Cohen, J. (1988). Statistical power analysis for the behavioral sciences (2nd ed.). Hillsdale, NJ: Lawrence Erlbaum Associates, Inc. Demura, S., Sato, S., Noguchi, T., & Nakata, Y. (2007). Prediction of visceral fat area from anthropometric and segmental body composition variables using computed tomography. Sports Sciences for Health, 2, 16–22. Ekkekakis, P., & Lind, E. (2006). Exercise does not feel the same when you are overweight: The impact of self-selected and imposed intensity on affect and exertion. International Journal of Obesity, 30, 652–660. Froelicher, V. F., Brammell, H., Davis, G., Noguera, I., Stewart, A., & Lancaster, M. C. (1974). A comparison of the reproducibility and physiologic response to three maximal treadmill exercise protocols. Chest, 65, 512–517. Gallagher, D., Heymsfield, S. B., Heo, M., Jebb, S. A., Murgatroyd, P. R., & Sakamoto, Y. (2000). Healthy percentage body fat ranges: An approach for developing guidelines based on body mass index. American Journal of Clinical Nutrition, 72, 694–701. Guan, J., Xiang, P., & Keating, X. D. (2004). Evaluating the replicability of sample results: A tutorial of double crossvalidation methods. Measurement in Physical Education and Exercise Science, 8, 227–241. Larsson, U. E., & Mattsson, E. (2003). Influence of weight loss programmes on walking speed and relative oxygen cost (%vo2max) in obese women during walking. Journal of Rehabilitative Medicine, 35, 91–97. Loftin, M., Sothern, M., Koss, C. Tuuri, G., VanVrancken, C., Kontos, A., & Bonis, M. (2007). Energy expenditure and influence of physiologic factors during marathon running. Journal of Strength and Conditioning Research, 21, 1188–1191.
Downloaded by [University of Mississippi] at 05:30 02 October 2015
12
MORRIS ET AL.
Loftin, M., Waddell, D., Robinson, J., & Owens, S. (2010). Comparison of energy expenditure to walk or run a mile in adult normal weight and overweight men and women. Journal of Strength and Conditioning Research, 24, 2794–2798. Malek, M. H., Housh, T. J., Berger, D. E., Coburn, J. W., & Beck, T. W. (2005). A new non-exercise based vo2 max prediction equation for aerobically trained men. Journal of Strength and Conditioning Research, 19, 559–565. Metsios, G. S., Stavropoulos-Kalinoglou, A., Panoulas, V. F., Koutedakis, Y., Nevill, A. M., Douglas, K. M. J. . . . Kita, M. (2008). New resting energy expenditure prediction equations for patients with rheumatoid arthritis. Rheumatology, 47, 500–506. Mifflin, M. D., St. Jeor, S. T., Hill, L. A., Scott, B. J., Daugherty, S. A., & Koh, Y. O. (1990). A new predictive equation for resting energy expenditure in healthy individuals. American Journal of Clinical Nutrition, 51, 241–247. Sallis, J. F., Haskell, W. L., & Wood, P. D. (1985). Physical activity assessment methodology in the five-city project. American Journal of Epidemiology, 121, 91–106. Treuth, M. S., Figueroa-Colon, R., Hunter, G. R., Weinsier, R. L., Butte, N. F., & Goran, M. I. (1998). Energy expenditure and physical fitness in overweight vs. non-overweight prepubertal girls. International Journal of Obesity, 22, 440–447. Thomas, S., Reading, J., & Shephard, R. J. (1992). Revision of the Physical Activity Readiness Questionnaire (PAR-Q). Canadian Journal of Sport Sciences, 17, 338–345. Welle, S., Forbes, G. B., Statt, M., Barnard, R. R., & Amatruda, J. M. (1992). Energy expenditure under free-living conditions in normal-weight and overweight women. American Journal of Clinical Nutrition, 55, 14–21. Williams, P. T. (2012). Advantages of distance- versus time-based estimates of walking in predicting adiposity. Medicine & Science in Sports & Exercise, 44, 1728–1737. Wing, R. R. (1999). Physical activity in the treatment of the adulthood overweight and obesity: Current evidence and research issues. Medicine and Science in Sports & Exercise, 31, S547–S552.