Sep 7, 2011 - J. W. Lynn, J. K. Liang, and G. H. Rao, Phys. Rev. B 71, 064405 .... N. Gates, H. C. Knachel, A. Finch, A. V. Fratini, A. N. Fitch,. O. Nardone, J. C. ...
PHYSICAL REVIEW B 84, 104107 (2011)
Crystal structure and structural phase transitions in the GdBaCo2 O5.0 cobaltite Leonardo Lo Presti,1,* Mattia Allieta,1 Marco Scavini,1 Paolo Ghigna,2 Laura Loconte,1 Valerio Scagnoli,3 and Michela Brunelli4 1
Dipartimento di Chimica Fisica ed Elettrochimica, Universit`a degli Studi di Milano, Via Golgi 19, 20133 Milano, Italy 2 Dipartimento di Chimica, Universit`a degli Studi di Pavia, Viale Taramelli 16, 27100 Pavia, Italy 3 Paul Scherrer Institut (PSI), 5232 Villigen, Switzerland 4 Institut Laue-Langevin (ILL), 6, rue Jules Horowitz, 38042 Grenoble, France (Received 14 March 2011; revised manuscript received 20 July 2011; published 7 September 2011) We present an accurate investigation of the prototypical rare-earth cobaltite GdBaCo2 O5.0 by complementary synchrotron powder and conventional source single-crystal x-ray diffraction experiments. The correct space group (Pmmm) and the accurate crystallographic structure of this compound at room temperature (RT) have been determined. By increasing T a second-order structural-phase transition to a tetragonal structure with space group P4/mmm at T ≈ 331 K is found. Close to the N´eel temperature (TN ≈ 350 K), anomalies appear in the trend of the lattice constants, suggesting that the structural phase transition is incipient at TN . A possible mechanism for this complex behavior is suggested. DOI: 10.1103/PhysRevB.84.104107
PACS number(s): 61.05.cp, 61.50.Ks, 61.66.Fn, 64.70.K−
I. INTRODUCTION
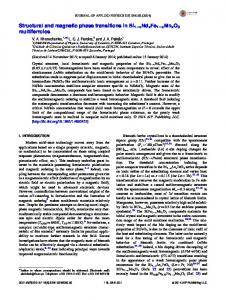
It is well known that the crystal structure and the bulk physics of correlated materials, such as band gap, orbital, charge ordering, and magnetic properties, are often coupled.1–4 It may also happen, on the other hand, that electronic and magnetic-phase transitions are associated to somewhat hardly detectable structural distortions that nevertheless may imply important symmetry changes. This is just the case of the cobaltites of general formula LnBaCo2 O5+δ , where 0 < δ < 1 and Ln may be a trivalent lanthanide ion or yttrium. Such compounds have raised in the last decade a great deal of interest due to their intriguing magnetic and transport properties,4–8 which can furthermore be varied as a function of temperature7–9 or even pressure.7 Recently, these compounds turned out to be attractive also for the development of new intermediatetemperature solid oxides fuel cells (IT-SOFC).10,11 They display the so-called “112”-type perovskite structure5 (Fig. 1), which consists of alternating layers where the three metals are piled up along the c axis, each of them being coordinated by oxygen anions arranged in squares through the sequence . . .-BaO-CoO2 -LnOδ -CoO2 -. . .. It should be noted that the δ-molar excess of oxygen ions is invariably accommodated in the rare-earth layer, which is totally oxygen-free in the stoichiometric LnBaCo2 O5.0 compounds. Such variability in the oxygen stoichiometry influences the oxidation state of cobalt, making possible the coexistence of Co(II)/Co(III) (δ < 0.5) or Co(III)/Co(IV) (δ > 0.5) both in octahedral (CoO6 ) and square pyramidal (CoO5 ) environments. In general the possibility of tuning with great accuracy the effective oxygen content12 and/or selecting lanthanide ions of different radii13 within the LnBaCo2 O5+δ structure, provides the opportunity to control several macroscopic key features such as resistivity, thermoelectric power, and magnetoresistance (MR).12,14–17 Approximately a decade ago, the crystal structure of oxygen-deficient LnBaCo2 O5.0 (Ln = Y,18 Tb,4 Dy,4 Ho,4 and Nd19 ) compounds was accurately determined by powderneutron diffraction studies, concluding that they are all paramagnetic with tetragonal space group P4/mmm above the N´eel temperature (TN ), that ranges from 330 to 380 K, 1098-0121/2011/84(10)/104107(9)
depending on Ln3+ ionic radii. Concerning the Ln = Gd compound, in particular, a reasonable estimate of TN ≈ 350 K comes from both magnetic12 and shear modulus20 measurements. In any case it is reported that below TN these cobaltites “undergo a magnetic transition to an antiferromagnetic structure which itself induces an orthorhombic distortion of the unit-cell,”4 leading to a different structure that can be more accurately described by the orthorhombic Pmmm space group. Actually, the room temperature (RT) structure of the Ln = Gd stoichiometric cobaltite (GdBaCo2 O5.0 ) was also described as orthorhombic (Pmmm) by x-ray powder diffraction experiments.17 More recently, however, the same compound was assigned to higher tetragonal symmetry on the basis of single-crystal x-ray diffraction results at RT.12 Such conflicting outcomes between single-crystal and powderdiffraction techniques raise the question on what is the correct space group of GdBaCo2 O5.0 below TN ≈ 350 K,12 and, as a consequence, the pertinent temperature scales for the magnetic and structural-phase transitions. This is a central point, as the structural symmetry governs a number of intensive physical properties of the condensed matter.21–23 Moreover, several authors emphasize the importance of the crystal structure to rationalize the orbital and spin states of the transition-metal ions in these materials. 9,20,23–25 Neutron diffraction studies on the Ln = Gd compound may solve the issue, but the considerable neutron absorption coefficient of gadolinium makes them quite difficult if compared to earlier experiments on structurally related compounds.4 Anyhow, it should be noted that the orthorhombic distortions in the previously mentioned LnBaCo2 O5.0 cobaltites are very small, the difference between the a and b parameters being roughly 0.2–0.3% (see Table 1 in Refs. 4 and 17), i.e., of the same order of magnitude as the estimated standard deviations (ESDs) on cell parameters typically retrieved by conventional single-crystal x-ray diffraction experiments: In fact, Taskin et al. described GdBaCo2 O5+δ as tetragonal for 0 < δ < 0.45 at RT even though they dealt with carefully prepared and detwinned specimen.12 Last but not least, it should be noted that in the literature concerning correlated materials, quite
104107-1
©2011 American Physical Society
LEONARDO LO PRESTI et al.
PHYSICAL REVIEW B 84, 104107 (2011)
FIG. 1. (Color online) Packing scheme and atom numbering (thermal ellipsoids drawn at 60% probability level) of GdBaCo2 O5.0 at T = 298 K, with coordination polyhedra of Ba (cuboctahedron), Co (square pyramid), and Gd (cube) highlighted. The frame encloses the region of space occupied by the conventional “112” unit cell. Realized with Diamond (v3.2f, © 1997–2010 Crystal Impact GbR, Bonn, Germany).
often the claim emerges of having obtained high-quality single crystals, and several physical properties are then measured on these specimens, usually throughout a large T (or p) range. It should be stressed, however, that the term single crystal has the precise meaning of “any solid object in which an orderly three-dimensional arrangement of the atoms, ions, or molecules is repeated throughout the entire volume.”26 In other words when the quality of single crystals is to be assessed, it is important to consider not only the chemical purity of them, but also the degree of perfection in terms of how many independent coherent scattering domains give rise to the observed diffraction signals. On the contrary, however, to the best of our knowledge, quantitative crystallographic information are rarely provided, despite their importance in assessing the actual sample quality or in ensuring that the specimen is truly single, i.e., not twinned or even polycrystalline. It should be stressed that even well-shaped crystals, with a homogeneous appearance of their surface, may be in fact severely twinned.27 Therefore, a great deal of caution should be employed in assessing the nature (monodomain or polydomain crystals?) of the specimen, especially when the overall measured physical properties of the material may depend on the effective degree of crystallinity or on its microstructure. Actually, this is just the case when the underlying physics manifests a significant anisotropic behaviour.6,12 Occasionally in the literature, on the contrary, samples claimed as high-quality single crystals do not resemble single crystals at all, even by visual inspection, as they display inhomogeneities (e.g., differently colored zones), breaks with misaligned regions, or significant amounts of their surface characterized by highly irregular shape together with clearly well-formed faces.28,29 On the other hand if only a true monodomain part of the sample was selected and then investigated by x-ray diffraction, the claim that the overall specimen is a high-quality single crystal appears to be absolutely not justified. The present contribution aims at (i) shedding light on the correct crystal symmetry of GdBaCo2 O5.0 across the
FIG. 2. Oxygen molar content δ as a function of T. Full circles: data from Ref. 12; empty circles: heating in air; black squares: heating in N2 .
N´eel temperature; (ii) finding the pertinent temperature scales for the magnetic and structural-phase transitions; and (iii) illustrating what are the pros and cons of single-crystal (SCD) and high-resolution powder (HRXPRD) x-ray diffraction techniques when applied to the test case here described. II. EXPERIMENTAL A. HRXPD experiments
A batch of microcrystalline GdBaCo2 O5+δ was prepared by solid-state reaction in air. Stoichiometric amounts of highpurity powders of Gd2 O3 (Aldrich 99.9%), BaCO3 (Aldrich 99.98%), and CoO (Aldrich 99.9%) were thoroughly mixed and pressed into pellets. After a decarbonation process (24 h at T = 1000 ◦ C), the mixtures were ground, pressed into pellets, fired in air at T = 1100 ◦ C for 48 h, and eventually, according to Taskin et al.,12 annealed at T = 850 ◦ C for 72 h in a flow of pure nitrogen. To check the oxygen content in the synthesized powdered material, we performed some thermogravimetric (TGA) measurements as a function of temperature and time in a flow of air (30 mL/min) and N2 (30 mL/min). TGA outcomes show that keeping the material for some hours at T > 800 ◦ C (Fig. 2) in inert atmosphere ensures that the lowest oxygen concentration can be actually obtained. Moreover, as noted by Taskin et al.,12 the δ = 0 composition is expected to be rather stable over a wide range of parameters. Subsequent HRXRPD analysis was performed on freshly prepared samples and no evidences of tetragonal/orthorhombic-phase coexistence attributable to minute oxygen-content variations18 were detected at RT. Eventually, it is worth noting that the final structural outcomes of the two techniques (see infra) are perfectly comparable to each other, providing further evidence that the composition of the powdered and single-crystal material should be the same. Powder diffraction patterns between T = 400 K and RT were collected at the ID31 beamline of the European Synchrotron Radiation Facility (ESRF) in Grenoble. A powdered
104107-2
CRYSTAL STRUCTURE AND STRUCTURAL PHASE . . .
PHYSICAL REVIEW B 84, 104107 (2011)
sample of GdBaCo2 O5.0 was loaded in a 0.67-mm-diameter kapton capillary and spun during measurements to improve ˚ powder randomization. A wavelength of λ = 0.39620(5) A was selected using a double-crystal Si(111) monochromator. Diffracted intensities were detected through nine scintillator counters, each equipped with a Si(111) analyzer crystal which span over 16◦ in the diffraction angle 2ϑ. Two different data collection strategies were employed: (i) the powdered sample was measured in the 0 < 2ϑ < 50◦ range for a total counting time of 1 hour, first at 300 K and at 400 K; (ii) HRXRPD patterns in the 0 < 2ϑ < 20◦ range were collected every 3 K while raising temperature from 300 K to 400 K. The sample was warmed using a N2 gas blower (Oxford Cryosystems) mounted coaxially. The HRXRPD patterns were analyzed with the Rietveld method as implemented in the GSAS software suite of programs30 which feature the graphical interface EXPGUI.31 The background was fitted by Chebyshev polynomials. Absorption correction was performed through the Lobanov empirical formula32 implemented for the Debye-Scherrer geometry. Line profiles were fitted using a modified pseudoVoigt function33 accounting for asymmetry correction.34 In the last cycles of the refinement, scale factor(s), cell parameters, positional coordinates, and isotropic thermal parameters were allowed to vary, as well as background and line-profile parameters. B. SCD experiment
GdBaCo2 O5+δ single crystals have been grown from the previously prepared powdered material using a Cyberstar image furnace in flowing air at a constant displacement rate of 0.5 mm/h. The final, black rod of material had a glasslike appearance, with a lot of very small, well-formed crystals grafted in an amorphous matrix on its top. The same annealing procedure as described before was applied to ensure the desired δ = 0 oxygen stoichiometry. Eventually, the rod was broken into pieces and the fragments carefully examined under a stereomicroscope. A ≈80-μm-large sample was found to be of suitable quality for the single crystal x-ray analysis and mounted with epoxy glue on the top of a glass fiber. Diffraction data were collected using a four-circle Siemens P4 diffractometer equipped with a conventional Mo source ˚ and a point-scintillation counter at nominal (λ = 0.71073 A) 50 kV × 30 mA x-ray power. RT unit-cell dimensions of GdBaCo2 O5.0 were determined from a set of 28 reflections (11 equivalents) accurately centered in the 10.8 � 2ϑ � 26.4◦ interval. An entire sphere of 2998 reflections was ˚ with scan rate of then collected within sinϑ/λ = 0.90 A 2◦ /min, providing a 100% complete dataset. The intensities of three reference reflections were monitored during the entire data acquisition, and a small linear correction for intensity decay (up to 1.01% upon a total of ≈94 h) was applied to the diffraction data. Possible off-lattice reflections were also looked for by accurate scanning of the reciprocal lattice at fractional indices positions, but no superlattice spots, alternative symmetries, or spurious reflections due to other differently oriented coherence domains were detected anyway. Systematic extinction rules were also carefully screened (see Table S135 ), revealing that no translational symmetry elements
are to be expected within the unit cell. Moreover, no significant anomalies affecting the shape of the diffraction peaks (see Fig. S2 in the deposited material35 for some examples) were detected throughout the data collection, providing further visual evidence that the crystal is in fact a true monodomain specimen. Further confirmation of the quality of this sample came from the inspection of the diffraction frames collected by an area detector at ESRF during a series of SCD experiments as a function of T that will be the topic of a future work. For GdBaCo2 O5.0 the absorption correction is probably the most crucial step of the data reduction process, as the linearabsorption coefficient of this material, μ, which amounts ˚ is exceptionally to 29.6 mm−1 for λMo,Kα = 0.71073 A, large with respect to lighter element-containing compounds. Nevertheless, in this case the problem is further complicated by the shape of the specimen, which is necessarily irregular as it was obtained after breaking into pieces the original rod used to produce single crystals from the melt. Some unsuccessful attempts were done to ground to a sphere other samples of the title compound: due to the considerable hardness of the material, the best shape we obtained (when the crystal did not break) was a sort of elongated ellipsoid—not significantly different from the specimen used in the current study. Moreover, the efforts spent in adopting a more accurate analytical absorption model, which would imply to correctly index the macroscopic crystal faces, led up till now to unsatisfactory results. As a matter of fact, the specimen is very small, black (making quite difficult to recognize the various faces), and its surface is characterized by both wellformed planes and irregular zones [Fig. 3(a)]. Therefore, we eventually chose to adopt an empirical absorption correction.36 To this end, 1926 individual azimuthal �-scan measures (i.e., around the diffraction vector in the reciprocal space) were performed on 28 suitable reflections covering, when possible, the entire � range with a scan rate of 2◦ /min. The empirical correction improved the merging R factor within the set of azimuthal measures from 0.0907 to 0.0257 (mmm point symmetry) and from 0.0920 to 0.0267 (4/mmm point symmetry). Figure 3(b) shows the effect of this correction on a couple of azimuthal scans: It can be seen that the periodic oscillations of the reflection intensities as function of � are considerably smoothed down, within 3 ESDs, to a constant, average value. This is due to the fact that, as it can be seen in Fig. 3(a), the elongated shape of the crystal is not too far from being an ellipsoid, making acceptable, all things considered, this absorption-correction strategy, at least for the accurate determination of the crystal structure. It should be noted that the previously described empirical absorption model provided the best results in terms of smoothing intensity oscillations of the azimuthal scans, equivalent-reflection intensities, final agreement factors, and electron-density residuals. Nevertheless, some small fluctuations in the corrected azimuthal scan intensities are still recognizable [Fig. 3(b)], indicating that a more accurate treatment is in order if sensible information besides the crystal structure, e.g., on the experimental-electron density, is sought. If unbiased (or at least less-biased) estimates of structure factor amplitudes in heavy atom-based compounds are looked for, it should be stressed that it is mandatory to proceed with great caution while performing the absorption correction of SCD diffraction data. In turn this is crucial
104107-3
LEONARDO LO PRESTI et al.
PHYSICAL REVIEW B 84, 104107 (2011) III. RESULTS AND DISCUSSION A. RT SCD experiment
FIG. 3. (Color online) (a) Single crystal of GdBaCo2 O5.0 employed in the present work, mounted on a glass capillary with two-component epoxy glue, as viewed with a Zeiss (STEMI DRC) microscope (40× magnification). The vertical bar in the photograph corresponds roughly to 80 μm. (b) Measured and corrected (mmm symmetry) intensities vs � angle (deg) relative to the azimuthal scans of the (2 0 −4) and (0 −1 6) reflections. The diameter of each dot corresponds to ≈1 ESD. Full dots: measured intensities. Empty dots: corrected intensities after applying the empirical absorption model.
not only for providing an accurate structural model but also in the perspective of assessing the correct crystal symmetry through equivalence relationships in the reciprocal space (see subsequent discussion). The SCD structural model (see Table I) was obtained within the spherical atom approximation.37 The direct-space Patterson function was employed to locate the metal atoms. Oxygen atoms were subsequently found by Fourier difference synthesis. No evidence of atom-site disorder was detected. The Lorentzian mosaic spread and the average domain size within the specimen were estimated by the software XD200638 to be as large as 26�� and 0.09 μm, respectively, on the basis of an isotropic type-II extinction model.39,40 It should be noted that such small misalignments of the coherence domains are randomly distributed throughout the lattice and do not imply that the selected sample is not a true single crystal. Generally speaking, lattice defects always affect real samples, in accordance with the Second Law of thermodynamics, and a certain amount of mosaic spread is unavoidable. Eventually, the compound stoichiometry was confirmed by SCD results, as no residual Fourier peaks attributable to guest atoms in the unit cell were found. Some supporting tables about the SCD data analysis process can be found in the EPAPS Document No. [number will be inserted by publisher].35 The .hkl file containing the final, unmerged dataset in Pmmm symmetry (see subsequent discussion) is available upon request.41
The proper assessment of the symmetry and cell parameters of the title compound is far from being trivial, as the orthorhombic distortion, if any, is certainly small. It is well recognized that joint powder and single-crystal diffraction techniques constitute a very powerful tool to achieve a high level of accuracy in crystal structure determinations.42–48 It is therefore desirable to apply such approach when the expected changes in the crystallographic structure are hardly detectable. Within the SCD technique, examining the intensitydistribution statistic usually faces the problem of recognizing the correct crystal-point symmetry, but this strategy is of difficult applicability to HRXRPD data due to overlapping of Bragg peaks.49 When the space group cannot be assigned on the basis of systematic extinctions, it is possible to complement the information provided by diffraction data with spectroscopic (IR, Raman) or second-harmonic generation techniques. In this way the correct-point symmetries can be in principle determined on the basis of the allowed vibration or electronicaccessible states.50,51 It should be noted that such a method can unequivocally assess the presence of a center of inversion, but it may not be straightforward (e.g., it may require the theoretical simulation of the IR and Raman active modes for different crystal symmetries51 ) when the ambiguity is more subtle, as in the case discussed here. In GdBaCo2 O5.0 , actually, the uncertainty arises from alternative choices between the C4 or C2 axes in the symmorphic, extinction-free, and centrosymmetric P4/mmm (D4h ) or Pmmm (D2h ) groups: To the best of our knowledge, the present study is the first aimed at discriminating the correct-point symmetry in heavy metal-containing compounds when different proper rotation axes are involved, by using diffraction methods only. As the equivalence relationships in the reciprocal lattice are different between orthorhombic and tetragonal symmetry, careful inspection of equivalent intensities is mandatory when ambiguities among different space groups occur, provided that the measured data were properly corrected for systematic errors (and particularly, in this case, for absorption: see previous discussion). Within the tetragonal system, hkl reflections are necessarily equivalent to the khl ones. On the contrary this is no longer true in an orthorhombic space group. To assess if there is some evidence from the analysis of the equivalent statistics that the orthorhombic symmetry is in fact to be preferred with respect to the tetragonal one, we carried out two parallel SCD data reductions both in Pmmm and P4/mmm space groups. In the following we will refer to such two distinct datasets as “orthorhombic” and “tetragonal,” respectively. In particular we compared individual measures of possible equivalent hkl and khl reflections within the “orthorhombic” dataset, i.e., that corrected for absorption without forcing the empirical transmission surface to make the azimuthal-scanned hkl and khl intensities to be equivalent to each other. If the merging R(int) factor, defined as �� ��� 2 �F 2 − F 2 � Fobs , R(int) = (1) obs is calculated for this dataset under the various Laue classes (see Table S2 in the deposited material35 ), it comes out to be essentially identical for the mmm and 4/mmm symmetries
104107-4
CRYSTAL STRUCTURE AND STRUCTURAL PHASE . . .
PHYSICAL REVIEW B 84, 104107 (2011)
TABLE I. Crystallographic and refinement details at RT for the stoichiometric cobaltite GdBaCo2 O5.0 (PM = 492.45 uma, Z = 1). Data collections Technique Source Data collection temperature (K) ˚ Radiation wavelength (A) Absorption coefficient (mm−1 ) Monochromator Diffractometer 2ϑ max (◦ ) No. of collected reflections
SCD Conventional x-rays 298 (2) 0.71073 (Mo Kα ) 29.585 Graphite single-crystal Siemens P4 79.8 2998
Lattice Space group ˚ a (A) ˚ b (A) ˚ c (A) ˚ 3) V (A No. of unique reflections Rmerge
Pmmm (47) 3.920 (1) 3.919 (1) 7.510 (1) 115.37 (4) 457 0.0437
HRXRPD Synchrotron radiation 300 (2) 0.39620(5) 5.573 Double-crystal Si(111) ID31 (ESRF) 50.0 727 P4/mmm (123) 3.920(1) 3.920(1) 7.510(1) 115.40(4) 259 0.0472
Spherical atom refinementsa R(F) wR(F 2 ) Gof Extinction parameter (shelx) Data-to-parameter ratio ˚ −3 ) �ρ max, min (e·A a
0.0293/0.0203 0.0547/0.0422 0.942/0.916 0.038(3)/0.059(4) 19.9/7.8 2.01, −2.05/0.97, −0.94
0.0271/0.0185 0.0526/0.0383 0.932/0.954 0.044(4)/0.068(5) 17.3/7.1 1.84, −2.42/0.66, −0.88
Pmmm (47) 3.91830(2) 3.92389(2) 7.51824(3) 115.593(1) Relevant Rietveld agreement factors R(F) 0.0277 R(F 2 ) 0.0447 Rp 0.1089
˚ −1 . All independent data/data within sinϑ/λ � 0.65 A
(0.042 vs 0.044). This implies that, even without explicitly imposing the 4/mmm symmetry, almost all the individual measures are equal, within 1 or 2 ESDs, to the corresponding weighted averages in P4/mmm. Closer inspection of the individual-diffraction measures shows that, even if the “orthorhombic” dataset is considered, the deviations with respect to the corresponding weighted means in P4/mmm are, in general, immaterial. Taking into account, as an example, the 16 individual measures with intensity I of the reflection (1 4 6) and all its 4/mmm equivalents (±1 ±4 ±6 and ±4 ±1 ±6) within the “orthorhombic” dataset, the quantity �[I − �I �]/σ (I )� comes out as large as 0.9, �I � being the weighted-average intensity and σ (I) the corresponding individual ESD for the measure with intensity I. Out of the total of 2998 measured diffraction data, only 13 (0.4%) deviate by more than 3.0 ESDs from the corresponding averages, 9 of them being nevertheless equal to their weighted average value within 4.0 ESDs. Such poorly significant differences can be explained, however, in terms of counting statistics or small imperfections of the empirical model for absorption. In general, the final “orthorhombic” and “tetragonal” datasets have individual intensities very similar to each other (Fig. S1 in the deposited material35 ), showing that neglecting the C4 proper symmetry axis in the unit cell during the data-reduction process has but an immaterial effect on the measured structure factor amplitudes. In other words the absorption correction produces exactly the same effects on the observed intensities, irrespective of the Laue group (4/mmm or mmm) adopted to generate the empirical transmission surface.
In regard to the final least-square agreement factors, they are slightly lower in P4/mmm symmetry (see Table I), but such differences are again barely significant, as it is possible to easily account for them considering the different datato-parameter ratio (≈20 in Pmmm vs ≈17 in P4/mmm). Therefore, in agreement with earlier SCD reports on the same compound,12 there are not unquestionable evidences to reject the higher P4/mmm symmetry in favor of the lower Pmmm orthorhombic one. Rather, from the analysis of both the lattice metric and the reflection statistics, the tetragonal symmetry is to be preferred on the basis of our RT SCD data. B. HRXRPD results across the PM-AF transition
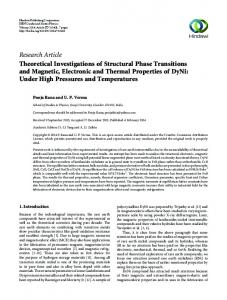
Figure 4 shows the Rietveld refinement against HRXRPD data at T = 300 K in the Pmmm space group, using as a starting point the structural model provided by SCD at 298 K. The corresponding structural and agreement parameters are reported in Table I. Positional and thermal parameter estimates for the same title compound at T = 400 K (�TN , P4/mmm symmetry) can be found within the deposited file35 (Table S3) together with the HRXRPD diffractogram at the same temperature (Fig. S3). In the final model the isotropic thermal parameters of oxygen atoms were constrained to be the same. Good R(F 2 ) values were obtained, testifying the suitability of the structural model.52 Conversely, the Rp values are quite high owing to the considerable narrowness of the instrumental resolution of the ID31 beamline. At T = 400 K, GdBaCo2 O5.0 has tetragonal structure with space group
104107-5
LEONARDO LO PRESTI et al.
PHYSICAL REVIEW B 84, 104107 (2011)
FIG. 4. Observed (dots) and calculated (lines) HRXRPD for GdBaCo2 O5.0 at 300 K. Inset: high-angle diffraction peaks. The difference between the observed and fitted patterns is displayed at the bottom.
P4/mmm and cell metric ap × ap × 2ap , ap being the cubic perovksite lattice parameter. In Fig. 5(a) the most relevant part of the diffraction patterns collected at 300 � T � 400 K is shown, with the appropriate crystallographic indexes highlighted. The (200)O and (020)O peaks, clearly resolved at lower T, belong to the orthorhombic Pmmm space group and merge together at higher temperatures. Above T = 331 K they are no more distinguishable, as their difference in the d-space falls below the instrument resolution (�d/d ∼ 10−4 ). Above the estimated N´eel temperature (350 K), on the other hand, only the (200)T reflection indexed within a tetragonal unit cell is recognizable. It should be noted, however, that the full width at half maximum (FWHM) of the (200)T profile in tetragonal symmetry monotonically increases upon cooling from 360 to 330 K [Fig. 5(b)]. In other words some kind of structural distortion, clearly visible in the high-resolution powder diffraction pattern, is taking place around the N´eel temperature. In any case attempts to describe the (200)O peak in the 331 K < T < 350 K range using a multiple-peak fitting were somewhat unsuccessful, as the individual profile shapes were at least questionable and sometimes clearly unphysical. These evidences seem to point out that the tetragonal-to-orthorhombic symmetry lowering is indeed coupled with the magnetic transition around the N´eel temperature.12 This conclusion is supported by inspecting the temperature evolution of the cell parameters [Fig. 5(c)]. Interestingly, between 350 and 330 K the a axis follows a nonmonotonous behavior featuring a very slight lengthening below 350 K, until the tetragonal symmetry is clearly broken below T = 330 K. Such an evidence, together with the previously commented behavior of the (200)T line width, suggests that the reported magnetic transition is in fact coupled with structural changes, which in turn require some tens of kelvins to be fully exploited. However, it should be noted that the structural phase transition is only incipient in close proximity of the reported TN ,12,20 i.e., some kind of small bulk lattice distortions occur and affect the profile shape parameters in high-resolution powder diffractograms, without yet being able to cause a clearly measurable structural symmetry breaking until T ≈ 331 K. Interestingly, the (200)T FWHM starts to smoothly
FIG. 5. (a) (200) and (020) diffraction peaks as a function of temperature. Subscripts T and O stand for tetragonal and orthorhombic, respectively. (b) Evolution of the FWHM parameter of the (200) and (020) peaks for the orthorhombic and tetragonal phases. (c) Lattice parameters a, b (full grey dots: tetragonal phase; empty dots: orthorhombic phase) and c (black dots) of GdBaCo2 O5.0 as a function of temperature. Continuous lines are guides for the eye.
increase when T < 364 K, i.e., even above TN [Fig. 5(b)], while the slope of the crystallographic aT axis vs T clearly change sign just at T ≈ TN [Fig. 5(c)]. In other words the behavior of the aT lattice parameter seems to be more closely coupled with the magnetic transition. Overall, it appears reasonable that the previously mentioned distortions are somewhat related to small oxygen displacements in the unit cell, but their full rationalization is not straightforward. On the other hand, it is known that in GdBaCo2 O5+δ with δ ≈ 0.5, the observed structural phase transitions in the 300 < T< 400 K range are somewhat associated to electronic effects, and in particular, to orbital ordering.18,53 A tentative explanation to account for the ≈20 K discrepancy in the δ = 0 compound between TN and the temperature where symmetry definitely breaks down could reside in the mismatch between the local and long-range magnetic order in the 330 < T < 350 K range. This hypothesis implies that between 350 and 364 K the spins of the paramagnetic phase are organized in small antiferromagnetic clusters which are suppressed at T > 364 K. From a structural point of view, local magnetic clustering can be associated to a sort of local symmetry breaking, where oxygen atoms undergo small displacements that locally lower the lattice symmetry from P4/mmm to Pmmm. Within this scenario, a further decrease of T below ∼350 K allows this small magnetic cluster to grow in size, resulting in a transition from local to long-range magnetic ordering. As a consequence, the strength of the antiferromagnetic interactions gradually increases until a critical value (probably near 330 K) is reached; then, an overall structural lattice transition takes place. In other words the lattice distortions observed in this temperature range could be associated with gradual localization of the spins due to the strengthening of the long range antiferromagnetic ordering
104107-6
CRYSTAL STRUCTURE AND STRUCTURAL PHASE . . .
PHYSICAL REVIEW B 84, 104107 (2011)
˚ 2 ) as obtained from least-square TABLE II. Fractional atomic coordinates (dimensionless) and allowed thermal Uij tensor parameters (A refinements on the SCD (first line: Pmmm; second line: P4/mmm) and HRXRPD (third line, Pmmm) diffraction data at RT. ESDs in parentheses.a Atom
x/a
y/b
z/c
Gd
0.5000
0.5000
0.5000
Co
0.0000
0.0000
Ba
0.5000
0.5000
0.2569(2) 0.2570(2) 0.2571(2) 0.0000
O1
0.0000
0.0000
0.0000
O2
0.5000
0.0000
O3c
0.0000
0.5000
0.3093(6) 0.3095(5) 0.3098(12) 0.3095(6) 0.3063(12)
Ueq b
U11
U22
U33
0.0115(1) 0.0117(2) 0.0054(2) 0.0125(1) 0.0126(2) 0.0054(2) 0.0144(1) 0.0146(2) 0.0074(2) 0.016(1) 0.017(2) 0.0113(8) 0.0153(8) 0.0156(7) 0.0113(8) 0.0150(8) 0.0113(8)
0.0119(2) 0.0120(2) 0.0118(3) 0.0116(2) 0.0140(2) 0.0140(2) 0.019(3) 0.020(3) 0.016(2) 0.016(2) 0.016(2) -
0.0116(2) 0.0120(2) 0.0112(3) 0.0116(2) 0.0137(2) 0.0140(2) 0.020(3) 0.020(3) 0.017(2) 0.017(2) 0.015(2) -
0.0110(2) 0.0112(2) 0.0144(3) 0.0145(4) 0.0155(2) 0.0156(3) 0.010(2) 0.010(3) 0.014(2) 0.014(1) 0.014(2) -
a
Symmetry-constrained fractional coordinates are only once reported. Lacking entries (-) indicate that the corresponding parameters are not refined in the least-square model. b When the atomic thermal motion is described as anisotropic, Ueq is defined as 1/3 of the trace of the corresponding thermal tensor. c In P4/mmm symmetry, O3 is symmetry related with O2.
upon cooling that in turn implies a gradual splitting of the Bragg peaks. It should be also noted, however, that other data should be collected, for example, by means of dielectric spectroscopy and magnetic susceptibility measurements, to provide insights on the above sketched picture. Actually, it should be remarked that the structural distortions in the 330–350 K range detected by powder x-ray diffraction analysis are below the instrumental resolution. Therefore, it cannot be excluded that the long-range symmetry breaking occurs at temperatures even higher than 330 K. We deserve to investigate this topic more in detail in subsequent works, as the full magnetic and electronic characterization of the P4/mmm to Pmmm phase transition in the title compound goes beyond the purposes of the present discussion.
C. Crystal structure of GdBaCo2 O5.0
If the atomic positional and thermal parameters as obtained from both the SCD refinements (‘orthorhombic’ and ‘tetragonal’) at RT are compared (Table II), no significant differences emerge, as within 2 ESDs all the geometric and thermal parameters are perfectly identical. This was not truly surprising, if the results previously described on the intensity equivalences of reflections in the reciprocal space are taken into account. On the other hand conclusions drawn in the reciprocal lattice also hold true when the real lattice is considered. In particular, granted that the C4 axis is removed, making the cell orthorhombic, the very closeness in lengths of a and b cell edges (pseudotetragonal lattice metric), together with essentially identical positions of the symmetry-independent O2 and O3 oxygen atoms in Pmmm, result in fact in a pseudo-C4 lattice symmetry, which cannot
be discriminated from a true C4 one on the basis of the current precision provided by our SCD experiment. In general the HRXRPD results on atomic positions (Table II) and next-neighbors’ distances (Table III) also agree quantitatively with the SCD ones. The only significant differ˚ ence affects the Gd–O3 distance (Table III), being 0.014 A (∼0.6%) longer from the HRXRPD refinement. Such a deviation is due to the slightly different O3 z coordinate obtained from the HRXRPD and SCD data (Table II). Nevertheless, the SCD outcome for z(O3) lies within a confidence interval of ±3 ESDs with respect to the HRXRPD estimate. Greater differences affect the isotropic equivalent displacement parameters of the metal atoms, Ueq , that are systematically lower (roughly halved) in the HRXRPD results. Anyhow, significant discrepancies among thermal-motion parameters among the HRXRPD and SCD techniques are not uncommon,54 as they depend critically on least-square strategy, data treatment, and experimental settings.
TABLE III. Bond distances among symmetry-independent nextneighbor atoms in GdBaCo2 O5.0 at RT as obtained from HRXRPD and SCD x-ray diffraction experiments. ESDs in parentheses. Atoms Ba–O1 Gd–O2 Gd–O3 Co–O1 Co–O2 Co–O3
104107-7
˚ (HRXRPD) d/A 2.773(