LETTER
doi:10.1038/nature09789
Crystal structure of metarhodopsin II Hui-Woog Choe1,2*, Yong Ju Kim1*, Jung Hee Park1*, Takefumi Morizumi1{, Emil F. Pai3, Norbert Krauß4, Klaus Peter Hofmann1,5, Patrick Scheerer1 & Oliver P. Ernst1{
G-protein-coupled receptors (GPCRs) are seven transmembrane helix (TM) proteins that transduce signals into living cells by binding extracellular ligands and coupling to intracellular heterotrimeric G proteins (Gabc)1. The photoreceptor rhodopsin couples to transducin and bears its ligand 11-cis-retinal covalently bound via a protonated Schiff base to the opsin apoprotein2. Absorption of a photon causes retinal cis/trans isomerization and generates the agonist all-trans-retinal in situ. After early photoproducts, the active G-protein-binding intermediate metarhodopsin II (Meta II) is formed, in which the retinal Schiff base is still intact but deprotonated. Dissociation of the proton from the Schiff base breaks a major constraint in the protein and enables further activating steps, including an outward tilt of TM6 and formation of a large cytoplasmic crevice for uptake of the interacting C terminus of the Ga subunit3–5. Owing to Schiff base hydrolysis, Meta II is short-lived and notoriously difficult to crystallize. We therefore soaked opsin crystals with all-trans-retinal to form Meta II, presuming that the crystal’s high concentration of opsin in an active conformation (Ops*)6,7 may facilitate all-trans-retinal uptake and Schiff base ˚ and 2.85 A ˚ crystal structures, formation. Here we present the 3.0 A respectively, of Meta II alone or in complex with an 11-amino-acid C-terminal fragment derived from Ga (GaCT2). GaCT2 binds in a large crevice at the cytoplasmic side, akin to the binding of a similar Ga-derived peptide to Ops* (ref. 7). In the Meta II structures, the electron density from the retinal ligand seamlessly continues into the Lys 296 side chain, reflecting proper formation of the Schiff base linkage. The retinal is in a relaxed conformation and almost undistorted compared with pure crystalline all-trans-retinal. By comparison with early photoproducts we propose how retinal translocation and rotation induce the gross conformational changes characteristic for Meta II. The structures can now serve as models for the large GPCR family. To obtain crystals of Meta II alone or in complex with the GaCT2 peptide, we followed previous approaches using low pH to obtain crystals of opsin in the active Ops* conformation6,7 for subsequent soaking with all-trans-retinal. GaCT2 was derived from the transducin Ga C terminus and contained two substitutions which improved crystal diffraction quality compared with crystals containing the native peptide fragment (see Methods). Reversible formation of Meta II is indicated by (1) the 380-nm absorption obtained before and after dissolving the all-trans-retinal-soaked opsin or opsin–GaCT2 crystals, respectively, (2) formation of an opsin-retinal Schiff base bond as determined by acid denaturation of the reconstituted pigments (Supplementary Fig. 1), (3) the X-ray crystallographic evidence for the Schiff base bond between all-trans-retinal and Lys 2967.43 of opsin (see below), and (4) the high activity of the reconstituted pigment towards the G protein (Supplementary Fig. 2). In addition, soaking of the opsin crystals with all-trans-retinal for an optimized soaking time had only little effect on the diffraction quality of the opsin crystals,
indicating that the Ops* conformation present in the crystal is compatible with the all-trans-retinal agonist. In contrast, soaking of opsin crystals with the inverse agonist 11-cis-retinal led to a reddish colour indicative of rhodopsin formation. Soaking was accompanied by severe loss of crystal diffraction quality, indicating disintegration of crystal packing, consistent with the expected larger conformational changes induced in the protein by 11-cis-retinal. The structures of Meta II and Meta II–GaCT2 were solved at 3.0 ˚ resolution, respectively, by molecular replacement techand 2.85 A niques using opsin in the Ops* conformation (PDB accession 3DQB) as search model. For crystallization, data collection, structure determination and refinement statistics, see Methods and Supplementary Table 1. The structures comprise amino acids 1–326 of the opsin protein moiety, lacking 22 C-terminal amino acids, which are not resolved in the corresponding electron density maps, presumably because of high mobility6,7. Each model also includes one molecule all-trans-retinal, oligosaccharyl chains at Asn 2NT (for superscripts see Methods Summary) and Asn 15NT, several water and two n-octyl-bD-glucopyranoside molecules, and in addition in the case of Meta II–GaCT2, the 11-amino-acid GaCT2 peptide. The models further comprise one molecule palmitic acid covalently bound to Cys 323H8; a second palmitic acid residue at Cys 322H8 is lacking in each model because of weak electron density. The overall structure of Meta II and Meta II–GaCT2, comprising seven TMs connected by cytoplasmic and extracellular loops (CL1–CL3 and EL1–EL3) which are followed by the cytoplasmic helix H8, is similar to the previously solved Ops* and Ops*– GaCT structures6,7, but quite different from inactive rhodopsin8–10. The ˚ are 0.51 (Ops*/ Ca root mean squared deviation (r.m.s.d.) values in A Meta II), 0.44 (Ops*–GaCT/Meta II–GaCT2), 0.35 (Meta II/Meta II–GaCT2) and 2.85 (Rhodopsin/Meta II) (Fig. 1 and Supplementary Fig. 3)6,7,9. Both Meta II and Meta II–GaCT2 display the open cytoplasmic receptor surface: due to a rotational tilt of TM6 and motion of TM5 a crevice in the cytoplasmic surface is created into which the Ga C terminus or its mimic, the GaCT2 peptide, can bind4,5,7. The Meta II structures now provide insight into retinal–protein interactions in the ligand binding site. The initial electron density map calculated with omitted retinal ligand could readily be interpreted with the relaxed all-trans-retinal conformation represented by the model obtained from the Cambridge Structural Database (reference code TRETAL02; Supplementary Figs 4 and 5). There is strong electron density connecting the retinal into the side chain of Lys 2967.43 consistent with the presence of a Schiff base bond between carbon atom C15 of retinal and the e-amino group of Lys 2967.43 (Fig. 2 and Supplementary Fig. 4). The refinement of the Meta II structures only slightly changed the initial conformation of all-trans-retinal, indicating that retinal in a relaxed conformation is bound in the ligand binding site of Ops*, in agreement with spectroscopic studies on Meta II (ref. 11). Both structures, Meta II and Meta II–GaCT2, show an almost identical retinal conformation (Supplementary Fig. 5). The
1
Institut fu¨r Medizinische Physik und Biophysik - CC2, Charite´ - Universita¨tsmedizin Berlin, Charite´platz 1, D-10117 Berlin, Germany. 2Department of Chemistry, College of Natural Science, Chonbuk National University, 561-756 Chonju, South Korea. 3Departments of Biochemistry, Molecular Genetics and Medical Biophysics, University of Toronto, 1 King’s College Circle, Toronto, Ontario M5S 1A8, Canada. 4Queen Mary University of London, School of Biological and Chemical Sciences, London E1 4NS, UK. 5Zentrum fu¨r Biophysik und Bioinformatik, Humboldt-Universita¨t zu Berlin, Invalidenstrasse 42, D-10115 Berlin, Germany. {Present addresses: Department of Biochemistry, University of Toronto, 1 King’s College Circle, Toronto, Ontario M5S 1A8, Canada (T.M.); Departments of Biochemistry and Molecular Genetics, University of Toronto, 1 King’s College Circle, Toronto, Ontario M5S 1A8, Canada (O.P.E.). *These authors contributed equally to this work. 3 1 M A R C H 2 0 1 1 | VO L 4 7 1 | N AT U R E | 6 5 1
©2011 Macmillan Publishers Limited. All rights reserved
RESEARCH LETTER Rhodopsin
H8
3
H8
3
3
H8
5
5
5
4
4
4
6
1
Meta II–GαCT2
Meta II
1 2
2
1
6
6
2
7
7
7
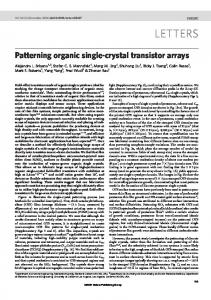
Figure 1 | Structures of inactive rhodopsin, active Meta II and Meta II in complex with a Ga fragment. Side view of cartoon model of rhodopsin (PDB accession 1U19), Meta II and Meta II–GaCT2, that is, Meta II in complex with an 11-amino-acid C-terminal peptide derived from the transducin Ga subunit, representing the key binding site on the heterotrimeric G protein. Inactive rhodopsin consists of the apoprotein opsin in its inactive conformation and the inverse agonist 11-cis-retinal (shown as red spheres), which is covalently bound to Lys 296 (shown as black spheres) via a Schiff base. In Meta II, the agonist all-
trans-retinal (shown as blue spheres) is covalently linked to Lys 296. The G-protein-interacting conformation of Meta II (right panel) is identified by the bound Ga fragment (shown in purple). Transmembrane helices (numbered 1–7) are followed by a cytoplasmic helix H8. The Meta II models lack 22 C-terminal residues, the C terminus of rhodopsin is not shown. The extracellular domain contains four b-strands (coloured in cyan). Glycosylation at Asn 2 and Asn 15 and palmitoylation at Cys 322 and Cys 323 (at the end of H8) are not shown.
binding site for all-trans-retinal appears to be preformed in Ops* because the presence of retinal causes only a small adjustment of side chains (Trp 2656.48, Tyr 2686.51, Met 2075.42, His 2115.46 and Glu 1223.37) while the Lys 2967.43 side chain, which is more flexible in ligand-free Ops* (ref. 6), becomes ordered due to its linkage with retinal (Supplementary Fig. 6). The Meta II–GaCT2 structure reveals a potential
hydrogen bonding network in which a water molecule links the Schiff base nitrogen with the side chains of Ser 186EL2 and Glu 181EL2, the latter hydrogen-bonded to the side chain of Tyr 2686.51 (Fig. 2 and Supplementary Fig. 7). A further water molecule constrains the main chain carbonyl of Glu 181EL2, the side chain of Ser 186EL2 and the NH-groups of Ser 186EL2 and Cys 185EL2. From Cys 185EL2 the hydrogen bonding
a
c
M86
M207 H211
E122
W265
F212
W265
K296
H211
T118
O C CA
K296 Y268
Y268
Y191
F212
CE NZ
Y191 M86
W265
A117
CD
CG
N
M207 E181
CB
C19
C20
C7
C10 C9
C15 C13 C11 C14 C12
d
M86
C1 C5
C18
C4
Ret
TM2
C17
C8 C6
Y268
b
C16
A269
C2 C3 A272
TM4
TM3 K296
W265
F212
W265
H211
E113 T94
K296
M207 E181
Y268
Y268
Y191
Y268
S186
TM6
E181
Y191 TM7
C185 EL2
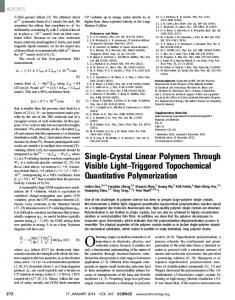
Figure 2 | Retinal binding pocket of Meta II. a, b, Retinal and neighbouring residues shown as stick model for Meta II (orange) and Meta II–GaCT2 (yellow), respectively, with 2Fo 2 Fc electron density map contoured at 1.0 s (grey mesh). View from within the membrane, right panel rotated 90u with respect to the left. Retinal is shown as blue stick model. c, Hydrophobic
interactions between all-trans-retinal and residues in the ligand binding pocket ˚ are of the opsin protein moiety. Residues with closest distances less than 4 A considered to be in van der Waals contact. d, Potential hydrogen bonding interactions around retinal in Meta II–GaCT2. Water molecules are shown as blue spheres.
6 5 2 | N AT U R E | VO L 4 7 1 | 3 1 M A R C H 2 0 1 1
©2011 Macmillan Publishers Limited. All rights reserved
LETTER RESEARCH network extends via a water molecule to the side chain of Thr 942.61. In the inactive rhodopsin conformation, a different network is found in which the Schiff base nitrogen is within hydrogen-bonding distance to the side chain of Glu 1133.28 from which the network can extend to Thr 942.61 and via Ser 186EL2 to Glu 181EL2 (refs 9, 10). Together Glu 1133.28 and Glu 181EL2 form the counterion for the protonated Schiff base in inactive rhodopsin. From Fourier transform infrared (FTIR) studies on rhodopsin activation it was predicted that the main contribution to this complex counterion changes from Glu 1133.28 to Glu 181EL2 during the transition to Meta I (ref. 12). This is also reflected in the Meta II structure. Relative to rhodopsin, the distance between the Schiff base and the side-chain carboxyl group of Glu 1133.28 increases ˚ , whereas for Glu 181EL2 the corresponding distance from 3.5 to 5.3 A ˚. decreases from 7.1 to 5.0 A The Meta II–GaCT2 structure reveals additional structural water molecules next to amino acids in conserved motifs, extending the hydrogen-bonding network from Asn 3027.49 of the NPxxY(x)5,6F motif to Glu 1343.49 of the E(D)RY motif. The lack of an interaction between Glu 1343.49 and Arg 1353.50 in Meta II–GaCT2 enables Arg 1353.50 to bind GaCT2 by forming a hydrogen bond to the backbone carbonyl oxygen of Val 347 of GaCT2. TM2 and TM7 are linked via a water molecule between Ser 2987.45 and highly conserved residues Asp 832.50 and Asn 3027.49. Structural water molecules are conserved in GPCRs13 and changes in radiolytic hydroxyl radical labelling have indicated activation-induced alterations in the local structures in which they are embedded14. Our data provide further insight into how water molecules are rearranged in the course of receptor activation (Supplementary Fig. 7). In contrast to rhodopsin8–10, but like Ops* (refs 6, 15), the Meta II structures show two openings of the retinal binding pocket (Supplementary Fig. 8). The opening between TM1 and TM7 is caused by a rotamer change of Phe 2937.40 relative to rhodopsin, which occurs in the course of a rotational rearrangement of the extracellular part of TM7 below the retinal attachment site Lys 2967.43 (Supplementary Fig. 9). The opening between TM5 and TM6 arises mainly from side-chain changes of Phe 2085.43, Phe 2125.47 and Phe 2736.56 which are also observed in the Ops* structure6. The location of retinal in its binding site fulfils most distance constraints obtained from dipolarassisted rotational resonance (DARR) NMR spectroscopy (Supplementary Table 2)16,17. A few larger distance deviations indicate that perhaps different Meta II sub-states were observed in the NMR and X-ray experiments (see Scheme 1 in the Supporting Information). Meta II shows, like Ops*, two gross conformational changes with respect to rhodopsin (Supplementary Fig. 3)6,7. Motion of TM5 towards TM6 is linked to a rearrangement of the TM3-TM5 hydrogen bonding network between Glu 1223.37, Trp 1263.41 and His 2115.46. In Meta II, the side chains of Glu 1223.37 and His 2115.46 are close enough to form a hydrogen bond (Supplementary Figs 6 and 7). The second extensive conformational change involves TM6, which undergoes a rotational tilt resulting in a motion of its cytoplasmic end away from TM3 (Figs 3 and 4). For the corresponding structural rearrangement of residues in the conserved motifs E(D)RY (in TM3) and NPxxY(x)5,6F (in TM7-H8) see the Supplementary Discussion. Unexpectedly, all-trans-retinal in the reversibly formed Meta II appears to be rotated around its long axis compared with the dark state8–10, and the early photoproducts Batho18 and Lumi19 (Fig. 3). The significant electron density observed for the methyl groups of the retinal polyene chain and b-ionone ring gives a preference for modelling retinal rotated approximately upside-down relative to Lumi (Fig. 3a) and non-satisfactory results when only the polyene chain was rotated but the b-ionone ring was kept as in Lumi (6-s-trans conformation). Retinal rotation is unlikely to occur with the packing seen in the Meta II crystal (Fig. 2c), but small TM movements in the receptor activation process, which can occur as early as in Meta I20, may well provide the necessary space. The Meta II structure does neither reflect the proposed ‘toggle switch’ rotational change of Trp 2656.48
a
W265
F212
K296
b
TM4 TM2
TM1
M207
TM3
K296
TM7
TM5
W265 TM6
F212
c TM4 TM1 TM2 H8 TM3
TM7
TM5 TM6
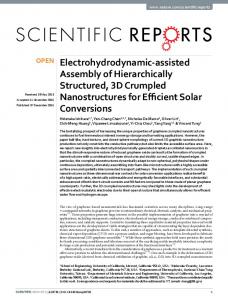
Figure 3 | Superposition of rhodopsin, Batho, Lumi and Meta II. a, View from within the membrane on superposition of retinal in rhodopsin (PDB 1U19), Batho (PDB 2G87), Lumi (PDB 2HPY) and Meta II. Amino acid side chains and retinal are shown as stick models. Protein/retinal are coloured green/red (rhodopsin), orange/blue (Meta II), purple/purple (Batho) and brown/brown (Lumi), respectively. The arrow indicates rotation of retinal from Lumi to Meta II. b, c, Superposition of rhodopsin and Meta II viewed from the cytoplasmic surface. Helices are shown as cartoon or cylinder models, retinal and amino acid side chains as stick models. For clarity, cytoplasmic ends of helices are clipped in b. Colours as in a. Elongation of retinal and interaction of the b-ionone-ring moiety with TM5/TM6 induces a rigid body-type rotational tilt of TM6 and motion of TM5 (indicated by arrows).
side chain17,21–23 nor the displacement of loop EL2 from the retinal binding site16. An explanation would be that these structural changes are transient and involved in switching to rather than maintaining the active conformation (see Supplementary Discussion and Supplementary Fig. 3). The Meta II structure also shows a positively twisted 6-s-cis conformation regarding the bond between carbon atoms C6 and C7 where retinal’s b-ionone ring and polyene chain are connected. A negatively twisted 6-s-cis conformation as in the rhodopsin dark state, Batho and Lumi, was predicted for Meta I and Meta II by NMR spectroscopy17,24–26, although flexibility of retinal even in the inactive receptor 3 1 M A R C H 2 0 1 1 | VO L 4 7 1 | N AT U R E | 6 5 3
©2011 Macmillan Publishers Limited. All rights reserved
RESEARCH LETTER c
a TM2
TM3
E134 R135
F313
Y306
E247
TM5 T251
TM7
GαCT2 peptide
Y223
E247
TM6
K231
E134 H8
T251
F313
K231
R135 Y223 TM3
b
Y306 E134
TM5 TM6
TM2
TM2
TM1
W265
TM3 R135
TM4 Y223
F313
K296 TM7
TM6
Y306
TM5
TM7
K231 E247
T251
Figure 4 | Conserved E(D)RY and NPxxY(x)5,6F regions. a, Rhodopsin and b, Meta II viewed from the cytoplasmic surface. Residues in the conserved E(D)RY and NPxxY(x)5,6F motifs in TM3 and TM7/H8, respectively, constrain rhodopsin (green) in the inactive state. A hydrogen bonded network termed ‘ionic lock’ is formed between TM3 and TM6 including Glu 1343.49, Arg 1353.50, Glu 2476.30 and Thr 2516.34. Tyr 3067.53 and Phe 3137.60 show an electrostatic interaction and are part of a functional microdomain between TM7 and H8. In Meta II and Meta II–GaCT2, the conserved residues form a different set of interactions. Glu 2476.30-Lys 2315.66-Thr 2516.34 and Tyr 2235.58-Arg 1353.50
stabilize the cytoplasmic TM5/TM6 pair. Relative to rhodopsin, TM5 is elongated and like TM6 relocated to open a central crevice in the cytoplasmic domain into which the GaCT2 peptide binds. c, Model illustrating key steps of receptor activation. Cis/trans isomerization causes elongation of retinal and clashing of the b-ionone ring between TM5 and TM6, thus inducing elongation of TM5, rotational tilt of TM6 and retinal rotation (indicated by yellow and blue arrows, respectively). Rearrangement of conserved residues (stick model) is indicated by black arrows. Meta II–GaCT2 is shown in yellow, GaCT2 in purple, and TM5–TM7 of rhodopsin in green for reference.
state may allow negatively and positively twisted 6-s-cis conformations27. An artificial pigment, in which ring rotation about the C6-C7 bond is inhibited, was reported to show lower but still substantial activity towards the G protein28. The positive C5-C6-C7-C8 dihedral angle may thus be preferred but not mandatory to form an active state. Generally, a special status of the retinal in the active Meta II form fits well to previous FTIR spectroscopic results, which have shown that photo-induced back reactions are different between active Meta II and its inactive precursors (Supplementary Discussion). The X-ray analysis of the reversibly formed Meta II has shown that the ligand fits readily into the binding pocket of Ops* and displays the same relaxed conformation as in pure retinal crystals. Ops* remains in its overall structure almost unchanged when the all-trans-retinal ligand binds, and the cytoplasmic G protein interaction domain of Ops* and Meta II carry the same insignia of an active state. On the other hand, comparison of rhodopsin and Meta II structures indicates that the retinal must go through complex elongation and torsional motions of its polyene chain and of the b-ionone ring. The motions of the ligand are likely to correspond to identified intermediates in the light induced pathway. Further structural and spectroscopic analyses may teach us how retinal analogues are less efficiently interrogated by the protein (ref. 29 and references therein), and may open insights into partial agonism and b-arrestin biased ligands at GPCRs. A more general lesson to be learned from this work on rhodopsin is that for reaching the active GPCR state, the receptor can make use of the conformational flexibility of the ligand and the variability of its interaction with the binding site.
opsin was crystallized alone or in the presence of GaCT2 peptide (NH2ILENLKDVGLF-COOH; Gat340–350(K341L,C347V)) by hanging-drop vapour diffusion in a mixture of ammonium sulphate and sodium acetate buffer at pH 5.0–5.8. Hundreds of opsin and opsin–GaCT2 crystals grown within 5 days were systematically soaked with all-trans-retinal for up to 30 h in the dark to reconstitute Meta II and Meta II–GaCT2, respectively. Crystals were cryoprotected in 10% trehalose and frozen in liquid nitrogen for screening and X-ray analysis at the synchrotron BESSY II, Berlin. The Meta II structures were solved by molecular replacement using opsin (PDB accession 3DQB) as search model. The superscript denotes N terminus (NT; for example, Asn 2NT), Helix 8 (H8; for example, Phe 313H8), extracellular loop (EL; for example, Glu 181EL2), and GPCR numbering according to Ballesteros and Weinstein30. The most conserved residue in a helix among rhodopsin-like GPCRs is designated x.50, where x is the helix number. All other residues on the same helix are numbered relative to this reference residue. Based on extensive sequence alignment, Smith grouped residues into signature-conserved, group-conserved or subfamily-specific17. Underlined superscript in GPCR numbering indicates GPCR signature residues (most conserved residues; Asn 551.50, Asp 832.50, Glu 1343.49, Arg 1353.50, Trp 1614.50, Pro 2155.50, Tyr 2235.58, Trp 2656.48, Pro 2676.50, Asn 3027.49, Pro 3037.50, Tyr 3067.53). Note that in ref. 17, based on a larger GPCR database, Leu 79 and Tyr 223 were attributed the most conserved residues on TM2 and TM5, respectively. Full Methods and any associated references are available in the online version of the paper at www.nature.com/nature. Received 9 September 2010; accepted 5 January 2011. Published online 9 March 2011. 1. 2.
METHODS SUMMARY Opsin was extracted from bovine rod outer segment disc membranes using n-octyl-b-D-glucopyranoside and n-dodecyl-b-D-maltopyranoside. Solubilized
3.
Rosenbaum, D. M., Rasmussen, S. G. & Kobilka, B. K. The structure and function of G-protein-coupled receptors. Nature 459, 356–363 (2009). Palczewski, K. G protein-coupled receptor rhodopsin. Annu. Rev. Biochem. 75, 743–767 (2006). Altenbach, C., Kusnetzow, A. K., Ernst, O. P., Hofmann, K. P. & Hubbell, W. L. Highresolution distance mapping in rhodopsin reveals the pattern of helix movement due to activation. Proc. Natl Acad. Sci. USA 105, 7439–7444 (2008).
6 5 4 | N AT U R E | VO L 4 7 1 | 3 1 M A R C H 2 0 1 1
©2011 Macmillan Publishers Limited. All rights reserved
LETTER RESEARCH 4. 5. 6. 7. 8. 9. 10. 11. 12. 13. 14. 15. 16. 17. 18. 19. 20. 21. 22. 23. 24. 25.
Hofmann, K. P. et al. A G protein-coupled receptor at work: the rhodopsin model. Trends Biochem. Sci. 34, 540–552 (2009). Choe, H.-W., Park, J. H., Kim, Y. J. & Ernst, O. P. Transmembrane signaling by GPCRs: insight from rhodopsin and opsin structures. Neuropharmacology 60, 52–57 (2011). Park, J. H., Scheerer, P., Hofmann, K. P., Choe, H.-W. & Ernst, O. P. Crystal structure of the ligand-free G-protein-coupled receptor opsin. Nature 454, 183–187 (2008). Scheerer, P. et al. Crystal structure of opsin in its G-protein-interacting conformation. Nature 455, 497–502 (2008). Palczewski, K. et al. Crystal structure of rhodopsin: a G protein-coupled receptor. Science 289, 739–745 (2000). Okada, T. et al. The retinal conformation and its environment in rhodopsin in light of a new 2.2 A˚ crystal structure. J. Mol. Biol. 342, 571–583 (2004). Li, J., Edwards, P. C., Burghammer, M., Villa, C. & Schertler, G. F. Structure of bovine rhodopsin in a trigonal crystal form. J. Mol. Biol. 343, 1409–1438 (2004). Siebert, F. Application of FTIR spectroscopy to the investigation of dark structures and photoreactions of visual pigments. Isr. J. Chem. 35, 309–323 (1995). Lu¨deke, S. et al. The role of Glu181 in the photoactivation of rhodopsin. J. Mol. Biol. 353, 345–356 (2005). Angel, T. E., Chance, M. R. & Palczewski, K. Conserved waters mediate structural and functional activation of family A (rhodopsin-like) G protein-coupled receptors. Proc. Natl Acad. Sci. USA 106, 8555–8560 (2009). Angel, T. E., Gupta, S., Jastrzebska, B., Palczewski, K. & Chance, M. R. Structural waters define a functional channel mediating activation of the GPCR, rhodopsin. Proc. Natl Acad. Sci. USA 106, 14367–14372 (2009). Hildebrand, P. W. et al. A ligand channel through the G protein coupled receptor opsin. PLoS ONE 4, e4382 (2009). Ahuja, S. et al. Helix movement is coupled to displacement of the second extracellular loop in rhodopsin activation. Nature Struct. Mol. Biol. 16, 168–175 (2009). Smith, S. O. Structure and activation of the visual pigment rhodopsin. Annu. Rev. Biophys. 39, 309–328 (2010). Nakamichi, H. & Okada, T. Crystallographic analysis of primary visual photochemistry. Angew. Chem. Int. Edn Engl. 45, 4270–4273 (2006). Nakamichi, H. & Okada, T. Local peptide movement in the photoreaction intermediate of rhodopsin. Proc. Natl Acad. Sci. USA 103, 12729–12734 (2006). Ye, S. et al. Tracking G-protein-coupled receptor activation using genetically encoded infrared probes. Nature 464, 1386–1389 (2010). Shi, L. et al. b2 adrenergic receptor activation. Modulation of the proline kink in transmembrane 6 by a rotamer toggle switch. J. Biol. Chem. 277, 40989–40996 (2002). Crocker, E. et al. Location of Trp265 in metarhodopsin II: implications for the activation mechanism of the visual receptor rhodopsin. J. Mol. Biol. 357, 163–172 (2006). Nygaard, R., Frimurer, T. M., Holst, B., Rosenkilde, M. M. & Schwartz, T. W. Ligand binding and micro-switches in 7TM receptor structures. Trends Pharmacol. Sci. 30, 249–259 (2009). Salgado, G. F. et al. Solid-state 2H NMR structure of retinal in metarhodopsin I. J. Am. Chem. Soc. 128, 11067–11071 (2006). Ahuja, S. et al. 6-s-cis conformation and polar binding pocket of the retinal chromophore in the photoactivated state of rhodopsin. J. Am. Chem. Soc. 131, 15160–15169 (2009).
26. Brown, M. F., Salgado, G. F. & Struts, A. V. Retinal dynamics during light activation of rhodopsin revealed by solid-state NMR spectroscopy. Biochim. Biophys. Acta 1798, 177–193 (2010). 27. Lau, P. W., Grossfield, A., Feller, S. E., Pitman, M. C. & Brown, M. F. Dynamic structure of retinylidene ligand of rhodopsin probed by molecular simulations. J. Mol. Biol. 372, 906–917 (2007). 28. Fujimoto, Y. et al. On the bioactive conformation of the rhodopsin chromophore: absolute sense of twist around the 6-s-cis bond. Chem. Eur. J. 7, 4198–4204 (2001). 29. Knierim, B., Hofmann, K. P., Gartner, W., Hubbell, W. L. & Ernst, O. P. Rhodopsin and 9-demethyl-retinal analog: effect of a partial agonist on displacement of transmembrane helix 6 in class A G protein-coupled receptors. J. Biol. Chem. 283, 4967–4974 (2008). 30. Ballesteros, J. A. & Weinstein, H. Integrated methods for the construction of threedimensional models and computational probing of structure-function relations in G-protein coupled receptors. Methods Neurosci. 25, 366–428 (1995). Supplementary Information is linked to the online version of the paper at www.nature.com/nature. Acknowledgements We thank J. Engelmann, C. Koch and B. Bauer for technical assistance, and F. Siebert and W. Hubbell for critically reading the manuscript. We are grateful to the European Synchrotron Radiation Facility (ESRF, Grenoble), D. von Stetten and A. Royant of the ID29S-Cryobench (ESRF, Grenoble) and U. Mu¨ller and the scientific staff of the BESSY-MX/Helmholtz Zentrum Berlin fu¨r Materialien und Energie at beamlines BL 14.1 and BL 14.2, where the data were collected, for continuous support. This work was supported by the DFG Sfb449 (to O.P.E.), Sfb740 (to O.P.E. and K.P.H.) and an Advanced Investigator ERC grant (to K.P.H.) and by the Canada Research Chairs Program (to E.F.P.). H.-W.C. gratefully acknowledges the Basic Science Research Program through the National Research Foundation of Korea (NRF) funded by the Ministry of Education, Science and Technology (2010-0002738) and CBNU funds for overseas research 2009. Y.J.K. thanks the Leibniz Graduate School of Molecular Biophysics, Berlin, for a scholarship. Author Contributions H.-W.C., Y.J.K. and J.H.P. are joint first authors. H.-W.C., Y.J.K., J.H.P. performed preparation and crystallization of opsin/opsin2GaCT2. H.-W.C. performed the soaking experiment of both crystals. O.P.E. designed GaCT2. H.-W.C., Y.J.K., J.H.P., P.S., O.P.E. performed the data collection. Y.J.K., P.S., N.K. performed the structural analysis of Meta II, and J.H.P., P.S., E.F.P. performed the structural analysis of Meta IIN GaCT2. T.M. performed the spectroscopic and biochemical analysis. H.-W.C., N.K., K.P.H., P.S., O.P.E. analysed data and H.-W.C., K.P.H., O.P.E. wrote the paper with contributions from all authors. Author Information Atomic coordinates and structure factors for the reported structure have been deposited in the Protein Data Bank with the accession codes 3PQR and 3PXO. Reprints and permissions information is available at www.nature.com/ reprints. The authors declare no competing financial interests. Readers are welcome to comment on the online version of this article at www.nature.com/nature. Correspondence and requests for materials should be addressed to H.-W.C. (
[email protected]), K.P.H. (
[email protected]) or O.P.E. (
[email protected]).
3 1 M A R C H 2 0 1 1 | VO L 4 7 1 | N AT U R E | 6 5 5
©2011 Macmillan Publishers Limited. All rights reserved
RESEARCH LETTER METHODS Crystallization. Opsin was prepared and crystallized by hanging drop vapour diffusion at 277 K essentially as described6,7. The solubilization buffer contained a mixture of 1% n-octyl-b-D-glucopyranoside and 0.02% n-dodecyl-b-Dmaltopyranoside or n-octyl-b-D-glucopyranoside alone. The precipitant solution was 3.0–3.4 M (NH4)2SO4 in 0.1 M sodium acetate buffer (pH 5.0–5.8). A synthetic peptide was used for co-crystallization of opsin with a C-terminal fragment derived from the a-subunit of the G protein transducin. The peptide GaCT2 (sequence NH2-ILENLKDVGLF-COOH) is a derivative of the high-affinity GaCT peptide31 and has a similar affinity. Crystals appeared within 2 days and grew further for 3 days to reach dimensions 0.2 mm 3 0.3 mm 3 0.3 mm. Alltrans-retinal was purchased from Sigma and further purified by normal phase HPLC using a LiChrosorb Si 60 (5 mm) 300 mm 3 20 mm column with 5% diethylether in heptane. Opsin crystals were soaked in the dark with all-transretinal for up to 30 h to reconstitute Meta II. Crystals were then transferred under orange light to cryoprotectant consisting of 10% trehalose in crystallization buffer and immediately frozen in liquid nitrogen. Structure analysis. Diffraction data collection was performed at 100 K using synchrotron X-ray sources at BESSY II, Berlin, Germany, and ESRF, Grenoble, France. Best diffraction data were collected at beamline BL 14.2 at BESSY II, at ˚ . The crystal to MX-225 CCD detector distance was fixed at 230 mm l 5 0.91842 A for Meta II and 260 mm for Meta II–GaCT2, respectively. The rotation increment for each frame was 0.5u with an exposure time of 6 s (Meta II) or 12 s (Meta II– GaCT2). All images were indexed, integrated and scaled using the XDS program package32 and CCP4 program SCALA33. Meta II and Meta II–GaCT2 crystals ˚ , b 5 241.82 A ˚, belong to rhombohedral space group H32 (a 5 241.82 A ˚ , a 5 b 5 90u, c 5 120u and a 5 241.55 A ˚ , b 5 241.55 A ˚, c 5 111.80 A ˚ , a 5 b 5 90u, c 5 120u, respectively). Supplementary Table 1 sumc 5 109.87 A marizes the statistics for crystallographic data collection and structural refinement. Initial phases for Meta II and Meta II–GaCT2 were obtained by conventional molecular replacement protocol (rotation, translation, rigid body fitting) using opsin from the opsin–GaCT structure (PDB accession 3DQB) as initial search model. Molecular replacement was achieved using the CCP4 program PHASER33 by first placing the opsin monomer (rotation function (RFZ): Z 5 14.5; translation function (TFZ): Z 5 53.2 for Meta II and rotation function (RFZ): Z 5 11.7; translation function (TFZ): Z 5 63.5 for Meta II–GaCT2, respectively; RFZ and TFZ as defined by PHASER). In subsequent steps, torsion angle molecular dynamics, simulated annealing using a slow-cooling protocol and a maximum likelihood target function, energy minimization, and B-factor refinement by the program ˚ (Meta II) and 34.9– CNS34 were carried out in the resolution range 33.5–3.0 A ˚ (Meta II–GaCT2). After the first round of refinement, the retinal chromo2.85 A phore was clearly visible in the electron density of both sA-weighted 2Fo 2 Fc maps, as well as in the sA-weighted simulated annealing omit density maps (Supplementary Fig. 4). Restrained, individual B-factors were refined and the crystal structure was finalized by the CCP4 program REFMAC5 and CCP4 (ref. 33). The final models have agreement factors Rfree and Rcryst of 24.5% and 21.6% (Meta II), and 25.0% and 21.7% (Meta II–GaCT2), respectively. Manual rebuilding of the Meta II models and electron density interpretation were performed after each refinement cycle using the program COOT35. Structure validation was performed with the programs PROCHECK36 and WHAT_CHECK37. Potential hydrogen bonds and van der Waals contacts were analysed using the programs HBPLUS38 and LIGPLOT39. All crystal structure superpositions of backbone alpha
carbon traces were performed using CCP4 program LSQKAB33. All molecular graphics representations were created using PyMol40. Ultraviolet-visible spectroscopy. Ultraviolet-visible spectroscopy of Meta II was performed using a NanoDrop 1000 Spectrophotometer (Thermo Scientific) at room temperature and a CARY 50 Ultraviolet-visible Spectrophotometer (Varian) at 20 uC. Meta II crystals were washed thoroughly three times in crystallization buffer to reduce excess all-trans-retinal and were measured immediately in the same buffer. In some cases, Meta II crystals were dissolved in 1% n-octyl-b-Dglucopyranoside. Spectra were obtained before and after acid denaturation by addition of 1/10 volume 100 mM sulphuric acid. Transducin activation assay. As a monitor for Gt activation, changes in intrinsic fluorescence intensity of the Ga-subunit upon exchange of GDP to GTPcS were quantified41–43. All measurements were carried out using a SPEX fluorolog II spectrofluorometer equipped with a 450 W xenon arc lamp. For all activation measurements, settings were lex 5 300 nm and lem 5 345 nm with an integration time of 1 s. Gt activation rates were measured with 2.5 nM opsin, 6 mM GTPcS, 2 mM DTT, and 0.006% (w/v) n-dodecyl-b-D-maltopyranoside in a final volume of 650 ml (10 mm 3 4 mm cuvette with stirring bar). All samples were equilibrated at 20 uC for 4 min while being irradiated with yellow light (Schott GG 495 longpass filter). Then reactions were triggered by addition of GTPcS after recording basic fluorescence levels for 50 s. After recording the fluorescence change at the initial opsin concentration, activation of the whole Gt pool was achieved by adding 10 nM purified rhodopsin to the reaction. The concentration of intact opsin in every sample was calculated from the quantity of reconstituted rhodopsin by 500 nm absorption after addition of excess 11-cis-retinal to an aliquot of the sample measured. The 500 nm rhodopsin absorption was determined from difference spectra dark minus light-activated rhodopsin. 31. Herrmann, R. et al. Sequence of interactions in receptor-G protein coupling. J. Biol. Chem. 279, 24283–24290 (2004). 32. Kabsch, W. XDS. Acta Crystallogr. D 66, 125–132 (2010). 33. Collaborative Computational Project, Number 4. The CCP4 suite: programs for protein crystallography. Acta Crystallogr. D 50, 760–763 (1994). 34. Bru¨nger, A. T. et al. Crystallography & NMR system: a new software suite for macromolecular structure determination. Acta Crystallogr. D 54, 905–921 (1998). 35. Emsley, P. & Cowtan, K. Coot: model-building tools for molecular graphics. Acta Crystallogr. D 60, 2126–2132 (2004). 36. Laskowski, R. A., MacArthur, M. W., Moss, D. S. & Thornton, J. M. PROCHECK: A program to check the stereochemical quality of protein structures. J. Appl. Cryst. 26, 283–291 (1993). 37. Hooft, R. W., Vriend, G., Sander, C. & Abola, E. E. Errors in protein structures. Nature 381, 272 (1996). 38. McDonald, I. K. & Thornton, J. M. Satisfying hydrogen bonding potential in proteins. J. Mol. Biol. 238, 777–793 (1994). 39. Wallace, A. C., Laskowski, R. A. & Thornton, J. M. LIGPLOT: A program to generate schematic diagrams of protein-ligand interactions. Protein Eng. 8, 127–134 (1995). 40. DeLano, W. L. The PyMOL Molecular Graphics System. (DeLano Scientific, San Carlos, California, USA, 2002). 41. Fahmy, K. & Sakmar, T. P. Regulation of the rhodopsin-transducin interaction by a highly conserved carboxylic acid group. Biochemistry 32, 7229–7236 (1993). 42. Ernst, O. P., Bieri, C., Vogel, H. & Hofmann, K. P. Intrinsic biophysical monitors of transducin activation: fluorescence, UV-visible spectroscopy, light scattering, and evanescent field techniques. Methods Enzymol. 315, 471–489 (2000). 43. Ernst, O. P., Gramse, V., Kolbe, M., Hofmann, K. P. & Heck, M. Monomeric G proteincoupled receptor rhodopsin in solution activates its G protein transducin at the diffusion limit. Proc. Natl Acad. Sci. USA 104, 10859–10864 (2007).
©2011 Macmillan Publishers Limited. All rights reserved