ABSTRACT: Soil, taken from lake bottom and river bed, the selective sources of top soil construction in land reclamation, need to be improved with their ...
Does biochar promote reclaimed soil qualities Zhen Cai, Maqbool Ahsan, Hui Wang* & Zhengfu Bian
School of Environment Science and Spatial Informaics, China University of Mining and Technology, Xuzhou, 221116, China
Tao Zheng
Institute of Soil Science, Chinese Academy of Science, Nanjing, 210008, China
ABSTRACT: Soil, taken from lake bottom and river bed, the selective sources of top soil construction in land reclamation, need to be improved with their properties in general. Biochar can be used to improve some soil quality. In this research, produced five different kinds of straw biochar at corresponding pyrolysis temperatures respectively and used 3 added levels into 2 kinds of soil followed seeding ryegrass to check alteration of soil quality. After the application of biochar, it decreases soil chroma with 1-3 units in sandy soil and 1-4 units in clay soil. Electrical conductivity (EC) of soil is increased significantly and pH of soil is moderated after 30 days plantation of ryegrass. In the addition of biochar, MSA increases significantly but doesn’t change WSA significantly. Furthermore, ryegrass planted soils was promoted significantly in height . It conclude that the production of different types biochars must be relating to enhancement of soil properties through specific pyrolysis conditions and soil types. KEYWORDS: Straw biochar; Soil properties; Soil quality; Ryegrass
1 INTRODUCTION
Biochar is a charcoal made of raw materials from thermal cracking of plants or waste residues (Suliman et al., 2016). It has the following characteristics: fine particle, rich carbon (Woolf et al., 2010) and difficult to be degraded. Incorporation of biochar into soil may have a significant effect on soil’s physical and chemical properties. From the related studies, biochar is featured not only with large pore size, but also with more porosities and specific surface areas. Therefore, if it is added to the sandy soil (Case et al., 2012), it can significantly reduce the soil’s bulk density, and increase soil’s porosity, thereby enhancing water capacity of soil (Dugan et al., 2010), and improving soil’s physical properties. Partial biochar could improve the pH value, EC value and nutrient level of soil (Abujabhah et al., 2016). These characteristics of biochar microbial population distribution also played a certain degree of regulation (Grossman et al., 2010). Biochar can promote crop growth by changing the physical and chemical properties of the soil. With stable structure, biochar can improve the performance of carbon negative soil via absorbing the carbon dioxide in the atmosphere and then transferring carbon into highly resistant soil (Case et al., 2012; Troy et al., 2013; Xie et al., 2010). The emergence of biochar is a promising solution to the current ecological problems, and a positive catalyst for agricultural development (Atkinson et al., 2012). However, a large number of studies have shown that biochar cannot produce a positive effect on the improvement of soil properties. For example, its effect on water binding capacity of loam and clay is not obvious. The surface area of biochar prepared at high temperature is large, but they have less surface charges, and the ability to keep nutrient ions is not strong (Rehrah et al., 2014). The biochars under different treatment can produce different effects on organic carbon contained in the soil (Abujabhah et al., 2016). This paper studied straw biochar under different temperatures with the treatment of mixing different amounts of reconstructed plough horizon soil for understanding the biochar’s role in improving the quality of reconstructed soil (Major et al., 2010), and exploring the possibility of using biochar for reconstructing high-quality soil. 2 MATERIALS AND METHODS 2.1 Experiment materials
In this experiment, 5 kinds of biochar: C3, C4, C5, C6 and C7 were used. The raw materials used in this experiment were tobacco farm, and 19 winter wheat straws under different temperatures (Demirbas, 2004; Ahmad et al., 2012; Domene et al., 2015): 300°C, 400°C, 500°C, 600°C and 700°C. It took 30
minutes to reach the targeted temperature, and the temperature was kept stable for 2 hours in the muffle furnace and then was cooled down to room temperature (Atkinson et al., 2014). Two kinds of soil textures from the Xuzhou City Peixian section of the Yellow River terraces and Xuzhou City Peixian Datun mining area for coal mining subsidence were filled in Reclamation of Lake Weishan Lake Sediment (They are the main sources of Xuzhou: remediated and reconstructed soils). The annual ryegrass was used in the experiment. 2.2 Experimental method
Soil was grinded through 1mm sieve. Set 0.5%, 1% and 2% (mass ratio of carbon to soil) as three kinds of biochar addition levels. Two control groups (CK), a total of 32 treatment, and 3 replicates were made for each treatment, with a total number of 96 samples. Soil’s pH was measured via a pH of 2.5: 1 soil solution and then a pH meter (pHS3E, Shanghai Youke). The electrical conductivity (EC) value of the soil solution’s conductivity was determined by setting the soil solution with soil-to-water ratio of 5: 1 and then by using the conductivity meter (SX713 type, Shanghai Sanxin Instrument Factory). The soil color was first qualitatively observed and then the color was graded via the Munsell color card. The soil aggregates were determined by dry sieve method and wet sieve method. The biomass of perennial ryegrass with electronic scales weight (0.01 g) was weighed to measure Fresh weight. 3 RESULTS AND DISCUSSION 3.1 Effects of biochar on soil’s pH value
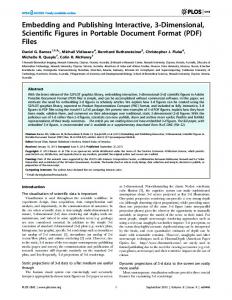
The pH value of biochar is related to prepared materials and corresponding conditions. The biochar prepared by wheat straw is generally alkaline and its alkalinity increases with the increase of temperature (Rehrah et al., 2014). In this experiment, the pH of prepared wheat straw biochar are 7.2, 8.1, 10.2, 10.5 and10.3 respectively.
9.0
Sand
CK a/a/a A abA
A
A
1% 2%
8.5
bcB cB bB
bBC
bC bC
bB
8.0
pH
0.5%
A
A
cB bC
bB
cB
bB
bBC bC
7.5
7.0
6.5
6.0 C3
C4
C5
C6
thermal cracking time. In this experiment, biochar prepared from wheat straws at five different temperatures with different EC values of 820us/cm, 1055 us/cm, 1530 us/cm, 1685 us/cm and 1595 us/cm. Figure 3 and Figure 4 show the effects of biochar on the EC values of sand and lake mud. Throughout the above analysis, it can be observed that the application of biochar can significantly improve the EC value of the test soils, mainly because the biochar EC value is much higher than that of test soil, and with the increase of carbon deposition, this effect is more and more obvious.
C7 800
Sand
dD cD
400
bD
cC
cC
bC
bC
bC
dB dB
300
8.5
200
cB bcB
a/a/a A
A
A
A
A
C3
C4
C5
C6
C7
CK 0.5%
a/a/a A abA
8.0
cD
500
bB
Lake mud
CK 0.5% 1% 2%
eD
600
EC(μs/cm)
Figure 1. The effect of biochar on sand’s pH. In this figure, different lowercase letters represent the significant level achieved by the difference between the different types of carbon treatment with the same carbon content (P0.25mm,%)
60
40
4
0 C4
C5
C6
C7
C3
C4
C5
C6
C7
100 2
PAD(>0.25mm,%)
WSA(>0.25mm,%)
20
Lake mud
3
1
0 C7
30
120
20
C6
Lake mud(water stable)
0 C3
C5
grey-brown
10
20
Sand(water stable)
Very deep
40
80
60
C4
50
Lake mud(mechanical stable)
100
5
0
Deep
4
4
40
yellow-brown Brown
10YR
10YR
Sand(mechanical stable)
light
C4
C4
80
yellow-brown
yellow-brown Deep grey-brown
tes of sand and lake mud, and calculated their agglomeration failure rate PAD, and the results are shown in Figure 7 and Figure 8.
WSA(>0.25mm,%)
color
C5
120
C3
tone brightness chroma
WSA(>0.25mm,%)
2%
content Spices
very light brown LCK
0.50%
1%
carbon Carbon
C3
C4
C5
C6
80
60
40
CK 0.5% 1% 2%
C7
120
20
Sand 100
PAD(>0.25mm,%)
0 C3
80
C4
C5
C6
C7
60
40
CK 0.5% 1% 2%
20
Figure 8. The WSA (>0.25mm) and PAD (>0.25mm) of lake mud.
0 C3
C4
C5
C6
C7
Figure 7. The WSA (>0.25mm) and PAD (>0.25mm) of sand.
The increase of soil aggregates (>0.25mm) and its stability are important indexes of soil structural
6
Lake mud
CK 0.5% 1% 2%
bA
a/a/a A
5
A
A
cC
A
aA acA
A
cB
bB bB bD
cB
4 eC
MWD(mm)
improvement. Therefore, related studies reported the non-water stability and water stability large aggregates of sand and lake mud, and calculated their agglomeration failure rate PAD, and the results are shown in Figure 7 and Figure 8. The effects of biochar on non-water stable aggregates MWD and GMD are shown in Figure 9 and Figure 10.
dD
3 dB
2 dC
eB
dB
2.5
Sand
dB
1
CK 0.5% 1% 2%
2.0
0 C3
MWD(mm)
dC
C4
C5
C6
C7
dC eB
1.5 bB
1.0
Figure 11. The MWD of lake mud mechanical stable aggregates.
bB
bBC
cB bC
bdD
bcB cC
a/a/a A
A
A
aA
A
aA
A
5
cC
Lake mud
.5
CK
bB
0.5% 1%
a/a/a A
4
aA
A
A
aA
aA
bAC
2%
A
A aA
bC
0.0
cB
C4
C5
C6
C7
Figure 9. The MWD of sand mechanical stable aggregates.
GMD(mm)
C3
Compared with MWD and GMD, the effect of biochar on promoting growth of MWD and GMD was not very strong and even negative. The results are shown in Figure 11 and Figure 12.
cC
3
eC dC
2
1 dB
0 C3
.8
Sand
dB
dC
dB
CK 0.5% 1% 2%
GMD(mm)
.6
bB
cB
bB bB bcB
cC
bC
C4
C5
C6
C7
Figure 12. The GMD of lake mud mechanical stable aggregates.
The effect of biochar on the stability of sandy soil and lake water stabilizer MWD and GMD is shown in Figure 13.
eB
.4
cB
dB cB
bD
bC cA
a/a/a A
acA
A
A
.25
A
A
.5
Sand
CK 0.5% 1% 2%
.20
Lake mud
CK 0.5% 1%
.4
2%
0.0 C3
C4
C5
C6
.15
MWD(mm)
MWD(mm)
.2
.10
.3
.2
.05
.1
0.00
0.0
C7 C3 .16
C4
C5
C6
C7 CK 0.5%
.14
Figure 10. The GMD of sand mechanical stable aggregates.
C3 .30
Sand
C4
C5
C6
C7
Lake mud
CK 0.5% 1%
1%
.25
2%
2%
.12
GMD(mm)
GMD(mm)
.20 .10 .08 .06
.15
.10
.04 .05 .02 0.00
0.00 C3
C4
C5
C6
C7
C3
C4
C5
C6
C7
Figure 13. The MWD and GMD of soil water stable aggregates
3.5 Effects of biochar on fresh weight of ryegrass
Fig. 14 and Fig. 15 respectively present the effects of biochar’s fresh weight of ryegrass on sand and lime. The effects of carbon species and carbon content on the fresh weight of ryegrass were not significantly different between the two soils. As the experiment revealed, the initial application of biochar could inhibit the seed’s germination (Denyes et al., 2012). .5 aA
Sand
CK 0.5% 1% 2%
aA
aA
.4
Ryegrass weight(g)
aB
aA
aA abA
aA
.3
ab/a/a A abA
aA
aA
aAB AB
A
A
A aA
aA
.2
bA
.1
0.0 C3
C4
C5
C6
C7
Figure 14. The effects of biochar’s Ryegrass weight of sand. .6
Lake mud
aA
CK 0.5% 1% 2%
aA
aA
.5
bcA
Ryegrass weight(g)
cA
.4
aAB
ab/a/a A
A aA aA
AB
abcA
A
aA
aA
aA
A
aA
.3
aA
aB
.2
is the most obvious). Biochar will reduce the pH of alkaline soils in the case of plant growth, but there is no explanation for this abnormal result. The only possible explanation is that the presence of biochar promotes the secretion of acidic substances in plant roots, and further tests are necessary. The significantly increased number of non-water stability aggregates , the form of non-water stability aggregates mainly associated with clay in the soil, the sand itself contain little of clay, after the application of biochar, the clay in the sand is increased, so the number of non-water stability aggregates are increased, and presents no significant effect on green weight of ryegrass. Biochar has a significant effect on soil’s electric conductivity (EC) to some degree, which can be inferred from the results of the study: (1) Due to biochar itself, the effect of biochar on soil may not be possibly from other substances that are mixed with biochar. A large number of studies show that biochar has high pH value and EC value with the increase of temperature. In this regard, oxygen is also one important factor during the producing process. (2) Biochar’s structure is stable, and it is difficult to be degraded. It can improve the soil’s carbon content, but cannot effectively improve soil’s organic content. It must be applied with organic matters, otherwise it cannot play a key role in forming soil’s structure. (3) Pure biochar is carbon skeleton with a stable porous structure. The mechanism of improving soil’s physical and chemical properties is via increasing its surface area and surface groups to cement, and furthermore to promote the formation of soil’s structure, so as to further improve the biological environment and ultimately the soil quality.
.1
0.0 C3
C4
C5
C6
C7
Figure 15. The effects of biochar’s Ryegrass weight of lake mud.
4 CONCLUSION
From the experimental results, the application of biochar can effectively change soil’s color, pH value, EC value, aggregate and improve plant growth, but the degree of influence and the direction of influence are different. Because of its own color, the effect of biochar can significantly downgrade the soil’s color, which reduces the sandy light by 1 to 3 units, and the lacustrine clarity by 1-4 units. And both the preparation temperature and the content are high (at high temperature (C6, C7) high carbon content (2%)
ACKNOWLEDGEMENTS This research was supported by the National Key Research Development Plan Program during the 13th Five-Year Plan Period (2016YF0501100) and the Key Technologies of Land Consolidation in Large-scale Coal Base (2016YF0501105).The authors are grateful for this financial support. REFERENCES Abujabhah, I.S., Bound, S.A, Doyle, R. & Bowman, J.P. (2016) Effects of biochar and compost amendments on soil physico-chemical properties and the total community within a temperate agricultural soil. Applied Soil Ecology, 98, 243-253. Ahmad, M., Lee, S.S., Dou, X., Mohan, D., Sung, J.K., Yang, J.E. & Ok, Y.S. (2012) Effects of pyrolysis temperature on soybean stover-and peanut shell-derived biochar properties
and TCE adsorption in water. Bioresource Technology, 118, 536-544. Atkinson, C.J., Fitzgerald, J.D. & Hipps, N.A. (2010) Potential mechanisms for achieving agricultural benefits from biochar application to temperate soils: a review. Plant and Soil, 337(1-2), 1-18. Brodowski, S., John, B., Flessa, H. & Amelung, W. (2006) Aggregate-occluded black carbon in soil. European Journal of Soil Science, 57, 539-546. Case, S.D., McNamara, N.P., Reay, D.S. & Whitaker, J. (2012) The effect of biochar addition on N2O and CO2 emissions from a sandy loam soil–the role of soil aeration. Soil Biology and Biochemistry, 51, 125-134. Deenik, J.L., McClellan, T., Uehara, G., Antal, M.J. & Campbell, S. (2010) Charcoal volatile matter content influences plant growth and soil nitrogen transformations. Soil Science Society of America Journal, 74(4),1259-1270. Demirbas, A. (2004) Effects of temperature and particle size on bio-char yield from pyrolysis of agricultural residues. Journal of Analytical and Applied Pyrolysis, 72(2), 243248. Denyes, M.J., Langlois, V.S., Rutter, A. & Zeeb, B.A. (2012) The use of biochar to reduce soil PCB bioavailability to Cucurbita pepo and Eisenia fetida. Science of the Total Environment, 437, 76-82. Domene, X., Enders, A., Hanley, K. & Lehmann, J. (2015) Ecotoxicological characterization of biochars: role of feedstock and pyrolysis temperature. Science of the Total Environment, 512: 552-561. Dugan, E., Verhoef, A., Robinson, S., & Sohi, S. (2010, August). Bio-char from sawdust, maize stover and charcoal: Impact on water holding capacities (WHC) of three soils from Ghana. In 19th World Congress of Soil Science, Symposium, 4(2), pp. 9-12. Grossman, J.M., O’Neill, B.E., Tsai, S.M., Liang, B., Neves, E., Lehmann, J. & Thies, J.E. (2010) Amazonian anthrosols support similar microbial communities that differ distinctly from those extant in adjacent, unmodified soils of the same mineralogy. Microbial Ecology, 60(1), 192-205. Major, J., Rondon, M., Molina, D., Riha, S. J. & Lehmann, J. (2010) Maize yield and nutrition during 4 years after biochar application to a Colombian savanna oxisol. Plant and Soil, 333(1-2), 117-128. Morales, M.M., Comerford, N., Guerrini, I.A., Falcão, N.P.S. & Reeves, J.B. (2013) Sorption and desorption of phosphate on biochar and biochar–soil mixtures. Soil Use and Management, 29(3), 306-314. Oguntunde, P.G., Fosu, M., Ajayi, A.E. & Van De Giesen, N. (2004) Effects of charcoal production on maize yield, chemical properties and texture of soil. Biology and Fertility of Soils, 39(4), 295-299. Rehrah, D., Reddy, M.R., Novak, J.M., Banslde R.R., Schimmel, K.A., Yu, J., Watts, D.W. & Ahmedna, M. (2014) Production and characterization of biochars from agricultural by-products for use in soil quality enhancement. Journal of Analytical and Applied Pyrolysis, 108, 301-309. Suliman, W., Harsh, J.B., Abu-Lail, N.I., Fortuna, A.M., Dallmeyer, I. & Garcia-Perez, M. (2016) Influence of feedstock source and pyrolysis temperature on biochar bulk and surface properties. Biomass and Bioenergy, 84, 37-48. Sun, F. & Lu, S. (2014) Biochars improve aggregate stability, water retention, and pore‐space properties of clayey soil. Journal of Plant Nutrition and Soil Science, 177(1), 26-33. Troy, S.M., Lawlor, P.G., O'Flynn, C.J. & Healy, M.G. (2013) Impact of biochar addition to soil on greenhouse gas emissions following pig manure application. Soil Biology and Biochemistry, 60, 173-181. Wondafrash, T.T., Sancho, I.M., Miguel, V.G. & Serrano, R.E. (2005) Relationship between soil color and temperature in
the surface horizon of Mediterranean soils: A laboratory study. Soil Science, 170(7), 495-503. Woolf, D., Amonette, J.E., Street-Perrott, F.A., Lehmann, J. & Joseph, S. (2010) Sustainable biochar to mitigate global climate change. Nature communications, 56. Xie, Z.B., Liu, G., Bei, Q.C, Tang, H.Y., Liu, J.S., Sun, H.F., Xu, Y.P., Zhu, J.G. & Cadisch, G. (2010) CO2 mitigation potential in farmland of China by altering current organic matter amendment pattern. Science China Earth Sciences, 53(9), 1351-1357.