Major Professor: Dr. Thomas H. Morris. Title of Study: Cybersecurity testing and intrusion detection for cyber-physical power systems. Pages in Study: 148.
Automated Template C: Created by James Nail 2013V2.1
Cybersecurity testing and intrusion detection for cyber-physical power systems
By Shengyi Pan
A Dissertation Submitted to the Faculty of Mississippi State University in Partial Fulfillment of the Requirements for the Degree of Doctor of Philosophy in Electrical and Computer Engineering in the Department of Electrical and Computer Engineering Mississippi State, Mississippi December 2014
UMI Number: 3665497
All rights reserved INFORMATION TO ALL USERS The quality of this reproduction is dependent upon the quality of the copy submitted. In the unlikely event that the author did not send a complete manuscript and there are missing pages, these will be noted. Also, if material had to be removed, a note will indicate the deletion.
UMI 3665497 Published by ProQuest LLC (2014). Copyright in the Dissertation held by the Author. Microform Edition © ProQuest LLC. All rights reserved. This work is protected against unauthorized copying under Title 17, United States Code
ProQuest LLC. 789 East Eisenhower Parkway P.O. Box 1346 Ann Arbor, MI 48106 - 1346
Copyright by Shengyi Pan 2014
Cybersecurity testing and intrusion detection for cyber-physical power systems By Shengyi Pan Approved: ____________________________________ Thomas H. Morris (Major Professor) ____________________________________ David A. Dampier (Committee Member) ____________________________________ Bryan A. Jones (Committee Member) ____________________________________ Yong Fu (Committee Member) ____________________________________ James Fowler (Graduate Coordinator) ____________________________________ Jason Keith Interim Dean Bagley College of Engineering
Name: Shengyi Pan Date of Degree: December 13, 2014 Institution: Mississippi State University Major Field: Electrical and Computer Engineering Major Professor: Dr. Thomas H. Morris Title of Study:
Cybersecurity testing and intrusion detection for cyber-physical power systems
Pages in Study: 148 Candidate for Degree of Doctor of Philosophy Power systems will increasingly rely on synchrophasor systems for reliable and high-performance wide area monitoring and control (WAMC). Synchrophasor systems greatly use information communication technologies (ICT) for data exchange which are vulnerable to cyber-attacks. Prior to installation of a synchrophasor system a set of cyber security requirements must be developed and new devices must undergo vulnerability testing to ensure that proper security controls are in place to protect the synchrophasor system from unauthorized access. This dissertation describes vulnerability analysis and testing performed on synchrophasor system components. Two network fuzzing frameworks are proposed; for the IEEE C37.118 protocol and for an energy management system (EMS). While fixing the identified vulnerabilities in information infrastructures is imperative to secure a power system, it is likely that successful intrusions will still occur. The ability to detect intrusions is necessary to mitigate the negative effects from a successful attacks. The emergence of synchrophasor systems provides real-time data with millisecond precision which makes the observation of a sequence of fast events feasible.
Different power system scenarios present different patterns in the observed fast event sequences. This dissertation proposes a data mining approach called mining common paths to accurately extract patterns for power system scenarios including disturbances, control and protection actions and cyber-attacks from synchrophasor data and logs of system components. In this dissertation, such a pattern is called a common path, which is represented as a sequence of critical system states in temporal order. The process of automatically discovering common paths and building a state machine for detecting power system scenarios and attacks is introduced. The classification results show that the proposed approach can accurately detect these scenarios even with variation in fault locations and load conditions. This dissertation also describes a hybrid intrusion detection framework that employs the mining common path algorithm to enable a systematic and automatic IDS construction process. An IDS prototype was validated on a 2-line 3-bus power transmission system protected by the distance protection scheme. The result shows the IDS prototype accurately classifies 25 power system scenarios including disturbances, normal control operations, and cyber-attacks.
DEDICATION To my wife Yang Wang, Dad Xiaoping Pan, Mom Ruizhen Chen.
ii
ACKNOWLEDGEMENTS I would like to express my deepest appreciation to my advisor Dr. Thomas Morris for his continuous guidance and encouragement throughout this work. This work would not have been possible without his support and belief in me. I would like to acknowledge Dr. David Dampier, Dr. Yong Fu, and Dr. Bryan Jones for their advice and support as members of my graduate committee. I would also like to thank Mr. Vahid Madani, Ms. Sharon Xia, the Pacific Gas and Energy Company and Alstom Grid for supporting this work. I would like to acknowledge Mr. Uttam Adhikari for his help on building the cyber-physical power system test bed, which make feasible the realistic power system data that is used for validating my algorithm. I would also like to thank him for providing me with needed insights of power system theories. I would like to thank my colleagues and friends, Jonathan Moorhead, Jeremy Lewis and Read Sprabery, who have worked with me and helped me in vulnerability testing study. Finally, I would like to thank my wife, my parents and my friends who never stopped in believing me and supporting me in difficult times and rejoicing my successes.
iii
TABLE OF CONTENTS DEDICATION .................................................................................................................... ii ACKNOWLEDGEMENTS ............................................................................................... iii LIST OF TABLES ............................................................................................................ vii LIST OF FIGURES ......................................................................................................... viii CHAPTER I.
INTRODUCTION .............................................................................................1 1.1 1.2 1.3 1.4 1.5
II.
Background ............................................................................................1 Cyber-physical environment of power system ......................................3 Cybersecurity challenges in synchrophasor-based power system ....................................................................................................5 Objectives ..............................................................................................7 Contributions........................................................................................10
RELATED WORKS ........................................................................................13 2.1 2.2
Current research in power system vulnerability assessment................13 Current research in data mining techniques in application to event detection for power system ........................................................14 Current research in intrusion detection system for smart grid .............17 2.3 2.3.1 Intrusion detection system (IDS) for smart grid ............................17 2.3.2 Accuracy of specification-based IDS.............................................20 2.3.3 Data mining techniques for learning specifications .......................21 III.
CYBERSECURITY TESTING FOR SYNCHROPHASOR SYSTEM .........23 3.1 3.2
Introduction ..........................................................................................23 Synchrophasor system cyber security requirements development .........................................................................................25 3.3 Synchrophasor system cyber security component testing ...................37 3.3.1 Testing environment configuration ................................................38 3.4 Cybersecurity testing ...........................................................................39 3.4.1 Network congestion testing............................................................39 3.4.2 Protocol mutations .........................................................................43 iv
3.4.2.1 MU-4000 network analyzer .....................................................44 3.4.2.2 A fuzzing framework for IEEE C37.118 protocol ...................47 3.4.2.2.1 Smart fuzzing ...............................................................52 3.4.2.2.2 Dumb fuzzing...............................................................57 3.4.2.2.3 Fuzzing algorithms for different IEEE C37.118 frames .................................................................................59 3.4.2.2.3.1 Configuration Frame Fuzzing ..........................59 3.4.2.2.3.2 Data Frame Fuzzing .........................................59 3.4.2.2.3.3 Command Frame Fuzzing ................................59 3.4.2.2.3.4 Header Frame Fuzzing .....................................60 3.4.3 Energy management system fuzzing framework ...........................66 3.5 Developing Snort rules for detecting attacks .......................................69 3.6 Conclusion ...........................................................................................72 IV.
DETECTION FOR FAULT AND CYBER ATTACK IN POWER SYSTEM BY MINING SYNCHROPHASOR DATA ...................................73 Introduction ..........................................................................................73 Mining common path ...........................................................................78 4.2.1 Sequential events for a power system scenario..............................78 4.2.2 Mining common paths algorithm ...................................................81 4.3 Power system test bed ..........................................................................84 4.3.1 Power system scenarios .................................................................84 4.3.1.1 Power System Faults ................................................................84 4.3.1.2 Trip command injection attack ................................................85 4.3.1.3 Aurora attack ............................................................................85 4.3.1.4 1LG fault replay attack ............................................................86 4.3.2 Test bed architecture ......................................................................86 4.3.3 Test Data and Data Preprocessing .................................................88 4.4 Evaluation ............................................................................................91 4.4.1 Training phase:...............................................................................92 4.4.2 Test phase: .....................................................................................92 4.4.3 Experiment 1 ..................................................................................93 4.4.4 Experiment 2 ..................................................................................95 4.4.5 Experiment 3 ................................................................................100 4.5 Conclusions ........................................................................................102 4.1 4.2
V.
DEVELOPING A HYBRID INTRUSION DETECTION SYSTEM USING DATA MINING FOR POWER SYSTEM .......................................104 5.1 5.2 5.3
Introduction ........................................................................................104 Mining common paths .......................................................................106 Test bed architecture ..........................................................................109 5.3.1 Distance protection for transmission lines ...................................109 5.3.2 Test bed architecture ....................................................................111 5.3.3 Test bed scenarios ........................................................................112 v
5.3.4 Scenario implementation .............................................................115 5.3.5 Test data .......................................................................................117 5.4 Training the IDS ................................................................................118 5.4.1 Data Formatting ...........................................................................118 5.4.2 Creating and grouping paths ........................................................120 5.4.2.1 Creating paths ........................................................................120 5.4.2.2 Error features .........................................................................121 5.4.2.3 Grouping paths .......................................................................122 5.4.3 Mining common paths .................................................................123 5.4.4 Evaluation ....................................................................................126 5.5 Conclusion .........................................................................................130 VI.
CONCLUSION AND FUTURE WORKS ....................................................132 6.1 6.2
Conclusion .........................................................................................132 Future Works .....................................................................................138
REFERENCES ................................................................................................................141
vi
LIST OF TABLES 3.1
Recommendations and Requirements Derived from NISTIR 7628 [3]...........27
3.2
Recommendations and Requirements Derived from DHS Cyber Security Procurement Language for Control Systems [46] .............................33
3.3
Algorithm for configuration frame fuzzing .....................................................62
3.4
Algorithm for data frame fuzzing approach.....................................................63
3.5
Algorithm for command frame fuzzing ...........................................................64
3.6
Algorithm for header frame fuzzing ................................................................65
4.1
Example paths for a scenario ...........................................................................82
4.2
Confusion matrix for experiment 1 ..................................................................94
4.3
Confusion matrix for experiment 2 ..................................................................96
4.4
Confusion Matrix for 4 types of faults and 3 cyber-attacks...........................100
5.1
Example paths for a scenario .........................................................................107
5.2
Confusion matrix for scenarios Q1-Q13 ........................................................127
5.3
Confusion matrix for scenarios Q14-Q25 ......................................................127
5.4
Confusion matrix for sub-groups in scenario Q1 ...........................................128
5.5
Detection accuracy for 4 random zero-day attacks 10x validation ................130
6.1
Fulfillment of seven requirements for the proposed IDS...............................135
vii
LIST OF FIGURES 1.1
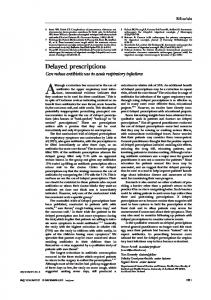
Structure of electric transmission system with integration of synchrophasor technology .................................................................................4
3.1
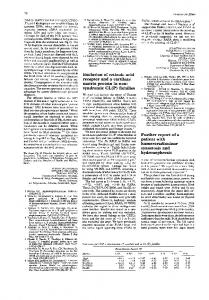
Synchrophasor system component diagram.....................................................37
3.2
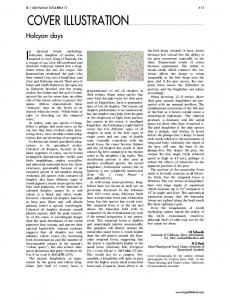
Test bed configuration .....................................................................................38
3.3
Denial of service test response time chart........................................................41
3.4
Availability chart from congestion testing .......................................................42
3.5
PMU and PDC communication pattern ...........................................................48
3.6
Structure of the fuzzing framework for IEEE C37.118 protocol .....................50
3.7
A general structure for EMS system ................................................................67
3.8
Structure of fuzzing framework for fuzzing EMS system super server...........68
4.1
Ideal vs. actual SLG fault and protection system response .............................78
4.2
Distribution of timestamps for events ..............................................................80
4.3
3-bus 2-line transmission system for case study ..............................................86
4.4
Hardware in the loop test bed ..........................................................................87
4.5
Relay trip time versus fault location for relays R1 and R2 ..............................95
4.6
2-D coordinates documenting fault versus command injection attack common paths ..................................................................................................98
4.7
2-D coordinates comparing two common paths for faults ...............................99
4.8
Accuracy rates for 10-round cross validation with different PMU streaming rates ...............................................................................................102
5.1
Distance protection scheme in a 3-bus 2-line transmission system ...............109
5.2
Electric transmission system test bed ............................................................110 viii
5.3
Control flow for automation scenario implementation and data collections ......................................................................................................115
5.4
Intrusion detection system training process ...................................................118
5.5
Dispersion of timestamps for three states that contain three events CP = R1, SNT = R1 and IR1 = 0. ........................................................................121
5.6
Relay trip time versus fault location for relays R1 and R2 ............................122
5.7
2-D coordinates documenting fault versus fault replay attack common paths ...............................................................................................................125
5.8
2-D coordinates documenting ling maintenance versus command injection attack common paths.......................................................................126
ix
INTRODUCTION
1.1
Background The need of electric market regulation and the connection of neighboring electric
grids motivate the use of wide area monitoring systems from which utilities have improved visibility of the power grid. Many utilities in the United States of America (USA) received grants from the Department of Energy (DOE) under the American Recovery and Reinvestment Act (ARRA) to create wide area monitoring systems. Wide area monitoring systems are measurement systems that use information communication technology (ICT) to transmit digital and/or analogue data measured by field sensors. The wide area monitoring systems use synchrophasor technology to improve the visualization and situational awareness through high quality measurements of voltage, current, and frequency. The synchrophasor systems require installation of phasor measurement units (PMU), and substation phasor data concentrators (PDC), among other devices and software. PMUs and substation PDCs are networked appliances which use routable network protocols to communicate. They are the key components in the synchrophasor system and may become the target of cybersecurity attacks against bulk electric power systems. Threats against these devices include denial of service attacks, attacks against open ports and services intended to elevate privilege, attempts to change device settings, attempts to inject malicious device commands, attempts to hijack device access 1
credentials or other confidential information, and attempts to place a man-in-the-middle between devices. Due to the critical role that the electric power systems play in our society, there is a common agreement among different organizations that the electric power grid needs to be better secured to ensure continuous power being provided to the nation [1]. The ARRA grants required recipient entities to develop a cybersecurity plan which includes a risk assessment as part of parent wide area monitoring systems projects. Also, the synchrophasor devices, i.e. PMUs and PDCs, may be declared North American Electric Reliability Corporation (NERC) Critical Infrastructure Protection (CIP) standard 002-3 [2] critical cyber assets (CCA), depending upon each individual unit’s application within the electric power system. CCA must be housed within an electronic security perimeter and undergo a cyber-vulnerability assessment. The National Institute of Standards and Technology Interagency Report (NISTIR) 7628 also documents the guidelines and requirements for industry to better secure their facilities [3]. While there is significant research in the vulnerability assessment of cybersecurity for traditional Supervisory Control and Data Acquisition (SCADA) systems, there are comparatively few publicly known vulnerabilities for synchrophasor-based monitoring and control systems. In addition, the tight integration of information communication technology and the physical process poses new challenges to the synchrophasor-based electric power system. For example, it has been shown that data delay and loss from a communication system can cause serious interruption in control application of the electric power system [15]. The United States Government Accountability Office (GAO) has realized that current security guidelines from different organizations are not sufficient to 2
securely implement the future electricity grid that employs synchrophasor technology and it calls for research and development to improve current security mechanisms [4]. 1.2
Cyber-physical environment of power system A typical power system is divided into four functional parts: generation,
transmission, distribution, and consumers. The electric transmission system is the backbone of the power system transmitting the electric power from generators to the load centers over a long distance. The structure of a cyber-physical environment for the electric transmission system augmented with synchrophasor technology is shown in Figure 1.1. The transmission system devices are mainly composed of transmission lines, breakers, and transformers that are monitored by field sensors. In the case of a synchrophasor system these field sensors are PMUs. The PMUs attached to transmission lines provide synchronized data that is time-stamped using Coordinated Universal Time (UTC) for continuous real-time monitoring. Phasor Data Concentrators (PDCs) collect synchrophasor measurements from PMUs that are located in different locations and send the measurements to the control center through the wide-area network (WAN). PMUs in different locations and PDCs are key components in the synchrophasor based wide area monitoring system (WAMS). Compared to the traditional SCADA system where the field sensors measure the system once per several seconds, the emergence of WAMS leveraging synchrophasor technology allows much faster measuring for the transmission system at the rates ranging from 30 samples per second to 120 samples per second [8]. Nowadays, synchrophasor measurements are not the only time-synchronized data in a system shown in Figure 1.1. As more devices and power system components such as relays, breakers etc. are integrated with the capability to synchronize to UTC, the status and measurements from 3
these devices are also time stamped and can be sent back to control center in real time [11]. The redundant information contributed by the time-synchronized data provides benefits for reliability, efficiency, and economics in power system monitoring and control. The extreme low latency offered by time-synchronized data allows various real-time wide area control algorithms and special protection schemes to be used to increase power grid reliability and stability [9][11][12][13][14]. The information flow described above is shown as the dotted line in Figure 1.1 and is often recognized as a control loop. In the case of a distributed control, the protection components in the system sense the disturbance and react to it by themselves. The bi-directed-arrow lines in between control components and WAN indicates not only the command data sent from control center but also the timesynchronized audit information reported from intelligent electronic devices (IDEs) to the control center.
Control Center
WAN
Control Loop
Control Components
Figure 1.1
Transmission Devices
PMUs
PDC
Structure of electric transmission system with integration of synchrophasor technology 4
The system can be considered as a finite state machine. If, for example, a tripping operation is sent from control center, this will cause system state transitions because a signal-sending operation has been recorded in the control panel which is one component of the system. In general, the changes of the behaviors in different system components such as a breaker, relay, and transmission lines in a given period of time or at a definite point of time will cause the system state to transition from one state to another. These changes are reflected by the transmission line sensor readings or device logs. If the system state is represented as a set of observations (from logs of different components) and measurement data (from measurement devices) inside the system, such changes along with time can be regarded as temporal state transitions. 1.3
Cybersecurity challenges in synchrophasor-based power system The electric power system in the past was often isolated and used proprietary
devices and software. However, the synchrophasor system greatly relies on the commercial off-the-shelf (COTS) components e.g. hardware (e.g. Personal Computers (PCs), network appliances, database servers), Windows Operating System, and standardized IP-based industrial protocols such as IEC 61850 and IEEE C37.118. The commercial hardware and software are usually the popular targets of cyber-attacks. There are a large number of exploits available in an exploit frameworks such as Metaspoit [64]. It is proved that power systems are vulnerable to cyber attacks [80]. Most industrial protocols use open standards without security features. In addition, there are still a large number of legacy devices in the field that do not have security control mechanisms at all. As such, the power system may be subjected to cyber-attacks. Potential catastrophic consequences have been learned from Aurora [65] and Stuxnet [7] attacks where 5
attackers penetrated the network, gained access to the control software and altered system states to destabilize the control systems. As a key componet in a cyber-physcial power system, research should be conducted to determine the the adequency of cybersecurity efforts in synchrophasor system. Developing robust cyber infrastructure requires intrusion prevention. Intrusion prevention techniques developed from penetration testing can fix the security breaches and effectively prevent known attacks. However, failures in intrusion prevention are still likely to occur, which can result in a compromise in the cyber infrastructure. A failure in intrusion prevention may be exploited by, for example, a zero-day attack that is unknown to the intrusion prevention mechenism. While successful attacks are always possible, intrusion detection as a means for defense in depth is necessary to be deployed to detect them. Intrusion detection system is helpful in reducing the negative impact in that fast responses to stop the attack can be taken as soon as the attack is identified. Traditional signature-based intrusion detection systems e.g. Snort are helpful to detect malicious activities when a malicious network packet is found. However, due to the increasing interaction between cyber infrastructure and the physical infrastructure created by the emergence of high-speed networks in electric power system attacks against future power systems will not be limited to those of the traditional IT system. Therefore traditional intrusion detection systems may not be enough to protect the future power grid from cyber-attacks that aim to interrupt physical processes. An example of such attacks is resonance attacks in which an attacker who has compromised system sensors or controllers causes the physical system to oscillate at its resonant frequency [5]. Another
6
example is demonstrated in [6] where an attack can inject false data to compromise meters to bypass the existing bad data detection algorithms. 1.4
Objectives Over 1,000 PMU have been installed across North America, and many local and
regional phasor data concentrators collect real-time, high-speed, time-synchronized information about power grid conditions to enhance grid operations and protect grid reliability. This information is also shared between transmission and power plant owners and grid operators to improve wide-area visualization of power grid states across large regions and to enhance situational awareness. Such information also enables advanced monitoring and control algorithms and new types of intrusion detection system that leverage the system state information to detect malicious system behaviors. Despite the benefits that synchrophasor systems bring to the power grid, they exist threats of cyber-attacks as synchrophasor devices are highly interconnected using information and communications technology (ICT). Synchrophasor devices are becoming more attractive to attackers. First they usually directly interact with the physical power system as they are installed in substations and measure transmission line parameters including current, voltage, and frequency. Synchrophasor device unavailability will cause the grid operators and plant owners to lose the view of power system conditions. Second, as more synchrophasor devices are integrated with protection relays, compromise of these devices may also result in attackers controlling breakers, which can lead to blackouts. One objective of this work is to develop a methodology to identify vulnerabilities associated with synchrophasor devices. This methodology will also identify gaps between available security features of synchrophasor devices and the cyber security standards or 7
requirements. This work demonstrates that a testing process and tools can be developed to conduct the vulnerability assessment for synchrophasor devices and protocols. One significant problem related to vulnerability testing for synchrophasor devices is the lack of protocol fuzzing tools available for mutating the IEEE C37.118 protocol. Also, current commercial protocol mutation tools are limited to mutating server to client commands and cannot mutate server to client responses. This makes commercial tools unsuitable to test the IEEE C37.118 protocol. This work demonstrates a network fuzzing framework developed to mutate IEEE C37.118 protocol packets and useful protocol mutation of other protocols used by synchrophasor devices. While identifying and closing synchrophasor system cyber vulnerabilities is imperative, successful intrusions can still occur. Time-stamped data synchrophasor measurements and device log provide cyber security researchers a new way to enable intrusion detection. This leads to a research problem of developing unique signatures for power system scenarios (i.e. disturbances) and cyber-attacks from the large amounts of data available in a synchrophasor system. Due to power system and measurement system dynamics, events present in the data have timestamp variation which makes mining patterns difficult. A number of publications (See Chapter II) discuss using machine learning methods to learn patterns for power system disturbances or cyber attacks but none of the methods described in literature can be applied to mine patterns of both types. Traditional data mining algorithms are designed to work on a small amount of data and cannot easily be used to classify specific power system scenarios and cyber attacks [28]. Therefore, in this dissertation we describe a new data mining method called mining common paths which learns unique signatures for different power system scenarios and 8
cyber attacks in terms of common paths from massive heterogeneous data collected from a power system. We prove the correctness and usability of common paths by creating patterns and classifying different power system disturbances and cyber attacks on one transmission line. Various research has been conducted to create intrusion detection systems (IDS) for smart grid, however, proposed methods suffer from different shortcomings. For example, host-based IDS is only able to monitor one location of the system. Networkbased IDS only focuses on network activities. Rule and specification-based IDS suffer from limited scalability due to labor-intensive IDS creation and update procedures. One objective of this dissertation is to create a new type of IDS that overcomes able to monitor a fusion of data from heterogeneous power system sensors to classify actions or scenarios which have recently occurred. The mining common paths algorithm was applied to train an intrusion detection system for a power system of 3 buses and 2 transmission lines. The IDS was capable of classifying 25 separate disturbance, control, and cyber-attack scenarios. This work proves that an IDS trained using the mining common paths algorithm can monitor a power system implementing the distance protection scheme. This work also shows that the mining common paths algorithm can automatically learn patterns for a variety of cyber attacks, power system disturbances and valid control actions from huge amount of data with little human interaction. Finally, this work demonstrates the intrusion detection system is able to accurately classify each scenario type with relatively small training and classification time and small memory usage.
9
1.5
Contributions This dissertation makes three primary contributions to industry and academia.
First, this dissertation presents a vulnerability testing process for PMU, PDC, and energy management systems (EMS) which was successfully used to identify vulnerabilities in a commercial synchrophasor system. The vulnerability testing includes a new fuzzing framework for the IEEE C37.118 protocol and the EMS. The testing process has been performed on PMU, PDC, and EMS from a major commercial hardware provider and a major power system software provider. Various vulnerabilities have been identified and reported to utilities and vendors. Suggestions on how to mitigate the security risk and to improve the security features of synchrophasor devices were also provided based on discovered vulnerabilities. Second, this dissertation documents a data mining approach called mining common path algorithm which accurately mines patterns from power system scenarios including disturbances, valid control actions, and cyber-attacks from synchrophasor data and logs of system components. These patterns, also known as common paths, represent system behaviors unique to each scenario and can be used to classify each scenario. The data mining algorithm is based on the mining sequential patterns algorithm which was found in the human health diagnosis research domain to learn patient’s physiological states. One contribution of this work is that we applied this data mining method to mine patterns for power system scenarios and cyber attacks. However, this algorithm requires that massive data to be preprocessed into a specific form called paths. To overcome this obstacle, another contribution of this work was development of a method to preprocess synchrophasor and power system state data into a set of paths usable by the algorithm. 10
Paths retain all events which have occurred in the system in a compressed form. As such the data can be processed by the mining common paths algorithm. Compared to other traditional data mining algorithms in [28], the classifier trained using mining common paths algorithm is able to provide more precise classification which enables automated controllers such as autonomic control frameworks in [66]. Finally, this dissertation also developed a hybrid intrusion detection system, trained using the mining common paths algorithm, to detect a variety of power system scenarios and cyber attacks in a large power system. The capability of the resulting IDS to classify the specific power scenarios and cyber attacks advances IDS state-of-art . The resulting IDS also complements current IDS techniques for Smart Grid by satisfying the following requirements. Requirement 1, the IDS should perform stateful monitoring at the system level. This means the IDS should be able to provide monitoring at different locations of the system to be able to monitor ordered sequences of execution events. Requirement 2, the IDS must be able to monitor actions of an automated control algorithm. It should be able to distinguish actions which originate from a system operator or automated control algorithm from similar actions which originate from an attacker where the primary distinguishing feature is the state of the system when the action occurs. Namely, we expect the new IDS to be able to detect not only cyber-attacks, but also power system disturbances and normal operations. For this work, the IDS must be able to monitor a system implementing the distance protection scheme for normal and attack behaviors. Requirement 3, the IDS must be able to detect zero day attacks, i.e. attacks that are unknown to the IDS. Requirement 4, the IDS should be able to process high volumes of 11
data from multiple sensors. Requirement 5, the IDS must be low cost. Cost includes development time and compute resources required to implement the IDS. This requirement also includes that the IDS should be able to extend to new scenarios as they are detected. Requirement 6, the IDS must be scalable to larger and more complex control algorithms. This requirement is intended to address the dynamic nature of the power system. The IDS must be able to continue to correctly classify behaviors as system configuration and load change. The IDS must be able to detect events that occur in random order. Requirement 7, the IDS must have high accuracy and minimal false positives.
12
CHAPTER II RELATED WORKS
2.1
Current research in power system vulnerability assessment The National SCADA Test Bed Program run by the Idaho National Lab (INL)
built a large scale SCADA test bed for the purpose of assessing control system cybersecurity, improving and extending the cybersecurity standards as well as training. Various common vulnerabilities associated with SCADA systems are reported in [9] from the program. Findings and learned lessons are summarized in [16] from security assessment of control systems. The program also develops recommended procurement language to enhance and improve the security in wireless systems for advanced metering infrastructure [17]. In addition, INL is engaged in cyber security standard improvement, training and cyber security assessment of software and hardware products for power system industry. However, no result is reported from INL regarding to cyber security assessment for synchrophasor system. Researchers have performed vulnerability assessments of generation and substation devices to support development of taxonomies of vulnerabilities related to industrial control systems. In [18] Fovino et al. describe a test bed used for vulnerability assessment of components found in a Turbo-Gas Power Plant. In [19] Skaggs et al. describe a tool, NETGLEAN, testing device for network vulnerabilities. Two well-known tools are available for network vulnerability testing of 13
industrial control systems. Wurldtech [20] offers the Achilles Satellite product for testing industrial control system devices. MU Dynamics [21] offers the MU Test Suite for testing networked devices, include industrial control system devices. Both products include protocol mutation and denial of service test suites. 2.2
Current research in data mining techniques in application to event detection for power system Compared to peer works, this work is unique in that we propose a data mining
algorithm that can learn patterns for both power system disturbances and cyber-attacks from heterogeneous data including synchrophasor measurements and device logs from multiple locations in the power system. Multiple traditional data mining algorithms were used to classify power system faults and cyber-attacks in [28]. The traditional data mining algorithms were able to differentiate between three broad categories with approximately 70% accuracy, power system disturbance, control action, and cyber-attack, however, the traditional data mining algorithms were not able to classify specific fault and cyber-attack types within each large category. Current research on applying data mining to synchrophasor data for power system fault and disturbance classification can be found in [68] and [69]. These works limit algorithm input to synchrophasor measurements and do not provide cyber-attack detection. The K-nearest neighbor algorithm was used to classify three phase faults (3LG), voltage oscillation, and voltage sag scenarios in [68]. The algorithm accuracy is not provided in [68]. Stream data mining is used in [69]. This approach was able to classify 3LG and single line to ground (1LG) faults grouped for binary classification with greater than 90% accuracy. Both [68] and [69] used simulated power system data. 14
Many other data mining approaches have been developed to extract signatures and classify power system disturbances but they have no ability to detect cyber-attacks. Many such approaches classify power system disturbances in the time domain. Decision trees were used to classify power system disturbances in [22] and [23]. Statistical characteristics of power system frequency were used in [24] to represent the signatures of power system disturbances. Frequency domain analysis has been proposed to avoid complex transient phenomena in time-domain waveforms. The frequency domain approaches first convert time-domain waveforms to the frequency domain using wavelet or/and Fourier transforms and then extract oscillation related features. Both Support Vector Machines (SVM) [25] and artificial neural networks (ANN) [26] have been used to classify of disturbances in the frequency domain. Many works have applied neural networks to classify faults. Using current and voltage data as input, patterns for faults can be learned by radial basis function neural networks [72], Kohonen neural networks [74] and self-organizing map-based neural networks [73]. In [75] the authors used a neural network with current waveforms and data from digital fault recorders to classify faults, normal maintenance operations, and power-quality disturbances. The work presented in this work uses a sequential data mining approach to classify patterns from sequences of events. Sequential data mining is better suited for high velocity and high volume synchrophasor data streams because synchrophasor data is discrete data but continuous in time. Additionally, the mining common paths algorithm presented in this work can learn to classify traditional power system contingencies, such as faults, and cyber-attacks against power systems which masquerade as traditional contingencies.
15
Machine learning approaches have also been applied to detect cyber-attacks against power systems. In [27], detection rules were derived by manually specifying allowable ranges for different system measurements using domain expert knowledge. Such specification based methods have been shown to have high detection accuracy; however, the manual effort required to develop such a decision tree is too great to apply to a problem on the scale of power system protection. Traditional machine learning algorithms were applied to a dataset which captured power system disturbances, control actions, and cyber-attacks [28]. The machine learning algorithms were able to successfully differentiate between grouped power system disturbances, control actions, and cyber-attacks, but, were not able to classify specific events in each larger category. Additionally, the machine learning algorithms make a classification decision for each row of the data set, which, was sampled at a rate of 120 measurements per second. Providing a classification at each row of the dataset rate amplifies the total number of false positives. The IDS presented in this dissertation provides a classification at once per detected scenario which results in one classification per several thousand rows of the dataset minimizing the volume of false positives. Other works have been found which provide intrusion detection for synchrophasor systems. An IDS was proposed which uses white lists to detect invalid network behaviors based on a synchrophasor network protocol specification [29]. A second proposed IDS uses timing and data volume information to identify data integrity attacks against synchrophasor systems [30]. To the best of authors’ knowledge no research has been published which detects both power system disturbances and cyberattacks at the same time. 16
The data mining technique used in this dissertation uses “mining sequential patterns” technique which discovers patterns of activity sequences from time ordered data. The “mining sequential patterns” algorithm was first mentioned in [31]. It was used to discover patterns in clinical client care management process data that consists of patient records and log data over a period of treatment time [32]. This technique was extended in [33] by employing a two dimension Bayesian network to graphically represent patterns in Hemodialysis processes which consist of a sequence of medical activities over time. In order to discover patterns, a patients’ physiological “state” is defined using clinical log data and patient records (e.g. body temperature). The pattern is therefore, represented as contiguous transitions of states in a two dimension graph. The classification was made using the patterns. For this work, the FP-growth algorithm is used to mine frequent sequential patterns. FP-Growth reduces the cost of searching for frequent sequences by adopting a divide-and-conquer strategy [34]. As demonstrated in [70], FP-graph algorithm outperforms several popular frequent pattern mining algorithms in run time and therefore it was chosen for this work. 2.3 2.3.1
Current research in intrusion detection system for smart grid Intrusion detection system (IDS) for smart grid In recent years, the emergence of the smart grid has motivated research into a
variety of IDS techniques. People with different backgrounds have created various IDS that focus on different aspects of the smart grid. One type of IDS research focuses on intelligent electronic device (IED) security within the smart grid. For example, CheeWooi Ten et al. developed an anomaly-based detection technique to detect attacks against 17
IED [35]. The Chee-Wooi Ten IDS is host-based thus only identifies attacks against a single IED in the substation using sequential events recorded in the log from that IED. Another IDS proposed by Chen et al. provides a protection mechanism for smart household appliances [36]. Chen et al. created security rules for individual appliances by proposing homogeneous functions that models three factors of the appliance: device security, usability and electricity pricing. While these two IDS secure individual devices in the smart grid, they do not provide stateful monitoring at system level for the smart grid. More advanced IDS of this type consider behaviors of multiple devices within the system to obtain system level detection. In [27], Mitchell et al. propose a rule-based IDS for the electric grid by considering the behaviors of three types of physical devices in the electric grid: head-ends, distribution access points/data aggregation points, and subscriber energy meters. Mitchell et al. use readings from 22 sensors from the three types of devices as state components. By quantizing each of the 22 components into a limited number of ranges, they manually build three state machines with 3456, 1728, and 3456 states for the three devices respectively in terms of conjunctive normal form. To manually build such an IDS is very expensive due to the large state space. Additionally, this IDS uses a limited number of sensors therefore is able to detect a limited number of attacks. Since there are always new attacks and applications, this method is not scalable. Network based IDS leverage communication traffic in the information infrastructure of smart grid to detect cyber-attacks. Yang et al. propose an IDS for synchrophasor systems that detects cyber-attacks by using access control white lists, protocol-based white lists and network behavior-based rules, each of which specify security rules in different layers of the synchrophasor system [29]. The Yang et al. IDS is 18
limited to cyber-attacks including MITM and DoS against synchrophasor devices and IEEE C37.118 protocol. Similar to Yang’s IDS, Zhang et al. propose a distributed IDS that analyzes communications traffic at different network levels of smart grid including home area networks, neighborhood area networks, and wide area networks [37]. An intelligent module is deployed at each level to classify malicious data and possible cyberattacks using data mining algorithms. These modules then communicate to get a system level view of the status of the whole communication network to improve the detection accuracy. Hadeli et al., in [38], propose an anomaly detection technique for industrial control systems that extracts behavior patterns of devices from protocols used in industrial control systems, for example, GOOSE messages, IEEE 61850, Manufacturing Message Specification, Modbus/TCP and redundant network routing protocols. The Hadeli IDS uses a system description file to provide a full description of the overall communication pattern in the industrial control system. For the case of power system control applications, the system description file describes expected system behaviors from information carried by those protocols. Hadeli’s method, along with [29] and [37] are efficient to detect malicious activities that cause changes in network traffic, but the IDS fails to detect malicious actions that result in invalid changes to the physical system. For example, Hadeli’s method cannot detect a malicious command to trip a protection relay from a valid IP address which will take a transmission line out of service and cause a blackout. A specification-based IDS that can track sequential events of the system is reported in [39] for the advanced metering infrastructure (AMI). The authors manually built a state machine by extracting specifications from two AMI protocols and devices status. To prove the correctness of the state machine, a model checking technique was 19
used to verify the specifications. This IDS is also not applicable to transmission systems because transmission systems have far more control actions and disturbances than AMI. As such, manually building a state machine would be very expensive. Other proposed IDS for smart grid leverage power system theory. For instance, in [40], Valenzuela et al. use optimal power flow programs to detect cyber-attacks which alter system measurement data as the bad data will cause the power flow to be dispatched erroneously. Talebi et al. propose a mechanism for identification of bad data attacks in a power system using weighted state estimation [41]. Zonouz et al. proposed an IDS that not only examines the measurement data using state estimation and power flow theory but also includes the results from network IDS to calculate the probability that the data is compromised [42]. Although these works are all proven capable of detecting altered data, these IDS are limited to one type of attack and cannot be extended to detect other attacks against power systems. 2.3.2
Accuracy of specification-based IDS The detection accuracy of specification-based IDS depends on how accurately the
specifications describe system behaviors. Different efforts have been made to build accurate specifications for specification-based IDS. One approach is to use a formal language, such as the declarative language MuSigs [44] to describe known attacks using temporal logic formulas [45]. The MuSigs authors formally specified attack signatures and proved the soundness and completeness of their detection rules. The use of a formal language to specify behaviors is too work intensive for a power system IDS where there are too many behaviors to specify. 20
A promising way to improve the accuracy of specifications is through the use of data mining. A data mining technique was applied to an IDS framework proposed by Lee et al. that combined signature-based IDS and anomaly-based IDS [43]. Data mining programs were applied to a large volume of log data to learn attack signatures and normal behavior patterns and automatically create detection rules. Lee et al. showed that the signatures for attacks and patterns for system normal behaviors created using their data mining technique are accurate by comparing their results for probing and user to root privilege escalation attacks to all other participants in the DARPA intrusion detection evaluation program prepared by MIT Lincoln Labs. The overall detection accuracy of their IDS against 4 types of attacks is 80.2% and is the highest among all participants. Lee’s IDS was originally designed for stateless IDS therefore it cannot be directly applied to specification-based IDS. A new data mining algorithm must be developed to discover sequential events for specifications. 2.3.3
Data mining techniques for learning specifications A specification for a scenario contains a sequence of execution events or system
states. The nature of specifications requires the data mining technique applied to the proposed IDS to be able to mine sequential patterns and identify the dependent relationship between events. The data mining technique used in this dissertation uses the “mining sequential patterns” technique which discovers patterns of activity from time ordered data. The “mining sequential patterns” algorithm was first mentioned in [31]. Lin et al. applied it to discover patterns in clinical client care management process data that consists of patient records and log data over a period of treatment time [32]. This technique was extended in [33] by employing a two dimension Bayesian network to 21
graphically represent patterns in Hemodialysis processes which consist of a sequence of medical activities over time. In order to discover patterns, a patients’ physiological “state” is defined using clinical log data and patient records (e.g. body temperature). The pattern is therefore, represented as contiguous transitions of states in a 2-dimention graph. The classification was made using the patterns.
22
CHAPTER III CYBERSECURITY TESTING FOR SYNCHROPHASOR SYSTEM
3.1
Introduction Many utilities in the United States of America received grants from the
Department of Energy under the American Recovery and Reinvestment Act (ARRA) to create wide area monitoring systems. The ARRA grants require recipient entities to develop a cybersecurity plan which includes a risk assessment as part of parent wide area monitoring systems projects. Wide area monitoring systems require installation of phasor measurement units (PMU), and substation phasor data concentrators (PDC), among other devices and software. PMUs and substation PDCs are networked appliances which use routable protocols. As such, these devices may be declared North American Electric Reliability Corporation (NERC) Critical Infrastructure Protection (CIP) standard 002-3 [2] critical cyber assets (CCA), depending upon each individual unit’s application within the power system. CCA must be housed within an electronic security perimeter and undergo a cyber vulnerability assessment. The IEEE 1402 Guide for Electric Power Substation Physical and Electronic Security [2] defines cyber intrusion or electronic intrusion as “Entry into the substation via telephone lines or other electronic-based media for the manipulation or disturbance of electronic devices.” PMU and substation PDC are networked appliances and may become the target of attacks against bulk electric power systems. Threats against these 23
devices include denial of service attacks, attacks against open ports and services intended to elevate privilege, attempts to change device settings, attempts to inject malicious device commands, attempts to hijack device access credentials or other confidential information, and attempts to place a man-in-the-middle between devices. This chapter describes the process used to develop a set of cyber security requirements for PMU and PDC installation. Three primary sources were used to derive cyber security requirements. First, NISTIR 7628: Guidelines for Smart Grid Cyber Security [3] was reviewed and 28 relevant requirements were taken from this document. Second, the Department of Homeland Security: Cyber Security Procurement Language for Control Systems was reviewed. This document was used to derive project requirements and used as a basis for procurement language added to vendor contracts. Second, this dissertation describes testing performed to identify PMU and PDC vulnerabilities prior to device installation in a production control system. A MU Dynamics MU-4000 Analyzer was used to perform network congestion testing, denial of service testing, and protocol mutation testing. Testing also included device manual reviews to identify security related features, security feature testing, network traffic disclosure testing, and subjecting of devices to network isolation via introduction of extraneous VLAN, and a man-in-the-middle attack. Results from the tests were provided to the utility to enable network monitoring to mitigate identified vulnerabilities and to allow the utility to work device vendors to create corrective action plans. PMUs and PDCs from multiple vendors were tested. Vendor names and product identifiers are withheld from this article to prevent enabling attacks. Results from this testing have been shared with device vendors. Finally, this dissertation describes a methodology for 24
developing signature based intrusion detection system developed for us in bulk electric substations. The intrusion detection system described take information from multiple sources including, SNORT, synchrophasor data, relay data logs, and energy management system logs to provide model based classification of system occurrences as valid faults or network based attacks. The body of this chapter includes a section describing synchrophasor system cyber security requirements development, a section describing cyber security testing of synchrophasor system components, a section describing development of Snort rules, and finally, a section on future works and conclusions. 3.2
Synchrophasor system cyber security requirements development Prior to testing a set of cybersecurity requirements and recommendations were
prepared from review of the National Institute of Standards and Technology Interagency Report (NISTIR) 7628 Guidelines for Smart Grid Cyber Security: Vol. 2, Security Architecture and Security Requirements [3], Department of Homeland Security (DHS): Cyber Security Procurement Language for Control Systems [46], and utility internal requirements. NISTIR 7628 Vol. 2 includes a process for deriving cyber security recommendations and requirements for smart grid systems. NISTIR 7628 requirements and recommendations are taken from NIST SP 800-53 Revision 3 [47], the Department of Homeland Security Catalog of Control Systems Security: Recommendations for Standards Developers [48], NERC CIP (1-9) [2]. Each requirement is traceable to one or more of the aforementioned source documents. A cross functional team was formed to review and discuss cyber security requirements and recommendations. This team included representatives from the utility, 25
the vendor of phasor measurement unit and phasor data concentrator hardware, the vendor of the energy management system, bulk electric transmission system consultants, and a cyber security researcher from academia. Team members included cyber security engineers, power system engineers, network communications engineers, hardware and software designers, and management representatives. A subcommittee drafted an initial version of cyber security recommendations and requirements for the intended synchrophasor system. The initial draft was circulated to the larger team for review. Finally, multiple meetings were held with all team members to discuss each proposed cyber security requirement in detail. The resulting recommendations and requirements are included in Table 3.1 and Table 3.2. Table 3.1 and Table 3.2 list requirements pertinent to system hardware and software components. Requirements related to organization and management, physical protections, services acquisition, macro information system protection, risk management and assessment, personnel security, planning, maintenance, incident response, information and document management, configuration management, training, and security program management exist but are not listed in Table 3.1 and Table 3.2 [83].
26
Table 3.1
Recommendations and Requirements Derived from NISTIR 7628 [3]
NISTIR 7628
Title
Description
Access
The synchrophasor system should enforce
Enforcement
assigned authorizations for controlling access.
Least Privilege
The synchrophasor system should assign and
Req. # AC-4
AC-7
enforce the most restrictive set of rights and privileges or access needed by users for the performance of specified tasks. AC-8
Unsuccessful
The synchrophasor system should enforce a
Login Attempts
defined number of consecutive invalid login attempts by a user during a defined time period.
AC-9
Smart Grid
The synchrophasor system should display
Information
appropriate use banners where applicable.
System Use Notification AC-10
Previous Logon
The synchrophasor system should notify the
Notification
user, upon successful logon, of the date and time of the last logon and the number of unsuccessful logon attempts since the last successful logon.
27
Table 3.1 (Continued) NISTIR 7628
Title
Description
Session Lock
The synchrophasor system should initiate a
Req. # AC-12
session lock after an organization-defined time period of inactivity or upon receiving a request from a user; and retain the session lock until the user reestablishes access. AC-21
Passwords
The synchrophasor system should adhere to utility password complexity rules and passwords should be changed according to utility policy.
AU-2
Auditable Events
A set of auditable events should be developed for the synchrophasor system. The list should be revised based on current threat data, assessment of risk, and post-incident analysis. of risk, and post-incident analysis.
AU-3
AU-8
Content of Audit
The synchrophasor system should produce
Records
audit records for each auditable event.
Time Stamps
The synchrophasor system should use internal system clocks to generate time stamps for audit records.
28
Table 3.1 (Continued) NISTIR 7628
Title
Description
Req. # AU-9
Protection of Audit The synchrophasor system should protect audit Information
information and audit tools from unauthorized access, modification, and deletion.
AU-10
AU-16
Audit Record
The synchrophasor system audit logs for a
Retention
utility specified time period.
Non-Repudiation
The synchrophasor system should protect against an individual falsely denying having performed a particular action.
CP-10
IA-5
Smart Grid
The utility must have the capability to recover
Information
and reconstitute the synchrophasor system to a
System Recovery
known secure state after a disruption,
and Reconstitution
compromise, or failure.
Device
The synchrophasor system should uniquely
Identification and
identify and authenticate devices before
Authentication
establishing a connection where technically feasible.
SC-3
Security Function
The synchrophasor system should isolate
Isolation
security functions from non-security functions.
29
Table 3.1 (Continued) NISTIR 7628
Title
Description
Denial-of-Service
The synchrophasor system should mitigate or
Protection
limit the effects of denial-of-service attacks
Req. # SC-5
based on an organization-defined list of denialof-service attacks. SC-7
Boundary
The synchrophasor system should be
Protection
appropriately placed within electronic security perimeters.
SC-8
Communication
The Smart Grid information system protects the
Integrity
integrity of electronically communicated information.
SC-9
Communication
The synchrophasor system should protect the
Confidentiality
confidentiality of sensitive communicated information.
SC-10
Trusted Path
The synchrophasor system should establish a trusted communications path between the user and the synchrophasor system.
30
Table 3.1 (Continued) NISTIR 7628
Title
Description
Use of Validated
All of the cryptography and other security
Cryptography
functions that are required shall be NIST
Req. # SC-12
Federal Information Processing Standard (FIPS) approved. SC-19
Security Roles
Specific security roles and responsibilities for users of the synchrophasor system should be defined.
SC-20
Message
The synchrophasor system should provide
Authenticity
mechanisms to protect the authenticity of device-to-device communications.
SC-22
Fail in Known
Devices and software used in synchrophasor
State
system should fail in a known state to prevent loss of confidentiality, integrity, or availability.
SC-26
Confidentiality of
Synchrophasor system hardware and software
Information at
should employ cryptographic mechanisms for
Rest
all critical security parameters to prevent unauthorized disclosure of information at rest.
31
Table 3.1 (Continued) NISTIR 7628
Title
Description
Application
The synchrophasor system should separate user
Partitioning
functionality (including user interface services)
Req. # SC-29
from management functionality.
NISTIR requirements address access control (AC), audit requirements (AU), continuity of operations (CP), identification and authentication (IA), and smart grid information system and communication protection (SC). The requirements were derived using the NISTIR 7628 Logical Interface Category 3: Interface between control systems and equipment with high availability, without compute or bandwidth constraints. This interface category specifically includes communication interfaces between phasor measurement units and a wide area measurement system. It was assumed that the synchrophasor system would eventually be used to source measurements to wide area protection system applications and therefore high availability was a requirement. It was also assumed that new computer systems and new communication bandwidth would be added to support the synchrophasor system and therefore not compute or bandwidth constraints were assumed.
32
Table 3.2
Recommendations and Requirements Derived from DHS Cyber Security Procurement Language for Control Systems [46]
Req. #
Title
Description
PROC.1
System
Vendor(s) shall list required ports and services for
Hardening
normal and emergency operation.
Least Privilege
Vendor(s) shall configure systems with least
PROC.2
privilege file and account access and provide documentation of the configuration. PROC.3
PROC.4
PROC.5
PROC.6
Hardware
Vendor(s) shall disable all unneeded communication
Configuration
ports and removable media drives.
Upgrade
Vendor(s) shall password protect the BIOS from
Access Control
unauthorized changes.
Patch
Vendor(s) shall have a patch management and update
Management
process.
Perimeter
Vendor(s) shall provide detailed information on all
Protection
communications (including protocols) required through a firewall.
PROC.7
PROC.8
Session
Vendor(s) shall not permit user credentials to be
Management
transmitted in clear text.
Concurrent
Vendor(s) shall not allow multiple concurrent logins,
Logins
applications to retain login information between sessions, provide any auto-fill functionality during login, or allow anonymous logins. 33
Table 3.2 (Continued) Req. #
Title
Description
PROC.9
Account
Vendor(s) shall provide user account-based logout
Logout and
and timeout settings.
Timeout PROC.10
Warning
A standard warning banner developed by the utility
Banner
and must be displayed when users logon to a utility computer system and/or network.
PROC.11
Least Privilege
System owners must restrict privileges for all users, interconnected systems, and software based on the principle of least privilege. Where possible, system role accounts and programs must not run with elevated privileges.
PROC.12
Configurable
Vendor(s) shall provide a configurable account
Password
password management system that allows for
Complexity
selection of password length, frequency of change, setting of required password complexity, number of login attempts, inactive session logout, screen lock by application, and denial of repeated or recycled use of the same password.
34
Table 3.2 (Continued) Req. #
Title
Description
PROC.13
Password
Vendor(s) shall not store passwords electronically or
storage
in vendor-supplied hardcopy documentation in clear text unless the media is physically protected.
PROC.14
PROC.15
Emergency
Vendor(s) shall provide a mechanism for rollback of
Security
security authentication policies during emergency
Rollback
system recovery.
Password
Passwords must be encrypted using a utility approved
Encryption
cryptographic algorithm.
Algorithm PROC.16
PROC.17
Password
User account passwords to utility defined complexity
Complexity
requirements.
Activity
Vendor(s) shall provide a system whereby account
Logging
activity is logged and is auditable both from a management (policy) and operational (account use activity) perspective.
PROC.18
Audit Log
Vendor(s) shall time stamp, encrypt, and control
Time Stamping
access to audit trails and log files where feasible.
and Encryption
35
Table 3.2 (Continued) Req. #
Title
Description
PROC.19
Audit Log
Vendor(s) shall ensure audit logging does not
Impact on
adversely impact system performance requirements.
System Performance PROC.20
Audit Log
Log data shall include the date and time of the event,
Entry Contents
the unique ID used to initiate the event, the type of event, success or failure, and the name of the object involved.
PROC.21
PROC.22
User Accounts
Vendor(s) shall provide for user accounts with
with Defined
configurable access and permissions associated with
Role
the defined user role.
TCP/IP
Vendor(s) shall provide physical and cyber security
Cybersecurity
features, including but not limited to authentication,
Features
encryption, access control, event and communication logging, monitoring, and alarming to protect the device and configuration computer from unauthorized modification or use.
PROC.23
Approved
The use of cryptographic algorithms must be limited
Cryptographic
utility approved algorithms.
Algorithms
36
3.3
Synchrophasor system cyber security component testing The cyber security requirements from the above section were applied to hardware,
software, and communication systems throughout the synchrophasor system. A diagram was developed which included all system components and communication interfaces to each component. A sanitized version of the synchrophasor system component disgram is shown in Figure 3.1. The energy management system components depicted in this figure may not be complete but are necessary for adopting synchrophasor technology. This work provides a third party testing methodologies for phasor measurement unit (PMU), phasor data concentrator (PDC) and the energy management (EMS) system. The following sections give the cybersecurity testing procedures and methodologies for PMU and PDC. The testing results with vulnerabilities are ranked using a risk scale proprietary to the utility who grant this work.
Figure 3.1
Synchrophasor system component diagram 37
3.3.1
Testing environment configuration Three PMUs and one PDC were tested. A MU Dynamics MU-4000 Analyzer was
used to perform denial of service, network congestion, and protocol mutation tests for well-known protocols such as TCP/IP etc. A personal computer (PC) was used with Wireshark to capture network traffic data logs and to host software used to configure and remotely control the PMU and PDC. The PMUs were connected to a Real Time Digital Simulator (RTDS) in a hardware-in-the-loop configuration. The RTDS provided simulated high voltage AC busses for the PMU’s to measure. PMUs were connected through a substation router to PDC. PDC concentrated synchrophasor measurement streams from the PMU and forwarded this data to an OpenPDC installation which served as a historian for the system. Noted that, there is another PC depicted as attacker’s, which is used to perform penetration testing such as Man-in-the-middle attacks and IEEE C37.118 protocol mutation tests. Figure 3.2 shows the test bed configuration.
Figure 3.2
Test bed configuration
38
PMUs periodically measure voltage, current, and transmit voltage and current phasors (based upon a reference cosine waveform) at 120 samples per second. PMUs are time synchronized devices with clocks synchronized to Universal Time Coordinated (UTC) with 1 microsecond accuracy. Synchrophasor network packets are transmitted from the PMUs to a PDC. PMUs adhere to the IEEE C37.118 standard which specifies measurement requirements and the synchrophasor measurement format. PMUs may communicate over Ethernet or Serial port. Three PMU’s were tested for this work. PMU A and PMU B shared the same vendor, while PMU C was manufactured by a second vendor. All PMUs communicate over Ethernet using the IEEE C37.118 protocol. PDC collect synchrophasor streams from multiple PMU and create a single stream for retransmission to historian. PDC perform stream data rate conversion and can be configured to interpolate when data is missing from a stream. PDC adhere to the IEEE C37.118 standard and communicate over Ethernet. 3.4 3.4.1
Cybersecurity testing Network congestion testing The MU-4000 Network Analyzer was used to perform network congestion
testing. The MU-4000 denial of service test suite includes tests for multiple network protocols across all network OSI layers. The denial of service tests validate a device’s ability to withstand large volumes of traffic directed at the device. The relevant network protocols for testing PMU and PDC include various types of protocols in different ISO/OSI layers. Each network congestion test attempts to stress a separate portion of the device’s network stack. The tests target a device’s ability to process large volumes of a single type 39
of network traffic. The PMUs and PDC are usually based on embedded systems or simplified PC structure therefore contain limited memory which can be exhausted and lead to operating system exceptions, cause services to stall, and or cause the device to reset itself. A set of network layer tests send floods of ARP requests, PPPOE packets, and IPv4 packets to the target device. Network layer variations send random packets of all three types, IP packets with random sizes and random payload, and IP packets with large numbers of IP fragments. A set of ICMP tests were also used. ICMP tests send floods of ICMP echo requests (aka. Ping flood or Smurf attack), ICMP echo packets with large payloads, address mask requests, and source quench messages. Transport layer tests send floods of TCP and UDP packets to the device under test. TCP tests include variations which stress a device’s ability to create and teardown TCP sessions with floods of TCP SYN and TCP FIN packets targeting individual TCP ports and to random TCP ports. UDP tests include random headers and payloads to the UDP ports which are open in the target devices. Two tests validate device behavior for illegal packet types. A LAND test sends floods of IP packets with both the source and destination IP address set to the target’s IP address. A teardrop test sends fragmented IP packets which have overlapping IP fragments. All devices tested eventually became unresponsive when the traffic volume increases beyond that devices ability to process packets. Figure 3.3 shows typical device behavior to denial of service tests. The brown triangle shows the rate packets are being transmitted to the target device. As the tester ramps the packet rate it periodically sends the target an instrumentation packet (a query which the tested device is known to support) 40
to test if the device is able to respond. The instrumentation packet may be a TCP session request on a supported port or an ICMP echo request or any other type of packet the target is known to be capable of responding to. The blue vertical lines show the target device responding to instrumentation requests. A taller blue line indicates a slower response time. The red dots indicate failed instrumentation request. As the packet rate increases devices become unresponsive. Some devices may hang or reset themselves when subjected to high packet rates. Many devices are unresponsive during the test, but, become responsive again when the packet rate returns to acceptable levels.
Figure 3.3
Denial of service test response time chart
Understanding the packet rate which causes a device to become unresponsive is important for system planning and for creating an effective denial of service mitigation approach. Figure 3.4 shows a typical availability chart for a single denial of service test against a device. The availability shows the percent availability (Y-axis), percentage of time that a device is able to respond to instrumentation requests, versus packet transmission rate (X-axis).
41
The availability chart can be used by utility engineers and network administrators to define a maximum threshold for traffic congestion at the switch or router within the substation for the different traffic types. Based upon testing results it is recommended that utilities monitor network traffic volume in control system networks to detect transmission of high volumes of traffic. Monitoring systems should alert a human administrator to enable mitigation. Routers in the control system network may be configured to limit traffic sent to the PMU or PDC or may be configured to close ports sourcing offensive amounts of network traffic. Automatically closing router ports is potentially dangerous since critical traffic may use the port. A thorough system review should be performed before enabling automatic port closure. Maximum traffic rate thresholds should be defined for all relevant traffic types.
Figure 3.4
Availability chart from congestion testing
It is important to understand PMU and PDC behavior after DOS event completes. Testers should confirm that tested devices and network appliances in the route do not 42
queue large volume of IEEE C37.118 data packets which then leads to a synchrophasor stream which is perpetually delayed. PDC hold data from on time PMU to wait for data packets from late arriving PMU streams. A denial of service attack can have a persistent effect if the attacked PMU’s date stream becomes consistently late after the attack. PDC eventually drop old data packets and begin to interpolate. PMU and PDC which recover from a denial of service attack should clear their transmit queues to avoid the aforementioned effects. 3.4.2
Protocol mutations A second method to test for denial of service vulnerabilities is through protocol
mutation, also known as protocol fuzzing. Fuzzing is a general term for a type of software testing technology that uses unexpected input and monitors for exceptions for discovering faults in software. The results of fuzzing can help to ensure that exceptions can be handled appropriately, filter out unwanted values while allowing the full range of acceptable inputs [49]. In the rest of this chapter, it is abbreviated as fuzzing. The program that performs fuzzing work is called fuzzer. Two types of protocol mutation methods are used in this work. One is brute force fuzzing that creates network packets with random changes [49]. The fuzzer that implements brute force fuzzing starts from a valid sample of a protocol or data format and keeps mangling every individual bit or byte or word within the data packet. This type of fuzzing is pretty straightforward because all it needs to do is to modify the data and pass it along to the target. It requires little research to the format of the data massage and therefore it is also called “dumb fuzzing”. The other type of fuzzing is through manually modifying protocol packets according to how the protocol specification works and therefore it is relatively “smart”. 43
This type of fuzzing is called “smart fuzzing” in this work. In smart fuzzing each field in a mutated packet’s header, payload, and trailer is assigned a set of variant values that are designed specifically for the target. The selection of protocols for mutation testing was based on port scanning and device manual review results. Variant values for a field may include legal values and illegal values. The protocol mutation tester creates a set of packets which include all combinations of all fields with all variant values. The number of combinations grows quickly and protocol mutation can be a slow process. However, the benefit of protocol mutation, no matter dumb or smart is that combinations of packet fields which may not be thought of by a human can be tested to confirm that the device network stack does not hang or reset when the test packet is processed. Protocol mutation is intended to discover vulnerabilities before they are discovered by an adversary and become exploited zero day vulnerabilities. All communication protocols supported by a device are tested. Mutated protocols for the PMU and PDCs included ARP, TCP, UDP, IP, ICMP, DNP3, MODBUS, IEEE C37.118, and HTTP. The protocol mutation testing of these protocols are done using the MU 4000 Network analyzer except IEEE C37.118 where a fuzzing framework is developed. 3.4.2.1
MU-4000 network analyzer The MU-4000 Network Analyzer was used to perform protocol mutation testing.
As with the denial of service testing the tester sends groups of mutated packets to the target device. The tester periodically sends instrumentation packets (queries which the tested device is known to support) to confirm that the device under test can still respond. Protocol mutation requires two types of instrumentation packets. The first 44
instrumentation is a communication packet and response pair which is known to work on the target device. This instrumentation is typically unrelated to the mutated protocol. This instrumentation confirms the device network stack is still functioning and responsive. It is possible the portion of the network stack associated with the mutated protocol will hang without affecting other parts of the network stack. For example, a UDP mutation may hang the UDP stack, but leave the TCP stack functioning correctly. The second instrumentation request type is a known good packet of the type being mutated. This instrumentation confirms the portion of the network stack related to the mutated protocol is still functioning and responsive. Some services were capable of assignment to a variable TCP or UDP port number. In this case, protocol mutation was repeated for multiple ports. A good strategy for testing services with variable ports is to repeat testing with port assigned to multiple port numbers in the well known space (0-1023), multiple port numbers in the registered port range (1023-49151), and multiple port numbers in the private range (49152-65535). Some services are capable of assignment to a fixed set of port numbers. In this case, it is good practice to test at all legal port assignments. The MU-4000 includes built-in protocol mutation capabilities for many well known protocols. Some protocols are not supported. For example, IEEE C37.118 is not natively supported. Also, newly developed protocols may not initially be supported. The MU-4000 is capable of learning protocols from Wireshark packet captures. After learning a protocol the MU-4000 scenario builder can generate protocol mutations to test a device. The scenario builder feature was used for IEEE C37.118 protocol mutation. Only frames received as input by the target device should be mutated and sent to the 45
target device. Mutated IEEE C37.118 commands frames were mutated and sent to PMUs. Mutated IEEE C37.118 configuration and data frames were sent to the PDCs. Protocol Mutation testing may indentify individual packets which cause device failures including hanging network stacks or causing the device under test to reset itself. Protocol Mutation testing may also indentify combinations of packets which cause similar device failures. In both cases careful study is required to determine the root cause of the failure. Mitigation of detected vulnerabilities can be achieved with a firewall or signature based intrusion prevention system (IPS) rules to block problem traffic. Vulnerabilities identified using protocol mutation should also be reported to the device vendor. Protocol mutation identified multiple issues on devices tested for this work. Issues included crashing of individual network services, crashing of applications running on devices, and unintended soft resetting of affected devices. The MU-4000 works best as a client which sends mutated packets to a server. The MU-4000 uses randomization algorithms and constrained randomization algorithms to fuzz servers. The MU-4000 is less capable of fuzzing server to client responses, especially responses which are dependent upon the previous packet sent from the client. To overcome this issue an in-line fuzzer was developed to mutate server to client packets. The current version of the in-line fuzzer simply varies random bits of the server to client response to attempt to break random protocol rules. This method has proven effective at identifying vulnerabilities. A fuzzer is needed which properly mutates server to client responses based upon previous client to server packets and system state. The next section is analysis of the needs of such a fuzzer for IEEE C37.118 packets.
46
3.4.2.2
A fuzzing framework for IEEE C37.118 protocol The fuzzer for IEEE C37.118 protocol must be able to fuzz server to client
responses, especially responses which are dependent upon the previous packet sent from the client. To achieve this a fuzzing framework was developed to mutate server to client packets. The current version of the fuzzing framework is able to perform both dumb fuzzing and smart fuzzing for IEEE C37.118 packets. Dumb fuzzing flips bits of the server-to-client response to attempt to break random protocol rules, while smart fuzzing mangles the specific fields of data packets according to the protocol specifications. The fuzzing framework is designed based on the communication patterns of the IEEE C37.118 protocol. The fuzzing framework mutates server to client responses based upon previous client to server packets and system state. There are four types of packets defined in IEEE C37.118 protocol [50]: header, command, configuration, and data. The communication pattern between PMU and PDC is depicted in Figure 3.5 where PMU is the server and PDC is the client. The IEEE C37.118 protocol is an application layer protocol that can be carried in the TCP payload or UDP payload. Since UDP protocol is much faster and easy to implement, in this testing the communication between the PMU and PDC is configured to use IEEE C37.118 based on UDP. Communication is initiated by the PDC (i.e. client) through sending a command frame that tells the PMU (i.e. server) to start to stream measurements to the PDC. The command frame can also deliver other commands such as a stop command, request configuration frame command, and others. The PMU which receives the start command then knows where to send its C37.118 packets. However, before sending the data frames the PMU sends a configuration frame to the PDC in which the PMU communicates the organization and size of its data frames. 47
There are two types of configuration frames: configuration frame 1 and configuration frame 2. The configuration frame 1 contains the constant part of the PMU configuration and therefore it usually needs to be sent only once the first time PMU is connected to PDC. The configuration frame 2 contains a variable part of the PMU configuration e.g. number of phasors. Hence the configuration frame 2 has to be sent every time the PMU is connected to the PDC such that PDC will know whether there are changes in the PMU and update them. The PMU then starts to send the data frames at a rate ranging from 30 to 120 frames per second. The data frame contains real time phasor data e.g. magnitude, phase angle, frequency, analog, digital data. The Header frame contains up to 80 characters of human readable/ASCII with comments on the PMU, the data sources, scaling algorithms or any other information. The Header frame is rarely used.
Command Frame Configuration Frame 1/2
PMU
Data Frame
PDC
Header Frame
Figure 3.5
PMU and PDC communication pattern
Only frames received as input by the target device should be mutated and sent to the target device for the purpose of testing whether the target can handle the mutated packets properly. According to different synchrophasor devices since each of them 48
accepts different frames shown by the arrows in Figure 3.5, different fuzzing strategies are used. For testing the PDC, three types of frames should be considered: configuration frame 1 or 2, data frame, and the header frame. As for the PMU, the command frame and the header frame are mutated for testing. A typical fuzzing framework usually consists of three parts: test case generation; target monitoring, and logging pertinent data on failure [49]. A fuzzing framework for network protocols requires a tool to capture valid protocol traffic [51]. One such tool can be a sniffer that dynamically captures the network packets at runtime. The structure of the fuzzing framework designed for IEEE C37.118 protocol is shown in Figure 3.6. The fuzzing framework is executed on a Linux computer that connects to the substation switch. The fuzzing framework consists of five major parts: man-in-the-middle (MITM) server, protocol parser, fuzzing engine, validation engine and log, in which the MITM server captures the IEEE C37.118 protocol packets; the fuzzing engine generates the test cases; validation engine monitors the devices under test and log stores not only the test cases that crash the devices but also the activities of the fuzzing framework.
49
Validation Engine
PMU
MITM Server
PDC
Protocal Parser Log Engine Configuration File
Command Frame Fuzzer
Figure 3.6
Fuzzing Engine
Configration Frame Fuzzer
Data Frame Fuzzer
Header Frame Fuzzer
Structure of the fuzzing framework for IEEE C37.118 protocol
The MITM server is implemented using Ettercap . Ettercap is a sniffer written in C language that features passive and active sniffing in the communication channel, content filtering on the fly and many other MITM attacks. The Ettercap in this fuzzer redirects all the packets between PMU and PDC to the fuzzing framework PC by spoofing the Media Access Control (MAC) addresses of the PMU and PDC such that it pretends to be the PMU for the PDC and pretends to be the PDC for the PMU. This is achieved by sending the Address Resolution Protocol (ARP) packets to the victim devices with the MAC address replaced with the MITM server’s. Ettercap then captures 50
the IEEE C37.118 packets off the wire, layers the new IEEE C37.118 packets onto UDP packets and finally transmits the new packets onto the network. The new IEEE C37.118 packet has its fields altered according to the type of fuzzing chosen. The content of IEEE C37.118 packet is modified using Scapy [54]. Scapy is an open source Python program that provides a Domain Specific Langurage (DSL) that enables the users to describe any kind of packet using the Python syntax and interpreter. In the fuzzing framework, Scapy is used to accomplish IEEE C37.118 packet assembly, packet editing, packet re-play and packet decoding. When an IEEE C37.118 packet is captured by the MITM server, it hands the packet to the “protocol parser” where the packet is decoded into one of the four types of the IEEE C37.118 frames. The protocol parser is a Python module that has been developed to describe the IEEE C37.118 protocol based on DSL provided by Scapy. The frame type field is examined to determine which type of IEEE C37.118 frames the packet belongs to. Then the packet will be forwarded to the corresponding fuzzer for mutations by the “fuzzing engine”. The fuzzing engine is composed of four frame fuzzers that mutate different types of IEEE C37.118 frames. Each frame fuzzer accomplishes packet editing by applying either dumb fuzzing or smart fuzzing to the packet. The smart fuzzing has predefined mutations to the fields of the packet according to the protocol standard. For example, the field FRAMESIZE of the packet is changed such that it does not match the actual size of that packet [56]. Besides the common fields that all types of frames have, each type of frame also has its unique fields. For example, the IEEE C37.118 command frame has two unique fields. One of them is the CMD field that is a 2 bytes field specifying the 51
command. There are 6 defined values for this field. However, a smart fuzzer for command frame is designed to replace the CMD with a value that is not one of the 6 legal values. 3.4.2.2.1
Smart fuzzing
Smart fuzzing mutates the packets based on the protocol specifications. IEEE C37.118 includes 4 types of packets; header, command, configuration, and data. Header and command packets are transmitted from the PDC to the PMU. Configuration and command packets are transmitted from the PMU to the PDC. All 4 frame types include a 2 byte synchronization word (SYNC). The first byte of the SYNC is defined as always 0xAA. It is important to check other values for this field. The second byte of the SYNC field includes a reserved bit, 3 bits to designate the frame type, and 4 bits for version number. There are 5 legal frame types. Illegal frame types should be sent; 0b101, 0b110, 0b111. All 16 possible version number possibilities should be sent; though only some have been defined to date. All 4 IEEE C37.118 frame types include a 2 byte frame size field. Frames should be sent with frame sizes which do not match the actual FRAMESIZE. Also, very large frame sizes should be sent to test for buffer overflow possibilities. A 4 frame types include a 2 byte IDCODE field. This value is the PMU or PDC ID number. The values 0 and 65535 are reserved and therefore should be tested. PMU and PDC typically have preprogrammed ID values. Frames with IDCODE values not assigned to the target device should be tested. All 4 IEEE C37.118 frame types include a 4 byte SOC field. The SOC field is a time stamp that counts the number of seconds since Jan-01-1970. The field is limited to 136 years which means the max value is 0xB34C00. Above 0xB34C00 the count is supposed to roll over. It is 52
important to test values greater than 0xB34C00. All 4 IEEE C37.118 frame types include a 4 byte FRACSEC field. This field is broken into two parts. The most significant 4 bits of FRACSEC (bits 31-28) are used to document the presence of a leap second. Bit 31 is reserved and therefore transmitting a 1 in this bit should be tested. Bits 30 (LEAP) indicates a leap second is occurring. Bit 29 (LEAPED) indicates a leap second occurred in the last 24 hours. Bit 28 (TOLEAP) indicates a leap second will occur in the next second. Various fuzzing scenarios can be derived for these fields. First, the leap second bits should be asserted at times and dates when they are not expected. Seconds, LEAP should be set without first setting TOLEAP in the previous second. LEAP should be set without setting LEAPED in the following second and 24 hours. TOLEAP should be set with no following LEAP assertion. LEAPED should be asserted when not preceded by TOLEAP or LEAD combinations. Finally, all three bits (LEAP, LEAPED, TOLEAP) should be asserted at random times. The next 4 bits of FRACSEC (bits 27-24) are defined by a table to indicate clock faults and clock synchronization values. There are multiple reserved values (0b1100, 0b1101, 0b1110) which should be tested. The remainder of the FRACSEC field is a number fraction of a second. This value is depended upon the TIMEBASE value from the PMU configuration frame. This value can be changed when configuring the PMU. FRACSEC values which do not match with the programmed TIMEBASE should be tested. Finally, All 4 IEEE C37.118 frame types include a 2 byte CHK field which is a 16-bit CRC. Frames with invalid CRC values should be tested. Some fuzzers make changes to valid packets by randomly flipping bit values. In this case the fuzzer should ensure that the CHK field is correct to ensure that more that the CRC logic is being tested. 53
The IEEE C37.118 data frame has multiple unique fields. Since data frames are transmitted from the PMU to PDC fuzzing data frames is limited to the PDC. The STAT field is a 2 byte field which provides PMU status. This field includes multiple reserved and user defined bits. All combinations of these bits should be tested. The PHASORS, FREQ, DFREQ, ANALOG, and DIGITAL fields all vary in size according to values in the configuration frame.
The configuration frame is sent from the PMU to PDC during
initial session start-up. Tests should include varying the number of values in these fields to not match the configuration frame definitions. Variation should include 0 bytes, larger, and smaller number of bytes for each field. PDC concentrate multiple synchrophasor streams from PMU into a single stream of IEEE C37.118 data frames. As such the size of the data frames output from PDC varies according to the number of PMU which is defined in a configuration from sent from the PDC to its upstream client, an EMS, state estimator, or openPDC. It is important to test varying data frame sizes. Very large sizes should be tested to check for buffer overflow vulnerabilities. Also, it is important to test data frame sizes which do not match the configuration frame. The IEEE C37.118 configuration frame has multiple unique fields. Since configuration frames are transmitted from the PMU to PDC fuzzing data frames is limited to the PDC. Fuzzing PDC configuration frames is a challenge because the PDC typically requests the configuration frame only once when the session is initiated. The PDC can be forced to request a configuration frame update by asserting bit 10 in the STAT word of a data frame send from the PMU to PDC. Bit 10 of the STAT word indicates the configuration has changed and the PDC should request to read the configuration files. The TIME_BASE field is 4 bytes. The most significant byte of 54
TIME_BASE is reserved. Tests should be conducted with these bits set to non legal values (0-255). The NUM_PMU field 2 byte field which specifies the number of PMU in a data frame. This field can legally be up to 65535. However, the actual limit is less than 65535 since the maximum FRAMESIZE is 65535. The actual limit depends upon the values of PHNMR, ANNMR, DGNMR, and FORMAT which set the number of phasors, analog values, digital values, and format of said values for each PMU in the frame. Testing combinations of NUM_PMU and the PHNMR, ANNMR, DGNMR, and FORMAT which result in greater than 65535 bytes in the data frame is important. Also, testing combinations of NUM_PMU and PHNMR, ANNMR, DGNMR, and FORMAT which result in do not match the data in the data frames is important. The CHNAM field is specified as 16*(PHNMR+ ANNMR +16 *DGNMR). Testing combinations of CHNAM, PHNMR, ANNMR, and DGNMR which do not adhere to the previous definition is important. The FORMAT field specifies the data type of FREQ, DFREQ, PHASORS, and ANALOG fields from the data frame. Testing combinations of FORMAT which do not match the values in the FREQ, DFREQ, PHASORS, and ANALOG fields in the data frame is important. Bits 15-4 of the FORMAT field are reserved. Testing non-zero fields in this field is important. The PHUNIT field of the configuration frame is 4 bytes. The most significant byte has legal values of 0 or 1. Testing should be completed to send values 2-255 in this byte. The ANUNIT field is a 4 byte field. The most significant byte of this field has several constraints. Values 3-4 are undefined by the specification. Values 5-64 are reserved. Values 65-255 are user definable. All values from 3-255 should be tested. THE DIGUNIT is 4 byte mask of the DIGITAL field from the data frame. Bits 63-48 and 32-16 are a mask which indicates the 55
normal status of the digital bit corresponding to that bit lane. Test should be conducted to change normal status bit values for bits not in use in the DIGITAL field of the data frame. Test should also be conducted to inverts the normal value for bits which are in use in the DIGITAL field in the data frame. Bits 47-33 and 15-0 are masks which indicate which bytes are in use. Tests should be conducted to deselect DIGITAL field bits which are actually in use and select DIGITAL field bits which are not actually in use. The FNOM field is a 2 byte field which sets the nominal frequency. Only two values are allowed 0 and 1. Tests should be conducted for values from 2-65535. The DATA_RATE field is a 2 byte signed integer representing the number of frames per second. Typically this value will be 30, 60 or 120 frames per second. However, the legal values are [-32767, 32767]. Testing should be conducted for multiple values throughout this range. Additionally, the value 0x8000 should also be tested since it fits in the field but is not specified as legal since it is effectively -0. CFGCNT is a 2 byte field which indicates the number of configuration changes since installation. This value should be varied out of order and changed to large values to test PDC response. The IEEE C37.118 command frame has two unique fields. Command frames are sent to PMU. Command frames may also be sent to the upstream facing interface of the PDC. The CMD field is a 2 byte field specifying the command. There are 6 defined values for this field. Undefined values should be sent to the device to test behavior. EXITFRAME is a variable length field from 0-65518 bytes. This size is limited by the FRAMESIZE field in the command frame. The value of EXITFRAME is user defined. Tests should be conducted to send non-zero size EXITFRAMEs. Also, test should be
56
conducted in which the FRAMZSIZE is too large or too small based upon the size of the EXITFRAME field. The IEEE C37.118 header frame has one type of unique field. Header frames are read from the PMU and therefore fuzzing of header frames is directed at the PMU. The header frame may have up to K ASCII bytes of data. The number of bytes of data is the FRAMESIZE – 16. The maximum number of data bytes is therefore 65519. Header frames should be tested with non-ASCII characters in the data bytes of a header frame. Header frames with non-printable characters should also be tested in the data byte fields. Finally, testing should be conducted when the FRAMESIZE specified incorrect for the number of data bytes transmitted. 3.4.2.2.2
Dumb fuzzing
Dumb fuzzing perform packet mutation without knowing the protocol specifications. Therefore, a dumb fuzzer create test cases by flipping bits in a capture packet. In this work, the dumb fuzzing is implemented through a file fuzzer – ZZUF [53]. ZZUF was originally designed as an application input fuzzer that intercepts file operations and changes random bits in the program’s inputs. Therefore ZZUF has no ability to mutate network packets. To resolve this, the about-to-be-mutated IEEE C37.118 packet is written into a temporary file as binary strings. Instead of fuzzing the packet, the binary file is mutated by ZZUF. The output from ZZUF is layered upon a UDP packet and forwarded by the MITM server to the target. How ZZUF mutates the binary file is exclusively determined by two of its parameters: fuzzing ratio and seeds. This feature of ZZUF is convenient to the tester for easily reproducing the mutated packets and later replaying the bugs. The fuzzing ratio 57
indicates the proportion of bits that ZZUF changes. A fuzzing ratio of 1/command frame length (bits) was used to cause ZZUF to invert 1 bit per fuzzed packet. The fuzzing ratio is approximate. The actual test results show each packet had 1-10 randomly changed bits. The fuzzing results can be reproducible by specifying the “seed” parameter if the ratio is fixed. For example, if the ratio is fixed to 0.01 which means 1% of bits in the packet are inverted, the seed number 1 will always choose the same bits for inversion by ZUFF. Therefore, if a mutated packet crashes the target device, we are able to reproduce this packet if we recorded the original packet and the ratio and seed. This task is done by the logging system of the fuzzing framework. The logging system records all activities of the fuzzing framework as well as the malicious packets that crash a device under test. The validation system starts sending validation packets through the MITM server after each mutated packet being sent to the target. There are two methods in this framework to validate whether the target survives the malicious input: Internet Control Message Protocol (ICMP) echo and HTTP request. The first method is suitable for all types of devices that are networked to the switch while the second method is only available to the devices that are running an HTTP server. The ICMP validation sends ICMP echo request packets and expects a response from the target device. The HTTP validation sends a “GET” request and expects the webserver to return a webpage. The tester can choose either or both as the validation method. If the target device fails to respond to the ICMP request or HTTP GET request it will be regarded as a crash and then the original packet (packet before being mutated) is recorded in the file system and the ratio and seed information about ZZUF is logged for the future analysis.
58
3.4.2.2.3
Fuzzing algorithms for different IEEE C37.118 frames
This section describes four algorithms to mutate IEEE C37.118 frames using both smart fuzzing and dumb fuzzing via ZUFF. The fuzzing ratio for ZUFF is fixed such that only 1 bit of the frame is flipped. 3.4.2.2.3.1
Configuration Frame Fuzzing
The configuration frame fuzzer alters data frames and forwards these altered configuration frames to the device under test, i.e. PDC. Before the fuzzing starts the connection between PMU and PDC needs to be established. This is done by the MITM server by examining whether data frames streaming from the PMU to PDC have been captured. To provide a large set of fuzzable configuration frames the MITM server makes a change data frames request. A data frame has its STATUS field changed to value of 0x0004. This informs the PDC that the configuration of PMU has been changed and thus the PDC should send a command frame requesting the new configuration frame. The approach to fuzz a configuration frame is shown in Table 3.3. 3.4.2.2.3.2
Data Frame Fuzzing
The data frame fuzzer alters data frames and forwards these altered data frames to the device under test, i.e. PDC. Data frame fuzzing only requires a connection between PMU and PDC to be established before running the MITM server. The algorithm for fuzzing the data frame is listed in Table 3.4. 3.4.2.2.3.3
Command Frame Fuzzing
The command frame fuzzer alters command frames and forwards these altered command frames to the device under test, i.e. PMU. A simple way to provide a large set 59
of fuzzable command frames is to use SCAPY to generate a normal command frame from which the mutated command frames are created. This is done by the protocol parser. In this case the MITM server does not necessarily need to perform ARP spoofing to intercept the connection between PMU and PDC. Instead, the MITM server initiates the connection to PDC by sending a “Transmission On” command. The PMU responds to this command by starting to stream data frames. When the fuzzer detects the connection between the MITM server and PDC has been established the fuzzing process starts. Besides the two validation methods, ICMP echo request and HTTP GET request, there is one more way to inspect whether the target device survived the command frame fuzzing. This is through examining whether the target device continues streaming data frames. This is necessary because it is possible that the device’s network stack is working properly (by responding ICMP echo request) but the Synchrophasor processing unit has crashed due to the fuzzing. However, this validation is not suitable for fuzzing the command “Transmission Off” as this command is originally used to stop the streaming. Algorithm 3 lists the approach to fuzz a command frame. There are 6 types of command frames: “Transmission On”; “Transmission Off”; “Send Header”; “Send Configure frame 1”; “Send Configure frame 2” and “Send extra frames”. To fuzz all 6 types of frames a loop is created between step 2 and step 16 such that the protocol parser can create the 6 types of command frames. The algorithm for fuzzing command frames are summarized in Table 3.5. 3.4.2.2.3.4
Header Frame Fuzzing
The header frame fuzzer alters header frames and forwards these altered header frames to the device under test, i.e. PDC. This fuzzing can performed after the connection 60
between PMU and PDC is established. To provide a large set of fuzzable header frames, a command frame that requests a header frame from PMU needs to be created by the fuzzer and sent to the PMU. This informs the PMU to send a header frame from which the mutations can be made. The approach to fuzz a header frame is shown in Table 3.6.
61
Table 3.3
Algorithm for configuration frame fuzzing
Algorithm 1 configuration frame fuzzing approach 1: Initiate fuzzing ratio and set seed number to 0. 2: MITM server captures a packet and hands to Protocol Parser 3: if the packet is data frame: 4:
MITM server alters data frame to cause configuration frame transmission.
5:
go back to step 2
6: elseif the packet is configuration frame: 7:
ZZUF alters bits in the frame OR smart fuzzer for deliberate changes in specific fields
8: else
go back to step 2
9: MITM server forwards altered frame to device under test. 10: Validation Engine sends ICMP echo request or/and HTTP GET request to the device. 11: if responses are captured: 12:
(device survived) pass
13: else
recorder the configuration frame, fuzzing ratio and
the seed number. 14: Increase seed number by 1 15: if seed number == maximum seed number: 16:
stop fuzzing
17: else
go to step 2
62
Table 3.4
Algorithm for data frame fuzzing approach Algorithm 2 data frame fuzzing approach
1: Initiate fuzzing ratio and set seed number to 0. 2: MITM server captures a packet and hands to Protocol Parser 3: if the packet is data frame: 4:
ZZUF alters bits in the frame OR smart fuzzer makes deliberate changes in specific fields.
5: else
go back to step 2
6: MITM server forwards altered frame to device under test. 7: Validation Engine sends ICMP echo request or/and HTTP GET request to the device. 8: if responses are captured: 9:
(device survived) pass
10: else
recorder the data frame, fuzzing ratio and the seed
number. 11: Increase seed number by 1 12: if seed number == maximum seed number: 13:
stop fuzzing
14: else
go to step 2
63
Table 3.5
Algorithm for command frame fuzzing Algorithm 3 command frame fuzzing approach
1: Initiate fuzzing ratio and set seed number to 0. 2: MITM server sends a “Transmission on” command 3: if the received packet is NOT data frame: 4:
go to step 2
5: else: 6:
Protocol Parser creates a normal command frame
7:
ZZUF alters random bits in the frame or smart fuzzer makes deliberate changes in specific fields
8:
MITM server forwards altered frame to device under test.
9:
Validation Engine sends ICMP echo request or/and HTTP GET request to the device.
10:
if responses and data frames (not suitable for “Transmission off” command) are captured:
11: 12:
(device survived) pass else recorder the command frame, fuzzing ratio and the seed number.
13:
Increase seed number = seed number + 1
14:
if seed number == maximum seed number:
15:
stop fuzzing
16:
else go to step 2
64
Table 3.6
Algorithm for header frame fuzzing Algorithm 4 header frame fuzzing approach
1: Initiate fuzzing ratio and set seed number to 0. 2: MITM server captures a packet and hands to Protocol Parser 3: if the packet is data frame: 4:
MITM server sends a command frame to cause header frame transmission. Then go to step 2
5: elseif the packet is header frame: 6:
ZZUF alters bits in the frame OR smart fuzzer for deliberate changes in specific fields
7: else
go to step 2
8: MITM server forwards altered frame to device under test. 9: Validation Engine sends ICMP echo request or/and HTTP GET request to the device. 10: if responses are captured: 11:
(device survived) pass
12: else
recorder the configuration frame, fuzzing ratio and
the seed number. 13: Increase seed number = seed number + 1 14: if seed number == maximum seed number: 15:
stop fuzzing
16: else
go to step 2
65
The structure of the in-line fuzzer is also suitable for fuzzing other network protocols. As long as the protocol to be fuzzed is an open standard a corresponding protocol parser can be developed. This is referred to as “white box” testing. For proprietary protocols in which protocol specification is unavailable only dumb fuzzing is possible. The next section provides a methodology to fuzz a typical energy management system in which an intelligent dumb fuzzing framework is proposed. 3.4.3
Energy management system fuzzing framework The energy management system (EMS) consists of a set of computer applications
and databases that help operators in electricity utilities perform monitoring, control, and optimization of the performance of the electricity power grid. In general, the EMS system structure is shown in Figure 3.7 where the client is an application programming interface (API) that provides a human machine interface (HMI) to the operators. The client API communicates with different applications that may be located in a super server. Each application performs corresponding analysis and calculation according to the requests from the client. Multiple applications may run simultaneously. The databases provide necessary data and operations descriptions for the applications and they can be running in the same super server or distributed in different super servers. The communication between the client API and applications usually uses proprietary protocols that are not open to the public. The EMS system fuzzing framework in this work is meant to test applications within the EMS system that listen on a network interface of the super server. The fuzzer sends anomalous input to attempt to crash EMS applications in order to reveal the security vulnerabilities of the EMS system. The structure of fuzzing framework is not 66
only limited to EMS super server but also could be used as a network fuzzer to any other distributed database systems. The test bed for testing the proposed fuzzing framework has one client machine and one super server. This test bed assumes that client can be run either remotely or locally along with an application. The test bed also assumes that the tester is able to access the application machine and source code for the purpose of debugging. In addition, the assumption that the protocol does not have checksum validation or the checksum is disabled in the communication is necessary.
Super Server(s)
... DB 1
App 1
DB n
...
App n
Client (Human-machine Interface)
Figure 3.7
A general structure for EMS system
67
The fuzzing framework for the EMS system is based on the Basic Fuzzing Framework (BFF) [55]. The BFF was originally designed to test applications running locally on Linux and Mac OS X platforms. The fuzzing framework designed for this work aims to test applications running over a network with the proprietary protocol. Nevertheless, the design is consistent with the four functions of a typical fuzzing framework as stated in the previous section. The structure of the fuzzing framework is depicted in Figure 3.8. The fuzzing method for this framework is limited to dumb fuzzing because the protocol specifications are not available. And the fuzzing framework fuzzes application layer protocols carried by the TCP/IP protocol.
Super Server
IP: 10.0.0.1
Client
IP: 10.0.0.2
Engine Configuration File
MITM Server
Application
Fuzzing Engine
Debug Agent
ZZUF
Figure 3.8
Log
Structure of fuzzing framework for fuzzing EMS system super server
The fuzzing framework runs on the super server along with the EMS applications. The fuzzing framework is composed by five components: MITM server; fuzzing engine; 68
fuzzer: ZZUF; Debug Agent and the log. The applications running on the super server are the targets of all fuzzing tests. The applications are configured to listen on ports of the local network interface (127.0.0.1) of the super server. The client (10.0.0.1) in Figure 3.8 (outside the boundary of super server) is configured to communicate with the super server over the local area network at 10.0.0.2. However, rather than using a sniffer as with the fuzzing framework for the IEEE C37.118 protocol, the MITM server is a multithreaded process that runs on the super server and listens to TCP ports associated with IP address of 10.0.0.2. When the client sends requests to 10.0.0.2, one of the threads of MITM server captures these packets and forwards them to the application that is listening to the destination port. The MITM server then will act like a proxy for relaying traffic from the client to appropriate application on the super server. The fuzzer ZZUF mutates packets captured by the MITM server and ZUFF is controlled by the fuzzing engine according to some algorithm. In the engine configuration file, parameters for ZZUF are specified such as start seed and maximum seed. A debug agent with local access to the application source code is attached to the application process to detect when an exception is raised. The debug agent uses GDB. When GDB detects a program exit number other than 9 (which is normal exit). It records the debugging information to the log and also communicates with the fuzzing engine to record the packet along with seed number and fuzzing range. 3.5
Developing Snort rules for detecting attacks Snort rules are capable of tracking the number of packets from a given source in a
specified time period. Such Snort rules can alert if a flooding attack is detected. A SYN flood rule for an IEEE C37.118 interface should take into account the normal and 69
extraordinary, yet still valid, volumes of traffic expected on the network interface. In normal operation, using IEEE C37.118, the PDC sends commands to the PMU to request a configuration file. The PMU responds with a configuration file and then begins to stream synchrophasor measurements, data packets, at 30, 60, or 120 packets per second. This process should generate one TCP session and therefore only one TCP SYN packet should be sent per synchrophasor session. A PDC may connect to multiple PMU and therefore may have multiple active TCP sessions on port 4712, the port assigned for IEEE C37.118. PMU and PDC also commonly have other TCP services. Each open port of the tested PMU and PDC was tested with TCP SYN flood attacks. In all case devices were 100% responsive to TCP SYN floods of less than or equal to 1000 packets per second. The two rules below detect TCP SYN flood attacks against any port on PMU or PDC. The rules alert for more than 1000 TCP packets in one second. This threshold value can likely be significantly decreased without causing spurious alerts.
alert tcp any any -> $PDCIP any (msg:“Syn Flood to PDC”;\ flags:S,CE; flow:to_server; threshold: type threshold, track by_src, count 1000, seconds 1; priority:3; sid:1000001;)
alert tcp any any -> $PMUIP any (msg:“Syn Flood to PMU”;\ flags:S,CE; flow:to_server; threshold: type threshold, track by_src, count 1000, seconds 1; priority:3; sid:1000002;) 70
Flooding attacks performed in device testing included ARP floods, IP floods, TCP SYN floods, TCP SYN FIN floods, UDP floods, ICMP floods. In each case SNORT rules can be derived to detect the floods. Protocol mutation testing was performed with the MU-4000. Protocol mutation, also known as fuzzing, checks device response to broken protocol rules. Protocol mutation can be performed at any network layer. In this section we provide MODBUS/TCP and IEEE C37.118 protocol mutation examples. One MODBUS/TCP device tested reset itself when the LENGTH field of was less than the actual length remainder of the MODBUS/TCP packet. The rule below confirms that the specified bytes remaining are actually in the packet. This rule was taken from a rule set developed by Digital Bond [57].
alert tcp $MODBUS_SERVER 502 $MODBUS_CLIENT any (flow:established;\ byte_jump:2,4; isdataat:0,relative; msg:"SCADA_IDS: Modbus TCP \ Incorrect Packet Length, Possible DOS Attack"; \ reference:url,digitalbond.com/tools/quickdraw/Modbus-tcp-rules; \ classtype:non-standard-protocol; sid: 1000003; rev:1; priority:2;)
Because much of this work was done under confidentiality agreement, other Snort rules written were not included in this chapter as they would indirectly divulge the
71
vulnerabilities identified in testing. In addition, a set of Snort rules are developed for malicious C37.118 packets as in [58], which were validated by aforementioned fuzzer. 3.6
Conclusion In this chapter, cyber security testing methodologies for synchrophasor system are
provided. Results of the testing were reported to the sponsoring electric utilities and to the hardware and software vendors to aid in understanding the impacts of cyber-attacks to the synchrophasor system and assist vendors and the utility to deploy defense mechanisms. Two fuzzing frameworks for network protocol and distributed computing systems were developed to identify vulnerabilities of synchrophsor devices and the energy management system. Different fuzzing methodologies were used depending on different characteristics of the target under test. The fuzzing frame work for IEEE C37.118 protocol can be used as an attack tool that modifies measurements carried by IEEE C37.118 data frames. Additionally, the fuzzer for IEEE C37.118 data frames can be easily changed to modify any value in C37.118 data frames but make the data frames still compliant with the protocol specification. Such frames therefore may not be detected by a traditional IDS such as Snort.
72
CHAPTER IV DETECTION FOR FAULT AND CYBER ATTACK IN POWER SYSTEM BY MINING SYNCHROPHASOR DATA
4.1
Introduction Situational awareness technologies have been studied and continuously improved
for decades. The need to continue situational awareness improvements is motivated by recent power disturbances which have led to large scale blackouts [59]. A power system disturbance, such as a transmission line fault, can initiate a chain of reactions which lead to a cascading blackout if timely actions from operators are not taken. Poor visibility across the power system may also cause the significance of an event to be misunderstood and lead to incorrect control actions by operators in control centers. Additionally, as power systems increasingly depend on communication infrastructures to provide the wide-area monitoring and control, power systems are exposed to the threat of cyberattacks. Cyber-attacks are another form of power system contingency. Attacks that target power systems can exploit vulnerabilities in control devices and communication links to corrupt the control and measurement signals [7][60], and interrupt monitoring algorithms [67]. Cyber-attacks which corrupt control and measurement signals can be disguised as power system disturbances or control actions. Situational awareness technologies are needed which distinguish between actual power system disturbances related to natural events, and cyber-attacks. The emphasis of this work is not on classifying disturbance 73
types as quite a number of methods have been proposed to do so in the power system, but on distinguishing between disturbances and cyber-attacks. There are three reasons it is important to distinguish disturbances from cyber-attacks. First, in the case that a cyberattack impersonates a disturbance or control action, proper classfication will lead to proper response. Calssifying a cyber-attack as a disturbance or control action can lead to improper response and cause an outage or other negative impact on the power system. Conversely, incorrectly classifying a disturbance or control action as a cyber-attack can lead to improper response within the information and communications technology (ICT) system. Second, a single classifer which idenitfies all types of power system contingiences is needed as an input to automated event response algorithms such as autonomic management frameworks, system integrity protection schemes (SIPS) [13], and wide area protection systems (WAPS) [12]. This work presents a methodology to mine the patterns for disturbances and cyber-attacks using a two-dimensional graph from logged heterogenuous system data, use common paths in the graph as signatures of each type of modeled scenario, and finally, to classify specific disturbances and cyber-attacks. For proof of concept, in this work we consider disturbances as different types of line-toground and line-to-line faults. A new trend in power system situation awareness is the use of high-speed and time-synchronized data. Compared to traditional supervisory control and data acquisition (SCADA) systems that poll field sensors once per several seconds synchrophasor systems allow measurement of up to 120 samples per second. Synchrophasor systems provide measurements such as voltage, current, and frequency. Synchrophasor data was used in this work for two reasons. First, the mining common path algorithm uses a set of system 74
states in temporal order as a signature for each observed event type. High frequency synchrophasor measurements enable identification of fast moving power system events. Some power system events involve very fast changing behaviors and may last only a few milliseconds [61]. For example, zone 1 faults are typically set to be cleared instantly. The presence of a fault and system response of opening the breaker to clear the fault take just a few cycles. These events can be missed by slower speed measurement systems. Second, synchrophasor systems provide more accurate system state visibility due to the use of time synchronized measurements. The mining common paths algorithm can leverage this improved visibility to track events related to a single event from multiple synchronized sensors. The high measurement frequency and time-synchronized characteristic offered by synchrophasor systems create very large volumes of data and enable various applications including Wide Area Monitoring Systems (WAMS), Wide Area Protection Schemes (WAPS), and System Integrity Protection Schemes (SIPS) [12][13][11]. However, using synchrophasor data alone is not enough to detect cyber-attacks. Such example can be a cyber-attack that mimics a real fault by first injecting false measurements then tripping the relay. The status of other power system components such as relays and breakers is also available as time-synchronized data via synchrophasor systems [11]. Combining synchrophasor data with other system logs such as relay status log and network event monitor logs can extend the situational awareness capabilities provided by a synchrophasor system to detect cyber-attacks. But, this creates the challenge of how heterogeneous data sources can be merged to train and use such a classifier. This work provides a solution to this problem by proposing a data mining approach that leverages the time-stamped data to extract temporal patterns which can be 75
used to describe system behavior related to disturbances, control actions, and cyberattacks. Henceforth, disturbances, control actions, and cyber-attacks are collectively referred to as scenarios. In this work, a pattern for a scenario is presented as a common path that consists of a sequence of system states in temporal order. A system state in a common path is made up of multiple instantanious readings from available sensors from the system. One advantage of the common path is that it overcomes the difficulty in analyzing time domain waveforms by discovering the critical system states across very short time intervals (in milliseconds). These common paths are mapped into a state machine with two-dimensional coordinates for the scenario classification. The automatic process of discovering common paths is introduced by using a case study in a simulated 3-bus 2-line transmission system. For this work, a case study is provided which considers disturbances including symmetric and unsymmetric faults and different cyber-attacks that mimic the 1LG fault to confuse operators in the control center. The cyber-attacks studied in this work belong to masquerading and/or man-in-the-middle (MITM) attacks that target physical devices such as PMU and relays. These attacks may originate from a compromised node in control center, sending control commands or measurement packets covered by legitimate source IP addresses and legal packet formats. As such, it is assumeed the masquerading packets cannot be detected by traditional network intrusion detection systems. Validation of the mining common paths algorithm is based on simulated data because actual synchrophasor data is not available for researchers due to the proprietary nature of data, confidentiality issues, and lack of proper sharing mechanism among researchers and institutes. Additionally, data sets captured from 76
utilities contain a limited number of scenarios. This limits diversity in the data set. Some power system scenarios are rare, especially cyber-atacks, hardware-in-the-loop (HIL) simulation allows targeted dataset creation realistic scenarios captured from the same commercial devices found in utilities. The same data sets used in this work has also been used in [28] for synchrophasor data mining research. This work has three primary contributions. First, this work demonstrates a new classifier capable of distinguishing power system disturbances and cyber security attacks that interrupt power system control actions and mimic real disturbances. Second, we use the sequential pattern mining algorithm to mine fused heterogeneous data and create common paths for each known scenario. Third, power systems are dynamic in nature which leads to minor variations in system state for known scenarios. The classifier presented in this work learns by parsing datasets marked with scenario type. The training process results in an ordered sequence of system states, i.e. a path, representing each unique instance of a scenario found in the dataset. To avoid overfitting the mining common path algorithm was developed to discover critical states shared by similar paths representing the same scenario. The result of the common path agorithm is a merged set of paths representing all scenarios in the dataset. The classifier matches monitored state transition patterns to common paths of known scenarios to provide a specific classification of the observed behavior. The remainder of this work is organized as follows. Section 4.2 discusses the methodology, the process of mining common paths, and the classifier training and validation phases. Section 4.3 introduces the case study test bed, test data, and test data
77
preprocessing procedure. Section 4.4 presents the classification results of three experiments. Section 4.5 concludes this work and proposes future work. 4.2 4.2.1
Mining common path Sequential events for a power system scenario
1400 1200
B
Current (A)
1000 800 600
A
400
C
200 0
Time (ms)
Figure 4.1
Ideal vs. actual SLG fault and protection system response
Power system scenarios can be described as an ordered sequence of measureable events. For example, Figure 4.1 depicts phase a current magnitude during a single-lineto-ground (1LG) fault on a transmission line. The current magnitude can be quantized into 3 ranges; high, normal, and low which are represented by dark grey, white, and light grey shading on Figure 4.1. When the system is in a stable state, the current stays in the normal range, marked as node A in Figure 4.1. When the 1LG fault occurs, current increases to the high range via node B. The protection scheme will operate two relays, R1 and R2, at the both ends of the transmission line to open breakers and isolate the fault. Current magnitude then drops through node C to zero. If following six notations are used 78
to denote six events: “IR1=H” as node “B”, meaning “Current measured by R1 increases to High”; “IR2=H” for “Current measured by R2 increases to High”; “R1=Trip” for “Relay R1 trips”; “R2=Trip” for “Relay R2 trips”; “IR1=0” as node “C” for “Current measured by R1 drops to Zero”; “IR1=0” for “Current measured by R2 drops to Zero”. The timestamps of 1LG fault and resulting protection scheme operation can be represented by expression (1) where t(∙) stands for the timestamp of corresponding events.
tI R1 H tI R 2 H tR1Trip tR 2Trip tI R1 0 tR 20
(4.1)
Expression (1) assumes a fault which appears at both relays at the same time and assumes both relays operate at the same time. In fact, the fault may occur at different locations along the line leading to variations in the time each relay observes the fault and variations in relay operation time. Power systems are dynamic. In Figure 4.1, the dashed line shows an ideal waveform of current magnitude during a fault and the solid line graphs a waveform captured from Real Time Digital Simulator (RTDS) simulation of a 1LG fault. The actual waveform includes multiple variations from the ideal waveform. A power system’s response to load variation, fault location variation, and transient behaviors results in irregular waveforms. Such variations are reflected as dispersions in the timestamps of node B and node C for different instances of the same scenario. The dispersion in timestamps can be seen not only in the events related to the current magnitude but also events related to other features. Figure 4.2 shows box plots of timestamps of six events for three fault scenarios and one scenario where relays R1 and R2 are tripped by attackers. The Figure 4.2 x-axis is the set of observed events. The box 79
plots represent 40 instances of each scenario. To provide an ordered sequence the time stamp of the first event in a sequence was subtracted from timestamps of all later events in the sequence. The box plots and the interconnecting edges of a scenario are depicted using the same color. As shown in Figure 4.2, events take place in temporal order. Event timestamps vary due to system dynamics. For each scenario, a track can be drawn by connecting box plot medians. The tracks shown in Figure 4.2 generally agree with expression 1. Expert knowledge can be used to create similar expressions for all known system behaviors. However, time variation prevents these from serving as signatures for classification. This leads to the need for a graph to describe an ordered set of events describing a scenario while comprehending the variation in times stamps.
Figure 4.2
Distribution of timestamps for events
Tracks are an ordered list of events with measurements where each vertice is an event measured at a single sensor. The classifier presented in this work uses paths which 80
are an ordered list of system states where a state is snapshot of measurements from all available sensors at a given time instant. The steps taken to convert heterogeneous data collected during a scenario into a path will be introduced in next section. Path vertices are states and path edges are transitions between states. Paths are a means for providing stateful monitoring of the system. The training process performed to create paths is subject to over-fitting due to the time variations seen in Figure 4.2. In the over-fitting case, different instances of the same scenario may have different paths. A technique for mining common paths is provided below to identify shared critical states between a set of paths for a scenario leaving a common path which comprehends the variation in timestamps. 4.2.2
Mining common paths algorithm Describing the Mining Common Paths algorithm requires definitions of the
concepts of state, feature, sequence, and path. A state is used to represent a system’s instantaneous status. A state consists of a set of observed system measurements or features f as well as a normalized time stamp TS, i.e. S = {TS, f1,⋯,fn}. The value of a feature is read from a sensor. The possible values for a feature are in a range called its domain. A feature that has continuous values in its domain should be discretized to finite ranges to avoid an infinite state space. A path P is a list of observed system states arranged in temporal order according to their timestamps, namely Pi = {S1, S2, …, Sn}, ordered by increasing time. A sequence s is a subset of a path, i.e. s ⊆ P. We denote a sequence s by {Si+1, Si+2, …, Si+m}. A path P contains sequence s if all of the elements in s appear in P in the same order. In a set of sequences, a sequence is maximal if the sequence is not contained in any other sequences. 81
Let G be the set of all observed paths for a scenario Q so G = {P1, P2,…,Pn} where n is the number of observed paths for Q. A path supports sequence s if the sequence is contained in the path. Support can be defined as a metric in which the support of sequence s is the percentage of paths in G that contain sequence s. A common path for scenario Q is any sequence whose support is greater than a minimum support threshold and is maximal. There may be multiple common paths for a single scenario. Common paths reflect the states that occur most frequently for a scenario. The process of mining common path is similar to mining frequent sequence patterns as defined in [31]. Table 4.1
Example paths for a scenario T1
T2
T3
T4
T5
P1
S1
S2
S3
S4
S5
P2
S1
S2
S3
S4
S5
Delayed States
P3
S1
S10
S2
S3
S4
S5
Extra States
P4
S1
S11
S3
S4
S5
Modified States
P5
S21
S22
S23
S24
S25
Error Path
Example
T6 Ideal Case
Consider the set of paths shown in Table 1. For the example G =
{P1, P2, P3, P4, P5}. If the minimum support threshold is set to 60%, the set of sequences in G which meet the minimum support threshold includes {S1, S2, S3, S4, S5} and {S1, S3, S4, S5}. For this example, {S1, S2, S3, S4, S5} is maximal and is therefore the common path. The sequence {S1, S3, S4, S5} is not maximal because it is contained in {S1, S2, S3, S4, S5}. If the minimum support threshold is changed to 70%, the set of 82
sequences in G which meet the minimum support threshold includes only {S1, S3, S4, S5}. Since only one sequence meets the threshold it is maximal and is a common path. Table 4.1 also provides examples of types of paths. P1 represents the ideal case for a path representing a scenario. P2 matches P1 except a subset of states are delayed. This may occur due to timestamp variation of events or due to system dynamics. P3 contains an extra state. Dynamics may occur when a feature oscillates during a state transition. P4 represents the case when a path is similar but a state is different from the ideal case. This could happen when an event in a state (i.e. S2) does not occur due to the variation in the timestamp, which results in a different state (i.e. S11). P5 represents an error path. In the error path no sequences match the ultimate common path. The common path is used as a signature during classification. Changing the minimum support threshold changes the number of states in a common path and can affect classification accuracy. It is not necessary to find a common path which matches the ideal path, rather the goal is to find a common path which is unique for a scenario and which leads to maximum classification accuracy. For a noisy system a shorter common path may yield better classification results. The common path must contain critical states about a group of paths, G. For example, a common path for a 1LG fault should have a sequence of critical states representing “current going high”, “relay trip” and “current falling to zero.” The ability to find a common path is greatly dependent on the “quality” of paths in G. For example; if there are a many error paths in G it will be difficult to find sequences which meet the minimum support threshold.
83
The rest of this work presents a case study which applies the mining common path algorithm to a 3-bus 2-line transmission system for classifying four types of power system symmetric and unsymmetrical faults and three cyber-attacks scenarios. 4.3
Power system test bed A real world power system is dynamic and consists of thousands of buses, loads,
transmission lines, and other components. The power system operation goes through various states and is a continuous process. The 3-bus 2-line transmission system used in this work is modified from the IEEE 9-bus 3-generator system [62] according to our simulation requirements. Although this system is relatively small it captures the essence of the larger power system and is small enough to be comprehensible in every detail. This system uses commercial PMU and relays from different major vendors. The test bed and data sets exhibit behaviors of a real power system, yet fit into the resources available in the lab in terms of hardware and software limitations. The transmission system used for HIL simulation for this work is shown in Figure 4.3. 4.3.1
Power system scenarios The power system disturbances and three types of attacks simulated for this work
are described as follows. 4.3.1.1
Power System Faults In this work we consider symmetric and unsymmetrical faults in a power system
as the examples of disturbances. A power system fault is a condition where the system voltage, current and frequency are abnormal. Typically, single line to ground (1LG) faults, double lines to ground (2LG) faults, three lines to ground (3LG) faults and line to 84
line (LL) faults represent greater than 95% of faults in a power system [63]. In this work, for proof of concept we simulated phase-a-to-ground fault for 1LG faults, phase-a-b-toground faults for 2LG faults, phase a-b-c-to-ground fault for (3LG) faults, and phase-ato-b line to line fault for LL faults. 4.3.1.2
Trip command injection attack Trip command injection attacks create contingencies by remotely sending
unexpected relay trip commands from an attacker’s computer to relays at the ends of a transmission line. The trip command injection attack used for this work closely mimics the 1LG fault. The attack was implemented against relay R1 and R2 by replaying relay trip commands captured from MODBUS/TCP network traffic. However, we assume these commands are sent from a compromised legitimate computer such that these commands cannot be detected by network event monitor (e.g. Snort) as attacks since they are from a valid source and have valid formats. The two relay trip commands open the breakers at the ends of transmission line L1. This attack stresses the system by forcing L2 to carry more power flow which may cause cascading failures in a power system. However, for this work, cascading failures were not simulated. The trip command injection attack instances were created under random load conditions in the same range used for faults. 4.3.1.3
Aurora attack The Aurora vulnerability refers to potential harm caused to a generator by
intentionally opening and closing a breaker near the generator in rapid succession [71]. In this work, an aurora cyber-attack was simulated which periodically sends opening85
closing commands to relays that cause the breaker on the transmission line to open and close at a very fast pace. 4.3.1.4
1LG fault replay attack The 1LG fault replay attack attempts to emulate a valid fault by altering system
measurements to mimic a 1LG fault followed by sending an illicit trip command from a compromised computer to relays at the ends of the transmission line. This attack may lead to confusion and potentially cause an operator to take invalid control actions. A Python script is used to initiate a Man-in-the-middle attack between the hardware PDC and the historian that replays synchrophasor measurements from a valid 1LG fault then replays commands to trip the relays on the affected line. 4.3.2
Test bed architecture Zone 2 Zone 1
BR1
L1
BR2 BR3
L2
BR4
G1
G2
R1
R2
R3
B1
R4 LOAD
B2
Figure 4.3
3-bus 2-line transmission system for case study
86
B3
Network Event Monitor
Historian Site
PDC
Attacker
IEEE C37.118 IEEE C37.118 Modbus/ TCP
Relays
Hardware Cable
IEEE C37.118
RTDS
Hardware Cable
PMU
Substation Figure 4.4
Hardware in the loop test bed
The HIL test bed shown in Figure 4.4 was used to simulate the distance protection scheme on the 3-bus 2-line transmission system and implement the faults and cyberattacks scenarios. The RTDS was used to simulate transmission lines, breakers, generators, and load. Four physical relays were wired to the RTDS in a HIL configuration. The relays implemented a two-zone distance protection scheme. The relays trip and open the breakers once a fault occurs on a transmission line. Fault logic for different types of faults were created in RSCAD then the faults were implemented in the RTDS. Prior to each implementation of a fault, the system load was randomized in the range of 200-399MW. Each fault instance was implemented at a random location in 1% increments from 10% to 90% of line L1. The relays used in this work are the GE-D60 and SEL-421. Both are digital relays with integrated PMU functionality. However, PMUs and relays were drawn separately in Figure 4.4. The PMUs stream real-time synchrophasor measurement data, using the IEEE C37.118 protocol at a rate of 120 samples per second, to the PDC. Then aggregated 87
synchrophasor data is forwarded to the OpenPDC software. A python script processes the synchrophasor measurement data received by OpenPDC into a comma separated values format (CSV) file for each instance of a scenario. A row in the CSV file includes readings of frequency, current phasors, voltage phasors, and sequence components from the four PMUs, and a timestamp. Each CSV file is labeled with the instance number, scenario name, as well as load ranges and/or fault location at the moment the instance of the scenario occurs. The label is useful for grouping instances as will be discussed in Section 4.4. The label is also used for training and classifier testing. The four relays were sources of time stamped relay state changes. There is also a network event monitor that logs any trip command packets sending to relays. All logs and synchrophasor measurement CSV files were stored in a historian. The details of this test bed can be found in [81] [82]. For this work, simulation of all scenarios starts from a stable state and ends at a stable state. Faults last for one second and the relay closes the breaker 2 seconds after opening. Also, the distance protection scheme was simplified by disabling reverse time delay backup and limiting the number of protection zones for each relay to 2. Each relay provides primary protection up to 80% of the line (Zone 1 protection) and backup protection (Zone 2 protection) up to 150% of the line. The trip time for Zone 1 protection is set to instantaneous while the trip time for the Zone 2 protection is set to 20 cycles. 4.3.3
Test Data and Data Preprocessing In total 1,023 instances of 1LG faults, 274 instances of 2LG faults, 584 instances
of 3LG faults, 272 instances of LL faults, 274 instances of command injection attacks, 225 instances of aurora attack, and 703 instances of 1LG fault replay attack were 88
simulated. Test data consists of the synchrophasor measurement CSV files, the four relay logs and network event monitor logs collected during all of these scenarios. One relay log is extracted from one of the relays, containing timestamp and corresponding events (trip or not trip). Network event monitor log contains timestamp and corresponding network events (trip command seen or not seen). Each CSV file contains tuples with 52 synchrophasor measurements as each PMU provides 13 measurements including voltage and current phasor magnitude (Va, Vb, Vc and Ia, Ib, Ic), zero, positive and negative sequence voltage and current phasor magnitude (V0, V1, V2 and I0, I1, I2) and apparent line impedance (Z). A single CSV file has approximately 2,000 tuples for an instance of a single scenario. Since the PMU stream at 120 samples per second, 2,000 tuples corresponds to 17 seconds of simulated system time per scenario. The test data was separated into training and testing data sets, each of which was the input to training and testing phases of the classifier described in the previous section. The data preprocessing step in the training and testing phases converts a data set into paths. This preprocessing process constitutes following steps. Step 1: Feature selection. Rather than using all recorded input features from the dataset, only a portion of measurements was retained as selected features. In this work, the selected features contain relay status and the three phases current magnitudes (Ia, Ib, Ic). Relay status was used as features because all cyber-attacks studied in this work maliciously trip relays via the network. The network event monitor log was selected as one of the features for the same reason. The three phase current magnitudes were selected because the current magnitudes of the three phases were the most significant
89
measurements during symmetric and unsymmetrical faults. Other unselected measurements were discarded from the input data. Step 2: Quantizing features. Each feature was first quantized into finite ranges. The quantization of features requires an expert’s domain knowledge. Continuous features such as phase current for this case study were quantized into nominal ranges to create a finite state space. The phase currents were quantized into low, normal, and high ranges. The low range was 0-99 Amperes (A). The normal range was 100-1199 A. The high range was greater than 1200 A. The relay status was quantized into two values; tripped and not tripped. The network event monitor log was also quantized into two values; trip command seen and trip command not seen. Step 3: Merge quantized features into a measured events database. The measurement data from the PMU and relay log were merged into a single measured events database for one instance of a scenario. The PMU current magnitude measurements were measured at 120 samples per second while relay status was updated only on a relay state change. To merge the features phase current was chosen as a reference and the relay status was up sampled prior to merging into the measured events database. The aggregated features with their quantized values in a single row of the measured events database describe the system state at a given timestamp. A system state thus is a vector of timestamps and features with quantized measurements. An example of such state that describes relay R1 and R2 tripping due to high current magnitude can be represented as a vector {Timestamp, IR1 = High, IR2 = High, R1 = Trip, R2 = Trip, …}, where “IR1 = High” and “IR2 = High” in the vector represent high current magnitudes 90
measured by PMUs in R1 and R2. “R1 = Trip” and “R2 = Trip” in the vector represent relay trip status of the two relays. Note that there will be other features with quantized values in the vector but they are not displayed in this example. The time difference between two states is same as that between two rows in the measured events database, which is the reciprocal of the synchrophasor measurement rate; 1/120 samples per second = 8.33 milliseconds (ms). The timestamps of rows in the measured events database are normalized by subtracting the time of the first row from all other rows. This causes all measured events databases to start from time 0. Step 4: Mining paths from measured events databases. A path is mined from a measured events database by first merging contiguous rows with unchanged state in the measured events database. The remaining rows contain unique states. A state space database is used to track the unique states. Each unique state is given a state identifier (Sid). Rows are updated to include the state identifier of the system state with the time stamp of the state. Paths are an ordered list of states. Each instance of a scenario will have a path. Many instances of a scenario will have unique paths due to system and measurement dynamics. The paths mined from training data sets over fit the actual system behavior they are intended to model. If raw paths are used for classification the classifier accuracy will be low. Common paths are needed which represent the scenario across all variations found in the training data set. 4.4
Evaluation Three experiments were performed to validate the Mining Common Paths
algorithm. The first experiment classifies two classes, 1LG fault and command injection 91
attack. To further stress the algorithm, we design the second experiment which performs classification on different 1LG fault locations classes and command injection attack class. The second experiment uses the same training data set and testing data set as experiment 1, but it requires an extra step in training in which system expertise is used to divide the 1LG fault class into multiple subclasses representing different fault locations. In experiment 3, we tested the algorithm for 4 types of short-circuit faults and 3 types of attacks. Experiment 3 uses 10-round cross validation to validate the correctness of the classifier. Experiment 3 also includes a comparison of classification accuracy using different PMU streaming rates. The training phase and test phase used for each experiment are summarized as follows. 4.4.1
Training phase:
Input: Training data set for NTraining instances of M classes (each class associates with one scenario) Output: M sets of common paths (cp) for M classes Step 1: Training data set is preprocessed into NTraining paths as stated in Section IV.C for NTraining instances. Step 2: NTraining paths are grouped into M groups for M classes. Step 3: Common paths are computed for each group of paths. 4.4.2
Test phase:
Input: Test data set for NTest instances of M classes Output: Classify instance by scenario type
92
Step 1: For each instance in test data set, preprocess instance into one path under test (PUTj). Step 2: Compare the path to all common paths in cp by repeating Step 3 for each cpi in cp. Step 3: If cpi ⊆ PUTj then cpi is a candidate common path. Step 4: The PUTi is classified as class of the maximal length candidate common path. If more than one maximal candidate common path are maximal then PUTi is classified as unknown. Step 5: If PUTi is classified as none of the known classes, then it is marked as unknown. Step 6: Repeat Step 1 to Step 5 for all NTesting instances. 4.4.3
Experiment 1 For the first experiment, approximately half of the test data for 1LG fault and
command injection attack is randomly chosen as training data set while the rest is used as a testing data set. This resulted in 519 instances of 1LG fault and 127 instances of the command injection attack which were used for training. Table 4.2 is a confusion matrix for experiment 1. For this work, accuracy, misclassification, and unknown rates were defined as follows. The accuracy rate is the percentage of instances correctly classified. Misclassification rate is the percentage of the instances of a class which were misclassified as another scenario. The unknown rate is percentage of the instances of a scenario which were not classified as any scenario. Unknown instances either match no common paths or match more than one common path from more than one class. 93
Table 4.2
Confusion matrix for experiment 1 Fault 491 0 28
Fault C. Inj. Unknown
C. Inj. 0 123 4
For the first experiment, the overall classification accuracy was 95%. No instances were misclassified. A total of 5% of tested scenario instances were unknown. All unknown instances matched at least one fault and at least one command injection common path. There were a total of 221 common paths found for the two scenarios; 203 for 1LG fault scenario and 18 for the command injection scenario. This high number of paths results from the dynamic nature of the power system. Figure 4.5 is a plot of the fault location, from the perspective of relay R1, versus relay trip times for relays R1 and R2. Figure 4.5 clearly shows zone 1 and zone 2 trip boundaries for both relays. Additionally, Figure 4.5 shows that the relay trip times vary with fault location especially in the fault location region from 24-79% of the transmission line. The large number of common paths for the 1LG fault injection scenario is primarily due to this variation. System behavior also varies as the system load changes. Behavior changes due to system lead to multiple common paths being found for both the 1LG fault and command injection scenarios.
94
0.6
R2 Trip Time R1 Trip Time
Time (sec)
0.4
0.2
0 10
Figure 4.5
4.4.4
15
20
25
30
35
40
45
50
55
60
65
Fault Location at Line L1 (%)
70
75
80
85
90
Relay trip time versus fault location for relays R1 and R2
Experiment 2 Ideally, faults between 0-20% of the transmission line should have instant trip
time for relay R1 and trip after 20 cycles for relay R2. Faults between 80-100% of the transmission line should trip after 20 cycles for relay R1 and instantly for relay R2. In the 21-79% range both relays should ideally trip instantly. Observed trip times match the ideal case for the 0-20% and 80-100% ranges. Note, the apparent impedance setting for zone 2 for relay R2 causes the zone 1 to zone 2 transition to occur at approximately 23% of the line (77% of the line from relay R2’s perspective) instead of at the expected 20% of the line (80% of the line from relay R2’s perspective). The trip times from 24-80% of the line are always instantaneous. Observed trip times tended to increase as the fault approached the zone 1 to zone 2 boundary points. To compensate for this observed behavior the 1LG fault paths were grouped by fault location per the following groups; (10-23%, 24-29%, 30-35%, 36-40%, 41-60%, 61-65%, 6670%, 71-80%, 81-90%). Additionally, it was observed that trip times partially correlated 95
to the system load. As a result, the 1LG fault class used in experiment 1 is divided into multiple classes by fault location and load. Four load ranges were used; (200-249, 250399, 300-349, 350-399 MW). This subdivided the 1LG fault class into 9*4 = 36 sub classes. The command injection attack class in experiment 1 was also divided using 4 load ranges, which results in 4 command injection attack classes. The extra step of subdividing the 1LG fault class and command injection attack results in a total of 40 classes, i.e. M = 40 in the training phase of the classifier. The training data set and testing data set in this experiment is the same as that used in experiment 1. Table 4.3
Confusion matrix for experiment 2
10-23% 23-29% 30-35% 36-40% 41-60% 61-65% 65-70% 71-80% 81-90% C. Inj. Unk. Fault Unknown
10- 23- 30- 36- 41- 61- 65- 71- 81C. 23% 29% 35% 40% 60% 64% 70% 80% 90% Inj. 191 3 0 0 0 0 0 0 0 0 0 4 0 0 0 0 0 0 0 0 0 0 4 0 0 0 0 0 0 0 0 7 0 2 6 0 0 0 0 0 0 0 0 2 41 2 0 0 0 0 0 0 0 0 5 10 0 0 0 0 0 0 0 0 8 3 14 4 0 0 0 0 0 0 0 0 1 38 18 0 0 0 0 0 0 0 0 0 135 0 0 0 0 0 0 0 0 0 0 127 0 0 9 7 0 0 0 0 0 0 4 0 0 0 1 0 0 0 0 0
Table 4.3 is a confusion matrix for all scenarios for experiment 2. As previously mentioned, the 1LG fault classes were divided by fault location and system load. To save space the groups in the confusion matrix were combined to just show the fault location 96
classes and one command injection class. An extra row (marked Unk. for unknown) was added to the confusion matrix to show instances of scenarios which were not classified. The experiment 2 classification accuracy, misclassification, and unknown rates can be viewed from multiple perspectives. The overall accuracy rate for the groups shown in the confusion matrix was 87.6%. Misclassification and unknown rates for the same groups were 9.1% and 3.3% respectively. From the confusion matrix the majority of misclassification occurred when 1LG fault groups were classified as members of a neighboring or nearby fault group. The unknown cases are separated into unknown instances which resulted from an instance matching multiple fault common paths (“Unk. Fault” in Table 4.3) and unknown instances which matched no common path. The 16 cases of faults which matched common paths from more than one group all occurred because both the (30-35%) and (36-40%) shared a common path. The intent of subdividing the 1LG fault class was not to classify 1LG faults by a specific fault location. Correctly classifying a fault as a fault is sufficient as many algorithms are available to provide fault location information. The accuracy rate when the fault location classes were combined into a single class is 96.7%. The misclassification rate was 0% and the unknown rate was 3.3%. Common paths can be mapped into two-dimensional coordinates with the Y-axis indicating the state identification code (state ID) and the X-axis indicating normalized timestamps. An edge between two vertices represents the temporal transition between two states. Each vertex is marked with state information. shows common paths for two scenarios, a fault in the 36-40% fault location group and a command injection attack. The fault and command injection common paths both start at the system normal state. 97
These paths differ immediately because for faults the PMU will measure high current when a fault is present. This makes the second state of the fault common path high current detected at relay R1. The command injection attack occurs when there is no fault present. As such, the second state for the command injection attack has normal current at both relays while both relay’s status indicates a trip.
(IR1 = Zero, IR2 = Normal, R1 = NT, R2 = NT)
20 18
(IR1 = High, IR2 = Normal, R1 = T, R2 = NT)
16
(IR1 = High, IR2 = Normal, R1 = T, R2 = T)
State ID
14 12 (IR1 = Normal, IR2 = Normal, R1 = T, R2 = T)
10 8
(IR1 = Normal, IR2 = Normal, R1 = T, R2 = T)
6
(IR1 = Zero, IR2 = Zero, R1 = NT, R2 = NT)
(IR1 = Zero, IR2 = Zero, R1 = NT, R2 = NT)
4 2 0 1
Figure 4.6
Fault at 36% - 40% Command Injection Attack
(IR1 = Normal, IR2 = Normal, R1 = NT, R2 = NT)
2
3
Time
4
5
2-D coordinates documenting fault versus command injection attack common paths
98
6
(IR1 = Zero, IR2 = Normal, R1 = NT, R2 = T)
20
(IR1 = High, IR2 = Normal, R1 = NT, R2 = NT)
18
(IR1 = Zero, IR2 = Normal, R1 = NT, R2 = NT)
(IR1 = Normal, IR2 = Normal, R1 = NT, R2 = NT)
16
(IR1 = Zero, IR2 = Normal, R1 = NT, R2 = T)
14
State ID
12 10
(IR1 = Zero, IR2 = Zero, R1 = NT, R2 = T)
8
(IR1 = Zero, IR2 = Zero, R1 = NT, R2 = T)
6 4 2 0
Fault @ 10-23% Fault @ 24-29%
(IR1 = Normal, IR2 = Normal, R1 = NT, R2 = NT)
1
Figure 4.7
2
3
Time
4
5
6
2-D coordinates comparing two common paths for faults
Figure 4.6 shows common paths for two different 1LG fault locations. Note that not all features are displayed in the graph. The 10-23% fault is in relay R2 zone 2 and the 24-29% fault is in relay R2 zone 1. This difference is the primary reason for different paths for the two fault sub groups. Figure 4.7 demonstrate that common paths contain the critical states for different scenarios. The primary contribution of the mining common paths algorithm is the ability to create unique paths for each scenario type. Training and testing processing time and memory usage were measured using an Ubuntu Linux Virtual Machine with 3.5GHZ CPU and 2GB memory. For experiment 1, training required 202 seconds and 25.3 MB memory. Experiment 1 testing required 550 seconds to complete and 25.3 MB of memory. For experiment 2, training required 205
99
seconds and 25.2 megabytes (MB) memory. Experiment 2 testing required 540 seconds to complete and 25.2 MB of memory. 4.4.5
Experiment 3 A third experiment was conducted for classifying 4 types of symmetric and
unsymmetrical faults and 3 types of cyber-attacks. The training phase used the same methodology as experiments 1 and 2. Validation in this experiment used10-round cross validation. In each round, half of the test data was randomly chosen as a training dataset and the remaining data was used as the testing data set. Table 4.4 is a combined confusion matrix for 10 rounds of validation for the 1LG, 2LG, 3LG, LL faults, command injection, Aurora, and fault replay attacks. Each entry in the table sums up numbers for 10 rounds in the corresponding location.
Table 4.4
Confusion Matrix for 4 types of faults and 3 cyber-attacks 1LG Flt. 1LG Flt. 5009 2LG Flt. 6 3LG Flt. 86 LL Flt. 0 Cmd. Inj. 0 Aurora 0 Flt. Replay 0 Unknown 177
2LG Flt.
3LG Flt.
0 0 1248 0 11 2905 14 0 0 0 0 0 0 0 58 15
Flt. Cmd. Auror Repla Inj. a y 3 0 0 109 0 0 0 0 24 0 0 17 1089 0 0 0 6 1380 0 124 0 0 971 0 0 0 0 3138 238 0 159 97 LL Flt.
The total number of classifications made in Table 4 is 16,851, of which 15,740 instances are correctly classified. The average accuracy for the seven classes shown in 100
Table 4 is 93.41%. Only 488 instances of faults (177 of 1LG fault, 58 of 2LG fault, and 15 of 3LG fault and 238 for LL) were classified as unknown. And only 6 instances of faults are misclassified as cyber-attacks. The lowest accuracy for an individual class or scenario type was for fault replay attacks. Fault replay attack classification accuracy was 90%. Fault replay attacks were misclassified as a fault for 3.6% of the tested instances and misclassified as a command injection attack for 3.5% of tested instances. The fault replay attack is intended to mimic a 1LG fault and as such is sometimes able to confuse the classifier. The fault replay includes elements from the command injection attack. This leads to similarities which cause occasional misclassification as a command injection attack. Table 4 demonstrates that the classifier is able to distinguish faults and cyberattacks. The accuracy rate for 10-round validation when the PMU is sample rate at 20, 30, 60, and 120 Hertz (Hz) is plotted in Figure 4.8. Classification accuracy is higher when the PMU is streaming at 120 Hz and lowest at 20 Hz. This is reasonable as higher PMU samples rates gives better visibility of the system states when fast moving events, such as faults, are considered.
101
100 95
Accuracy (%)
90 85 80
20 Hz 30 Hz 60 Hz 120 Hz
75
70
Figure 4.8
4.5
1
2
3
4
5 6 Round of Validation
7
8
9
10
Accuracy rates for 10-round cross validation with different PMU streaming rates
Conclusions The mining common paths algorithm creates common paths from heterogenerous
data in the power system. A common path represents a set of critical states that a system will step through in temporal order for a scenario such as a disturbance or a cyber-attack. Common paths can be used as signatures to classify power system behaviors with high specificity. Such a classifier is a useful tool for use with automated system integrity protection systems and wide area control systems which include responses for both natural, equipment failure, and cyber-attack related contingiencies. Simple paths can be derived from monitored instances of sceanrios applied to a test bed. However, the transients present in time-domain measurement data lead to different paths for different instances of the same scenario. The mining common paths algorithm uses a sequential pattern mining approach to overcome this challenge and common paths for the scenario.
102
To validate the correctness of the algorithm, a case study was performed which applied the mining common paths algorithm and classifier to detect disturbances and cyber-attacks. The classifier provides a capability to accurately distinguish between different types of power system faults and cyber-attacks including command injection, aurora attacks and fault replay attacks. Three separate experiments were performed. The first experiment applied the mining common paths algorithm to data with 2 classes; 1LG fault and command injection. The second experiment adds an extra step prior to the training phase where the 1LG fault class is divided into a number of subclasses by taking advanatage of power system domain expertise. The extra step of sub-dividing classes in training produces slightly better accuracy, misclassification, and unknown classification. Both experiments required similar training time, testing time, and memory usage. A third experiment was conducted using the same training as experiment 2. Ten round cross validation was performed with varying PMU sample rates. The ten round validation shows the classifier has not overfit the data. Comparison of varying PMU sample rates shows the highest accuracy is achieved with PMU sampled in 120 Hz. This is expected since faults are fast moving events and 120 Hz sample rate provides the most visibility of system state changes. This work demonstrates a methodology to leverage synchrophasor measurements for power system disturbance and cyber-attack detecion and highlights the promise of the minining common paths aglorithm.
103
CHAPTER V DEVELOPING A HYBRID INTRUSION DETECTION SYSTEM USING DATA MINING FOR POWER SYSTEM
5.1
Introduction The next generation power system, also known as smart grid, will rely on
advanced technologies such as synchrophasor systems for wide area monitoring and control in order to meet the increasing demand of reliable energy. While in the past, power system components were isolated, they are now interconnected via information infrastructure e.g. Ethernet, and therefore are under the threat of cyber-attacks. Due to the critical role that the power system plays in our society, there is a common agreement that the electric power grid needs to be better secured to ensure continually available power for the nation [1]. There have been multiple documents from different organizations which provide recommendations and guidelines for industry to better secure their facilities[2][3]. However, the United States Government Accountability Office (GAO) has realized that current guidelines are not sufficient to securely implement the smart grid and calls for research and development to improve upon current security mechanisms [4]. Intrusion detection is a process which identifies activities that violate the security policy in a computer system or network. Intrusion detection is a necessary complement to preventive mechanisms such as firewalls because intrusion detection has the ability to detect attacks that exploit system design flaws or bugs and to help people understand the 104
cause of attacks and thus take proper reactions [7]. The increasing coupling of cyber infrastructure and physical devices of the smart grid makes a traditional host-based intrusion detection system (IDS) inadequate because host-based IDS only monitor one location or one host in the system while power system control algorithms such as the distance protection scheme usually involve multiple devices at multiple locations. Therefore, new IDS should have the ability to take multiple data sources into account and perform stateful monitoring at the system level. Manually building a stateful system level IDS is a knowledge-intensive task which requires vulnerability analysis and manual creation of rules and patterns which describe attacks, system specification, or system normal behaviors. The manual development process results in limited scalability and updates are slow and expensive. This chapter documents a systematic and automated approach to building a hybrid IDS that leverages features of signature-based and specification-based IDS. The IDS classifies system behaviors over time as specific disturbances, normal control operations, and cyber-attacks. Sequence of critical states, called common path, provide a specification or signature for each scenario. A fundamental ingredient of the IDS presented in this chapter is a data mining technique that aggregates synchrophasor measurement data and audit logs from multiple system devices to learn the common paths. The automatic approach eliminates the need to manually analyze and hand-code patterns and is able to handle very large amounts of data. A case study is included to demonstrate that the proposed IDS provides high detection accuracy for both known and unknown scenarios and thus is suitable for a mission-critical environments such as power systems. 105
Common paths are signatures of events present in a training database. Common paths are also specifications since they describe expected system behaviors related to known scenarios; normal expected system behaviors and cyber-attacks behaviors. The IDS matches a temporal set of monitored system states to common paths, a signature based technique, to make a classification. Behaviors which do not match a common path are considered unspecified events and are either zero day attacks or unknown system behaviors. The rest of the chapter is organized as follows. The mining common path algorithm is reviewed in Section 5.2. The overview of the test bed and simulated power system scenarios are presented in Section 5.3. Section 5.4 introduces the procedures to construct the proposed IDS. Experiments and results are discussed in Section 5.5. Conclusions and future work are provided in Section 5.6. 5.2
Mining common paths A state is used to represent a system’s instantaneous status. A state consists of a
set of observed system measurements or features f as well as a normalized time stamp TS, i.e. S = {TS, f1,⋯,fn}. The value of a feature is read from a sensor. The possible values for a feature are in a range called its domain. A feature that has continuous values in its domain should be discretized to finite ranges to avoid an infinite state space. A path P is a list of observed system states arranged in temporal order according to their timestamps, namely Pi = {S1, S2, …, Sn}, ordered by increasing time. A sequence s is a subset of a path, i.e. s ⊆ P. We denote a sequence s by {Si+1, Si+2, …, Si+m}. A path P contains sequence s if all of the elements in s appear in P in the same order. In a set of sequences, a sequence is maximal if the sequence is not contained in any other sequences. 106
Let G be the set of all observed paths for a scenario Q so G = {P1, P2,…,Pn} where n is the number of observed paths for Q. A path supports sequence s if the sequence is contained in the path. Support can be defined as a metric in which the support of sequence s is the percentage of paths in G that contain sequence s. A common path for scenario Q is any sequence whose support is greater than a minimum support threshold and is maximal. There may be multiple common paths for a single scenario. Common paths reflect the states that occur most frequently for a scenario. The process of mining common path is similar to mining frequent sequence patterns as defined in [31]. Table 5.1
Example paths for a scenario T1
T2
T3
T4
T5
P1
S1
S2
S3
S4
S5
P2
S1
S2
S3
S4
S5
Delayed States
P3
S1
S10
S2
S3
S4
S5
Extra States
P4
S1
S11
S12
S4
S5
Modified States
P5
S21
S22
S23
S24
S25
Error Path
Example
T6 Ideal Case
Consider the set of paths shown in Table 5.1. For the example G =
{P1, P2, P3, P4, P5}. If the minimum support threshold is set to 60%, the set of sequences in G which meet the minimum support threshold includes {S1, S2, S3, S4, S5}, {S1, S3, S4, S5} and {S1, S4, S5}. For this example, {S1, S2, S3, S4, S5} is maximal and is therefore the common path. The sequences {S1, S3, S4, S5} and {S1, S4, S5} are not maximal because they are contained in {S1, S2, S3, S4, S5}. Alternatively, if the minimum 107
support threshold is changed to 70%, the set of sequences in G which meet the minimum support threshold includes only {S1, S4, S5}. Since {S1, S4, S5} meets the threshold in this case, it is maximal and is a common path. Table 5.1 also provides examples of possible types of paths that could be found in the dataset. P1 represents the ideal case for a path representing a scenario. P2 matches P1 except a subset of states are delayed. This may occur due to a measurement error or due to power system dynamics. P3 contains an extra state. Dynamics may occur when a feature oscillates during a state transition. P4 represents the case when a path is similar but a state is different from the ideal case. This could happen when an event that should have occurred at T2 occurs at T3 instead, which mangles states S2 and S3 (they change to S11, S12). P5 represents an error path. In the error path no sequences match the ultimate common path. The common path is used as a specification during classification. Changing the minimum support threshold changes the number of states in a common path and can affect classification accuracy. It is not necessary to find a common path which matches the ideal path, rather the goal is to find a common path which is unique for a scenario and which leads to maximum classification accuracy. For a noisy system a shorter common path may yield better classification results. A common path for a single line to ground (SLG) fault should have a sequence of critical states representing “current going high”, “relay trip” and “current falling to zero.” The ability to find a common path is greatly dependent on the quality of paths in G. For example; if there are a many error paths in G it will be difficult to find sequences which meet the minimum support threshold. 108
Classification is performed by comparing observed system states to the states of known common paths. The path under test (PUT) is compared to all common paths. If cpi ⊆ PUT then cpi is a candidate common path. The PUT is classified as matching the scenario of the maximal candidate common path from the set of candidate common paths. If more than one candidate common path are maximal the PUT is classified as unknown. The rest of this chapter presents a case study which applies the mining common path algorithm to a 3-bus 2-line transmission system for classifying 25 power system scenarios. 5.3
Test bed architecture
5.3.1
Distance protection for transmission lines Zone 2 Zone 1
BR1
L1
BR2 BR3
L2
BR4
G1
G2
R1
R2
R3
B1
R4 LOAD
B3
B2
Figure 5.1
Distance protection scheme in a 3-bus 2-line transmission system
109
Control Room
Snort
Historian Site
Control Panel Site
Modbus/TCP
Modbus/ TCP
Relays
Attacker
IEEE C37.118
IEEE C37.118
Hardware Cable
RTDS
Hardware Cable
IEEE C37.118
PMU
PDC
Substation Figure 5.2
Electric transmission system test bed
The distance protection scheme is the most popular scheme for protecting transmission lines. The principle of operation recognizes that the impedance of a highvoltage transmission line is approximately proportional to its length. This means the impedance “seen” by the relay during a fault is proportional to the distance between the point of fault and the relay. Distance relays are encoded with multiple protection zones. Each zone is assigned an apparent impedance threshold and a trip time. Relays have over lapping protection zones to provide system protection redundancy. One relay’s Zone 1 is part of another relay’s Zone 2 and so forth. For this case study, the distance protection scheme was simplified by disabling reverse time delay backup and limiting the number of protection zones for each relay to 2. Figure 5.1 shows a 3-bus 2-line transmission system that is modified from IEEE 4-bus 3-generator system . Relay R1’s zones 1 and 2 are shown as dashed line boxes. Each relay provides primary protection up to 80% of the line (Zone 1 protection) and backup protection (Zone 2 protection) up to 150% of the line in 110
case that the primary protection fails. The trip time for Zone 1 protection is configured to be instantaneous while the trip time for the Zone 2 protection is time-delayed to avoid false tripping unless the primary relay fails. 5.3.2
Test bed architecture The hardware-in-the-loop test bed shown in Figure 5.2 was used to simulate the
distance protection scheme on the 3-bus 2-line transmission system and to implement 25 power system disturbance, control action, and cyber attack scenarios. The RTDS was used simulate transmission lines, breakers, generators, and load. Four physical relays were wired to the RTDS in a hardware-in-the-loop configuration. The relays implemented the two zone distance protection scheme. The relays trip and open the breakers when a fault occurs on a transmission line. All relays included integrated PMU functionality to measure power system transmission line state; however, the PMU(s) were drawn separately in the graph because relays are controlled by Modbus/TCP and PMUs stream synchrophasor measurements using the IEEE C37.118 protocol. The PMU(s) streamed real-time synchrophasor measurement data at a rate of 120 samples per second, to the PDC which aggregate network frames from multiple PMU and forward the aggregated synchrophasor frames to the OpenPDC software. A python script processes the synchrophasor measurement data received by OpenPDC into a comma separated file. The synchrophasor measurement data includes readings of frequency, current phasors, voltage phasors, and sequence components. The four relays were sources of time stamped relay state changes. The signature-based intrusion detection system Snort runs on a PC to detect network activities. Snort provides alerts when it detects remote tripping command activities in the network. Snort, by itself, cannot distinguish between legitimate and 111
illegitimate remote trip commands since they appear the same on the network. A control panel computer simulates energy management system (EMS) functionality. The EMS simulation was used to disconnect a transmission line for maintenance by remotely tripping relays via a MODBUS/TCP network packet. An EMS log provides the timestamp of such a line maintenance event. For this work, it is assumed that an attacker computer has successfully penetrated the utility’s operational network and can launch cyber-attacks from a node on the operational network. Scenarios of power system disturbances, normal operations and power system cyber-attacks are applied against the simulated power system and its components. Data logs were captured from the synchrophasor system, relays, Snort, and the simulated EMS. All data logs were time stamped and logged events were labeled with the name of the scenario being simulated. 5.3.3
Test bed scenarios The power system scenarios used to train and validate the IDS presented in this
chapter have been grouped into three categories; power system single-line-to-ground faults, normal operations, and cyber-attacks. Each category is described in this section with details. There are a total 25 scenarios each named with capital “Q” along with a number. The system load was randomized at the beginning of each scenario. Power system SLG faults belong to the shunt fault family and account for up to 70% of faults in a power system [23]. For this work, only phase-a-to-ground faults were simulated as each phase to ground fault has similar characteristics. The phase-a-to-ground fault is abbreviated as “fault” in the rest of this chapter. There are 2 SLG fault scenarios as named Q1 and Q2 that simulate faults on one of the two transmission lines. Each fault instance was implemented at a random location in 1% increments from 10% to 90% of 112
the corresponding transmission line. Faults were simulated for 1 second afterwhich an automatic reclosing algorithm restored the transmission line to service. The transmission line maintenance scenario simulates the situation when an operator remotely trips relays to open breakers at both ends of a transmission line to take the line out of service for line maintenance. The operator initiated remote trip commands are recorded and time stamped in the control panel log. Two scenarios of this type, Q5 and Q6, were implemented, one for each of the two transmission lines. Power system cyber-attacks may originate from insiders, amateur hackers, political activists, criminal organizations, governments, and terrorists. Cyber-attacks may appear as a nuisance or may bring the system to collapse [24]. Attacks can be carried out from within power system substations, control center, transmission and distribution infrastructures by exploiting weaknesses in physical security policies. Alternatively, attacks may take advantage of security flaws and vulnerabilities in software, devices, communication infrastructures, and protocols to electronically infiltrate power system operational networks. Three types of attacks are simulated; relay trip command injection; disabling relay function; SLG fault replay. Relay trip command injection attacks create contingencies by sending unexpected relay trip commands remotely from an attacker’s computer to the relays at the ends of the two transmission lines. The trip command injection attack used for this work closely mimics the line maintenance scenario. The malicious trip command originates from another node on the communications network with a spoofed legitimate IP address. Since the attack is not from the control panel computer there will not be no record in the control panel log, however, the Snort network traffic monitor will detect this remote trip 113
command. There are 6 scenarios of this type of attack targeting either one relay (Q7, Q8, Q9, Q10), or two relays at the same time (Q11, Q12). The disabled relay attack mimics the effects of insiders taking illicit control actions or malware taking control of software systems to manipulate control devices. A python script accesses a relay’s internal registers via MODBUS/TCP commands sent from the attacker’s computer which modify the relevant relay settings. A total of 12 scenarios of this attack are simulated in the test bed. There are 6 scenarios that disable one or two relays which cause the relay not to operate when a valid fault occurs (Q13, Q14, Q15, Q16, Q21, Q22). Another 6 scenarios disable one or two relays to interrupt line maintenance operation by disabling relay tripping function and causing the breakers not to open (Q17, Q18, Q19, Q20, Q23, Q24). The SLG fault replay attack attempts to emulate a valid fault by altering system measurements followed by sending an illicit trip command to relays at the ends of the transmission line. This attack may lead to confusion and potentially cause an operator to take invalid control actions. A Python script is used to initiate a Man-in-the-middle (MITM) attack between the hardware PDC and the historian computer. The attack replays synchrophasor measurements from a valid single line to ground fault then replays commands to trip the relays on the affected line. There are 2 scenarios of this type of attack simulating relay faults at one of the two transmission lines (Q3 and Q4). The final scenario, Q25, represents a stable system state. For this scenario the load may change, but, no other attacks, disturbances, or control actions are simulated.
114
All scenarios start and end with the system in a stable state. As such, all faults are cleared, transmission lines taken out of service for maintenance are returned to service, and all attacks end. 5.3.4
Scenario implementation Figure 5.3 shows control flow between test bed components. The intention of this
design is to simulate large numbers of scenarios in random order with random test bed parameters such as load level and fault locations. The AutoIT script controls different scripts for the implementation of different scenarios as shown in the dash line box in the top right corner.
Auto IT script Simulation Environment
Log Retrieving Script
Attack Script
E.g.MITM, DOS
RTDS
Matlab Sript
E.g. Faults
Relay/PMU
Control Panel Scirpt
E.g. Normal Opertions
PDC
Synchrophasor Data retreiving Script
Relay Log
Figure 5.3
Synchrophasor Measurement Data
Control Panel Log
Control flow for automation scenario implementation and data collections 115
There are a couple of attack scripts that are developed in Python, which implements different cyber-attacks in the test bed. For example, the command injection attack script to remotely trip a relay sends a Modbus trip command to relays. The SLG fault replay attack script sets up a man-in-the-middle attack using Ettercap, then alters PMU data in flight, and finally trips the relays to imitate a legal relay trip. Line maintenance scenarios are also implemented using Python scripts, however, while sending the trip command to relays, they will also put an entry in the control panel log indicating the legality of this action. Single line to ground faults are simulated using a Matlab routine which triggers a SLG fault on target line locations in RTDS. Either line from Figure 5.1 will be taken out of service. The disabled relay attack requires coordination between different scripts. First, an attack script sends a “relay function OFF” command via Modbus to the target relay. Second, the Matlab instructs the RTDS to execute the proscribed SLG fault. This coordination is done by the master AutoIT script invoking the two scripts in the specified order. The master AutoIT script will call each script with randomized parameters in random order at random times. Randomized parameters will include the relay targets, system load level, and fault location where appropriate. The master script will also include relatively long periods of normal operation. With this test bed, the implementations of a large number of scenarios can be easily scheduled through the AutoIT script. Each implementation is also configured to run with random test bed parameters to simulate real world power system. The parameters are fed to different scripts as arguments. For example, load level and fault 116
location are two arguments to the Matlab routine, the values of which result in SLG fault at a specified load level and fault location. After each implementation, relay logs, control panel logs and synchrophasor measurement data can be collected from the output of log retrieving script, synchrophasor data retrieving script and control panel script. The data then will be marked with corresponding scenario number. The test bed also facilitates the implementation of new scenarios. New scenarios can be developed in scripts with interfaces that are callable by the master AutoIT scripts. 5.3.5
Test data Test data used for this work includes data logs associated with 10,000 simulated
instances of the 25 aforementioned scenarios. The data log is a comma separated file with labeled tuples that include 56 sensor measurements and a timestamp. The 56 data sources consist of 52 synchrophasor measurements; 13 from each relay location on Figure 5.1. The synchrophasor data from a single relay consists of phase a voltage and current phasor magnitude (Va, Vb, Vc and Ia, Ib, Ic), zero, positive and negative sequence voltage and current phasor magnitude (V0, V+, V- and I0, I+, I-) and apparent line impedance (Z). The synchrophasor data was sampled at 120 times per second. Relay status information, breaker events, Snort alerts, and control panel alerts were also logged. All logged data was merged into a single dataset. An instance of a single scenario is represented by approximately 2,000 tuples in the test data set. This corresponds to approximately 17 seconds of simulated system time per scenario. In total the test data has more than 2 million tuples. Each tuple in the test data is labeled. Approximately half of the test data was used to train the classifier and half was used to test classification accuracy. 117
For this work, 15 features were used; phase current magnitude measured at each relay, relay status for each relay, snort alert status for each relay, and control panel remote trip status. 5.4
Training the IDS This section documents the IDS construction process. An overview of the IDS
construction process is shown in Figure 5.4. The data formatting step converts input data logs to a measured events database (MED). Next, the specification learning steps process the MED to learn common paths, a unique set of system states in temporal order, for each labeled scenario. Finally, a graph is constructed which includes common paths for all scenarios.
Error f Sensor
Expert Knowledge
Test Data
Quantizing Features
MED
Mining Paths
Expert Knowledge
Paths
Grouping Paths
Common Path 1 3. Mining Common Paths
...
Common Path n 1. Data Formatting
Figure 5.4
5.4.1
4. Graph Construction
2. Creating and Grouping Paths
Intrusion detection system training process
Data Formatting The first step of the data formatting process is feature quantization. Feature
quantization requires domain expertise. Features with values which can take continuous values are mapped into finite ranges to limit state space size. Features which take discrete values are generally left unchanged unless the number of discrete values is large.
118
The phase current measurement is a real number and therefore should be grouped into discrete ranges. Phase current magnitude was separated into normal and high ranges. The normal range was 0-1199 Amperes (A). The high range was all values greater than or equal to 1200 A. The relay status, snort alert, and control panel remote trip status features are all binary. Possible relay status values are tripped and not tripped. Possible Snort alert status values are alert and no alert. Possible control panel remote trip status values are tripped and not tripped. The MED is a merged compressed data set with quantized features. Data from sensors with lower sample rates is up sampled to match the sampling rate of the sensor with the highest sampling rate. The up sampling process depends upon the sensor type. Continuously sampled sensors update their value at each sample period based upon the current measured state. The current magnitude and relay status are continuously sampled. Event based sensors provide a single message when a state change occurs. The snort alert and control panel remote trip status features are event based. For each, when the sensor detects the presence of an event the sensor provides a message indicating the event occurred. In a data log a continuously sampled sensor measurement takes a value and holds that value across multiple samples until the state changes. Conversely, in the data log event based features are asserted for a single sample for each measured event. When up sampling, continuously sampled sensor measurements are mapped to the nearest sample period after the measurement. All samples without a value take the value nearest proceeding sample. Event based sensor measurements are also mapped to the nearest sample period after the measurement. All samples without a value take the non asserted value. For this work, the current magnitude measurements were measured at 120 119
samples per second which is the highest sampling rate of all features. Relay status, snort alerts, and control panel log features were up sampled according to the aforementioned procedure. An MED represents one instance of a scenario. As such, data formatting requires copying each scenario into a separate file. The timestamps of rows in the MED are normalized by subtracting the time of the first row from all other rows. This causes all measured events databases to start from time 0. 5.4.2
Creating and grouping paths
5.4.2.1
Creating paths A path is a list of observed system states arranged in temporal order. Mining paths
is performed by down sampling the MED while preserving all state transitions. A state change is a change on any sensor value between two MED samples. The MED is parsed to identify all periods of consistent state. Consistent state periods are down sampled using a user defined sample period. For this work, the sample period was 0.5 seconds. Each unique state is assigned a state identifier (Sid) and all known states are stored in a state data base. A path is mined for each MED. A single scenario will have many unique paths due to the dynamic nature of power systems, variations in the order of states within a path, and due to variations in event timing. Using the paths derived from the mining paths process for classification results in poor classification accuracy. The mining common paths algorithm is used to shrink the larger group of paths into a representative set of common paths which represent normal variation and serve as a set of signatures for each scenario. 120
5.4.2.2
Error features 20 0.08 0.06
15
10
Time (s)
Time (s)
0.04
5
0.02 0
-0.02 0
-5
Figure 5.5
-0.04
-0.06
CP = R1
SNT = R1
IR1 = 0
Dispersion of timestamps for three states that contain three events CP = R1, SNT = R1 and IR1 = 0.
There will be situation where a feature (or more features) used to construct MED has big deviation in its timestamps due to transmission delay or tight computational resources of a computer. This causes the paths created from the MED merging step to be inaccurate. We call such feature “error feature”. Figure 5.5 shows timestamps of three states from left to right that contain event “control panel sending trip command to relay R1” (CP = R1), event “snort detecting trip command to R1” (SNT = R1) and event “current measured by R1 dropping to zero” (IR1 = 0) respectively. The most left box plot shows that feature “control panel log” is an error feature because the timestamps of “CP = R1” present wide dispersion over a number of instances. This will result in the failure in mining a common path. To deal with “error features”, we design an error feature sensor which correct the timestamps of the error feature. The error feature sensor first 121
excludes the error feature from the MED before merging rows in MED. After merging rows, it adds the feature back to the first state of each path. For example, if a scheduled trip command to R1 is seen in the control panel log for the scenario that the path represents then CP = R1 is added to the first state of the path, otherwise, CP = 0 will be added. 5.4.2.3
Grouping paths Grouping is an optional step which preprocesses input data to separate large
classes into smaller sub-classes. Grouping can lead to more accurate classification when the sub-classes are sufficiently different from one another. Figure 5.6 clearly shows zone 1 and zone 2 trip boundaries for both relays. Additionally, Figure 5.6 shows that the relay trip times vary with fault location especially in the fault location region from 24-79% of the transmission line. System behavior also varies as the system load changes.
0.6
R2 Trip Time R1 Trip Time
Time (sec)
0.4
0.2
0 10
Figure 5.6
15
20
25
30
35
40
45
50
55
60
65
Fault Location at Line L1 (%)
70
75
Relay trip time versus fault location for relays R1 and R2
122
80
85
90
Ideally, instances of SLG fault at transmission line L1 scenarios (i.e. Q1) from a two zone distance protection scheme can be separated into 3 groups according to the area of the line in which the fault occurs. Group 1 includes faults from the length of the line which is protected by relay R1’s zone 1 and relay R2’s zone 2. From Figure 5.6, group 1 includes faults which occur between 10-23% of the line. For group 1 faults, relay R1 should trip instantly and R2 should trip after 0.4 seconds. Group 2 includes faults protected by relay R1’s and R2’s zone 1. Both relays should trip instantly for group 2 faults. From Figure 5.6, group 2 faults occur between 24-79% of the line. Group 3 includes faults protected by relay R1’s zone 2 and relay R2’s zone 1. Relay R1 should trip after 20 cycles and R2 should trip instantly for group 3 faults. From Figure 5.6, group 3 faults occur between 80-90% of the line. Observed trip times in group 2 tended to increase as the fault approached the zone 1 to zone 2 boundary points. To compensate for this observed behavior the SLG fault paths were grouped by fault location per the following groups; (10-23%, 24-29%, 3035%, 36-40%, 41-60%, 61-65%, 66-70%, 71-80%, 81-90%). Additionally, it was observed that trip times partially correlated to the system load. As a result, the SLG fault paths were grouped by fault location and load. Four load ranges were used; (200-249, 250-399, 300-349, 350-399 MW). This grouping subdivided the SLG fault paths into 9*4 = 36 sub-groups. 5.4.3
Mining common paths
The mining paths step produced 5000 paths from 5000 instances of the 25 scenarios. The mining common path algorithm produced 477 common paths. The minimum and maximum number of common paths for a single scenario was 4 and 53 respectively. The 123
15 SLG fault scenarios had 421 common paths spread among them. The remaining 10 scenarios had 56 common paths. The large number of common paths for the SGL faults is due to the large variation in relay trip times as fault location and system load varies. Common paths can be mapped into two-dimensional coordinates with the Y-axis indicating the state identification code (state ID) and the X-axis indicating normalized timestamps. An edge between two vertices represents the temporal transition between two states. Each vertex is marked with state information. Note that only necessary features are displayed to save space. Figure 5.7 shows common paths for two scenarios, a fault in the 36-40% fault location of line L1 and a fault replay attack on line L1. The fault and fault replay paths both start at the system normal state. For real faults, the PMU will measure high current when a fault is present while for a fake fault the attacker injects high current measurement to the PMU. This makes the second state of the both common paths high current detected at relay R1, i.e. IR1 = High. However, these paths differ immediately because for the fault replay, the attacker has to inject relay trip commands to relay R1 and R2 at the same time. As such, the second state for the fault replay attack has the trip commands to R1 and R2 detected by Snort, i.e. SNT = (R1, R2) in Figure 5.7.
124
35 30
(IR1 = High, IR2 = Normal, R1 = NT, R2 = NT, SNT = (R1, R2), CP = 0)
(IR1 = Normal, IR2 = Normal, R1 = T, R2 = T, SNT = 0, CP = 0)
(IR1 = Zero, IR2 = Zero, R1 = T, R2 = T, SNT = 0, CP = 0)
State ID
25
20 (IR1 = High, IR2 = Normal, R1 = T, R2 = T, SNT = 0, CP = 0)
15
(IR1 = High, IR2 = Normal, R1 = T, R2 = NT, SNT = 0, CP = 0)
10
5 0 1
Figure 5.7
Fault Fault Relpay
(IR1 = Normal, IR2 = Normal, R1 = NT, R2 = NT, SNT = 0, CP = 0)
2
3 Time
4
5
2-D coordinates documenting fault versus fault replay attack common paths
Figure 5.8 shows common paths for line maintenance and command injection attack scenarios. The primary difference between the two scenarios is the command to open relays R1 and R2 originates from the control panel computer for the line maintenance scenario. This causes the control panel log to include a trip command message. The common path for the line maintenance scenario includes a state noting the detection of control panel log events (i.e. CP = (R1, R2)) and states showing Snort detecting remote trip command network packets (i.e. SNT = (R1, R2)). The common path for command injection includes the Snort alert but excludes the control panel log state.
125
35
(IR1 = Normal, IR2 = Normal, R1 = NT, R2 = NT, SNT = (R1, R2), CP = 0)
(IR1 = Normal, IR2 = (IR1 = Normal, IR2 = (IR1 = Normal, IR2 = Normal, R1 = T, R2 = T, Normal, R1 = NT, R2 = NT, Normal, R1 = T, R2 = T, SNT = 0, CP = 0) SNT = (R1, R2), CP = 0) SNT = 0, CP = 0)
30 (IR1 = Normal, IR2 = Normal, R1 = NT, R2 = NT, SNT = 0, CP = (R1, R2))
State ID
25
(IR1 = Zero, IR2 = Zero, R1 = T, R2 = T, SNT = 0, CP = 0)
20
(IR1 = Zero, IR2 = Zero, R1 = T, R2 = T, SNT = 0, CP = 0)
15 10 5 0 1
Line Maintenance Command Injection Attack
(IR1 = Normal, IR2 = Normal, R1 = NT, R2 = NT, SNT = 0, CP = 0)
2
3
4
5
6
Time
Figure 5.8
2-D coordinates documenting ling maintenance versus command injection attack common paths
Figure 5.7 and Figure 5.8 demonstrate that common paths contain the critical states for different scenarios. The primary contribution of the mining common paths algorithm is the ability to automatically create unique paths for each scenario type from data sets which measure behavior associated with the scenarios. 5.4.4
Evaluation Three approaches were used to evaluate the IDS. First, the IDS was used to
classify 5,000 instances of scenarios from the test data set described in section IV of this chapter. Confusion matrices are provided to show IDS accuracy. A detailed review of the algorithms ability to classify SLG faults by fault location is also provided. Second, training and testing was repeated with sets of 4 scenarios missing from the data set. This test was used to demonstrate the IDS’s ability to detect zero day attacks and unknown
126
scenarios. Finally, IDS cost and performance was measured by measuring the amount of processing time and memory required during training and evaluation. Table 5.2 Q1 Q2 Q3 Q4 Q5 Q6 Q7 Q8 Q9 Q10 Q11 Q12 Q13 Oth. Unk Unc
Table 5.3 Q14 Q15 Q16 Q17 Q18 Q19 Q20 Q21 Q22 Q23 Q24 Q25 Oth Unk Unc
Confusion matrix for scenarios Q1-Q13 Q1 Q2 Q3 Q4 Q5 Q6 Q7 Q8 Q9 Q10 Q11 Q12 Q13 505 0 31 0 0 0 0 0 0 0 0 0 0 0 502 0 34 0 0 0 0 0 0 0 0 0 10 0 301 0 0 0 0 0 0 0 0 0 0 0 6 0 321 0 1 0 0 0 0 0 31 0 0 0 0 0 130 0 0 0 0 0 0 0 0 0 0 0 0 0 108 0 0 0 0 0 0 0 0 0 0 0 0 0 67 0 0 0 0 0 0 0 0 0 0 0 0 0 54 0 0 0 0 0 0 0 0 0 0 0 0 0 99 0 0 0 0 0 0 0 0 0 0 0 0 0 57 0 0 0 0 0 6 0 1 0 0 0 0 0 127 0 0 0 0 0 0 0 0 0 0 0 0 0 104 0 0 0 0 0 0 0 0 0 0 0 0 0 179 1 2 3 1 0 0 0 0 0 0 0 0 0 3 1 4 0 0 1 35 32 0 26 0 0 0 0 2 8 4 0 0 0 0 0 0 0 0 0
Confusion matrix for scenarios Q14-Q25 Q14 Q15 Q16 Q17 Q18 Q19 Q20 Q21 Q22 Q23 Q24 Q25 220 0 0 0 0 0 0 0 0 0 0 0 0 208 0 0 0 0 0 0 0 0 0 0 0 0 162 0 0 0 0 0 0 0 0 0 0 0 0 40 0 0 0 0 0 0 0 0 0 0 0 0 73 0 0 0 0 0 0 0 0 0 0 0 0 33 0 0 0 0 0 0 0 0 0 0 0 0 45 0 0 0 0 0 0 0 0 0 0 0 0 424 0 0 0 0 0 0 1 0 0 0 0 0 413 0 0 0 0 0 0 0 0 0 0 0 0 122 0 0 0 0 0 0 0 0 0 0 0 0 112 0 0 0 0 0 0 0 0 0 0 0 0 114 0 0 0 2 1 5 0 0 0 0 0 0 10 12 2 23 0 12 0 6 33 16 19 0 37 58 0 0 0 0 0 0 0 0 0 0 127
Table 5.2 and Table 5.3 provide confusion matrices for the 25 tested scenarios. The confusion matrices were separated into two tables to allow them to fit in the column width of this chapter. The row labeled “Oth” represents scenarios Q14-Q25 in Table 1 and Q1-Q13 in Table 5.2. The row labeled “Unk” provides the number of instances which were unclassified due to no matching common path. Finally, the row labeled “Unc” provides the number of instances with uncertain classification due to matching more than one common path from more than one scenario. In total, 90.4% of the tested instances were correctly classified and 2.7% of the instances were misclassified. 4.7% of instances were classified as unknown and 2.2% were classified as uncertain. All of the cases of uncertain classification were related to SLG fault instances which matched common path for more than one fault scenario. Table 5.4
Confusion matrix for sub-groups in scenario Q1
10-23% 23-29% 30-35% 36-40% 41-60% 61-65% 65-70% 71-80% 81-90% Unk. Fault Unk
1023% 191 0 0 0 0 0 0 0 0 0 4
2329% 3 4 0 7 0 0 0 0 0 0 0
3035% 0 0 4 0 0 0 0 0 0 9 0
3640% 0 0 0 2 2 0 0 0 0 7 0
4160% 0 0 0 6 41 5 8 0 0 0 1
6164% 0 0 0 0 2 10 3 0 0 0 0
6570% 0 0 0 0 0 0 14 1 0 0 0
7180% 0 0 0 0 0 0 4 38 0 0 0
8190% 0 0 0 0 0 0 0 18 135 0 0
Table 5.4 displays a confusion matrix of classifications of the sub-groups for scenario Q1 which is a SLG fault on line L1. As previously mentioned, the SLG fault paths were grouped by fault location and system load. To save space the groups in the 128
confusion matrix were combined to just show the fault location grouping. The row labeled “Unk. Fault” indicates unknown faults, i.e. instances classified as more than one fault. The row labeled “Unk” indicates unknown classification, i.e. instances which could not be classified due to not matching a common path. The overall accuracy rate for the groups shown in the Table 5.4 was 84.6%. The majority of misclassification occurred when SLG fault groups were classified as members of a neighboring or nearby fault group. The 16 cases of unknown faults all occurred because both the (30-35%) and (36-40%) shared a common path. The intent of the grouping of SLG faults was not to classify SLG faults by a specific fault location. However, Table 5.4 demonstrates the mining common path algorithm’s strength of finding unique paths for even similar scenarios. Training and classification processing time and memory usage were measured using an Ubuntu Linux Virtual Machine with 3.5GHZ CPU and 2GB memory. Training required 0.33 seconds per scenario instance and 34 MB memory. Classification of test cases required 0.85 seconds per scenario instance to complete and 26.2 MB of memory. Tenfold cross-validation was used to evaluate the detection accuracy of zero-day attack scenarios as shown in Table 5.4. For each round of testing four scenarios are randomly selected to be excluded from training but present in the testing data set. The average detection accuracy for zero-day attack scenarios was 73.43%. However, there are cases where the detection rate for zero day attack is low. For example, in Round 3, the zero day detection rate was 50.5%. Analysis of this case showed that scenario Q6 (command injection to trip relay R1 and R2) was always misclassified as scenario Q3
129
(fault replay attack on Line L1). This is reasonable because the fault replay attack includes injected trip commands targeting relays R1 and R2. Table 5.5
5.5
Detection accuracy for 4 random zero-day attacks 10x validation
Round
Excluded Scenarios
Z.D. Acc. (%)
1
Q3, Q11, Q18, Q22
76.3
2
Q2, Q8, Q12, Q23
67.3
3
Q6, Q11, Q16, Q17
50.5
4
Q1, Q5, Q8, Q10
73.3
5
Q1, Q9, Q19, Q21
91.8
6
Q5, Q13, Q20, Q23
64.7
7
Q5, Q10, Q15, Q16
63.8
8
Q12, Q13, Q19, Q24
70.7
9
Q2, Q7, Q9, Q17
76.3
10
Q9, Q10, Q16, Q19
99.8
Conclusion The IDS described in this chapter provides stateful monitoring of an electric
transmission distance protection system by leveraging a fusion of synchrophasor data and information from relay, network security logs, and energy management system logs. The IDS is trained using a mining common paths algorithm. Common paths are hybrid signatures and specifications which described patterns of system behavior associated with power system events. The algorithm provides a time-domain data 130
analysis approach to overcome transients present in the measurements. This is done by mining shared states out of a group of observed paths. Common paths are used to describe system responses to power system disturbances, control actions, and cyberattacks. The IDS matches monitored system state traversal to common paths to make classification decisions. Classification is specific to each trained scenario rather than simply an indication of normal or abnormal activity. In this work the IDS was trained an evaluated for a 3-bus 2-line transmission system which implements a 2 zone distance protection scheme. Twenty five scenarios consisting of SLG faults, control actions, and cyber-attacks were implemented on a hardware-in-the-loop test bed. Scenarios were run in a loop 10,000 times with randomized system parameters to create a dataset for IDS training and evaluation. The IDS correctly classified 90.4% of tested scenario instances. Evaluation also included a tenfold cross-validation to evaluate the detection accuracy of zero-day attack scenarios. The average detection accuracy for zero-day attack scenarios was 73.43%. The performance of the proposed IDS has outscored that in [43] in average detection accuracy and accuracy of zero-day attacks.
131
CHAPTER VI CONCLUSION AND FUTURE WORKS
6.1
Conclusion Synchrophasor systems are an emerging technology. Prior to installation of a
synchrophasor system a set of cyber security requirements must be developed, new devices must undergo vulnerability testing, and proper security controls must be designed to protect the synchrophasor system from unauthorized access. In this dissertation we described the process used to develop a set of cyber security requirements in the design stage of a synchrophasor project. A set of cyber security rules was derived from review of the NISTIR 7628 Guidelines for Smart Grid Cyber Security, DHS Security Procurement Language for Control Systems, and from utility internal requirements. Next, the dissertation discussed a cybersecurity vulnerability analysis and testing process. The testing process included network congestion and protocol mutation testing of multiple phasor measurement units and phasor data concentrators. The testing section provides limited results due to confidentiality agreements and ethical reporting requirements. The testing section also discussed short comings of the fuzzing tool used and described a network fuzzing framework that is capable of fuzzing server to client interactions, client to server packet contents, and system state. Next, the dissertation discussed the process of reviewing synchrophasor system components against the drafted cyber security requirements. Each requirement 132
was discussed in the context of the synchrophasor system and recommendations were provided for meeting requirements. This dissertation also provides discussion on writing SNORT intrusion detection rules based upon the results of cyber security testing. While fixing the identified vulnerabilities in information infrastructure is imperative to a secure power system, it is likely that successful intrusions will still occur. The ability to detect intrusions is necessary to mitigate the negative effects from successful attacks. This dissertation proposed a data mining algorithm called the mining common path algorithm to learn patterns from data for different power system scenarios. The mining common paths algorithm creates common paths which represent a set of critical states that a system will step through in temporal order for a power system scenario. The algorithm provides a time-domain data analysis approach to overcome transients present in the measurements. This is done by mining shared states out of a group of observed paths. The resulting classifier matches monitored system state traversal to common paths to make classfication decisions. In effect, the mining common path algorithm creates a set of temporal signatures for a system which describe scenarios. This approach presented is applicable to many types of industrial control systems where control algoorithms are well known and cyber attack impacts can be examined on a system test bed. Multiple case studies were performed to validate the mining common paths algorithm and the IDS which used common paths created by the mining common paths algorithm. First, to demonstrate the ability of the mining common paths algorithm to learn common paths from complex power system data, a case study was performed to 133
demonstrate the ability to learn common paths for and distinguish SLG ground faults and command injection attacks which remotely trip relays on a 3-bus 2-line transmission system. The experiment applied the mining common paths algorithm to data with 2 classes; faults and command injection. This experiment demonstrated the ability of the mining common paths algorithm to find common paths for both types of scenarios, power system events and cyber-attacks. Furthermore, the experiment demonstrated the precicions of the mining common paths algorithm by showing that faults grouped by location and system load could be accurately distringuished from one another using common paths created by the algorithm. Second, an IDS prototype was built that employs common paths to detect power system disturbances, control actions, and cyber-attacks on a larger scale. The IDS used stateful monitoring of the electric transmission distance protection system by leveraging a fusion of synchrophasor data and information from relay, network security logs, and energy management system logs. The IDS matches monitored system state traversal to common paths to make classification decisions. Classification was specific to each trained scenario rather than simply an indication of normal or abnormal activity. The IDS was trained an evaluated for a 3-bus 2-line transmission system which implemented a 2 zone distance protection scheme. Twenty five scenarios consisting of SLG faults, control actions, and cyber-attacks were implemented on a hardware-in-theloop test bed. Scenarios were run in a loop 10,000 times with randomized system parameters to create a dataset for IDS training and evaluation. The IDS correctly classified 90.4% of tested scenario instances. Evaluation also included a tenfold cross-
134
validation to evaluate the detection accuracy of zero-day attack scenarios. The average detection accuracy for zero-day attack scenarios was 73.43%. Table 6.1 summarizes how the intrusion detection system proposed in this dissertation fulfills the seven requirements introduced in Chapter I. Table 6.1 Req. #
Fulfillment of seven requirements for the proposed IDS Req. Description
How the proposed IDS meets requirements This requirement is met by monitoring the system according to a state machine in 2-D
1
The IDS should provide stateful monitoring.
graph. The state machine contains a number of common paths which represent the patterns of power system scenarios and cyber-attacks. Common paths are mined from data collected across the system.
The IDS should be able to detect power system 2
disturbances, normal control operations and cyber-attacks
25 scenarios were created for power system disturbances, normal control operations and cyber-attacks. The IDS creates a set of unique common paths for each scenario and makes classification according to these common paths.
135
Table 6.1 (Continued) Req. #
Req. Description
How the proposed IDS meets requirements Test cases that have patterns that do not match any of the common paths trained in the IDS
3
The IDS should be able to detect zero day attacks
are classified as zero day attacks. The experiment in Section 5.5 showed that the average detection rate for four unknown scenarios is 73.43%. This is higher than what was reported in [43]. This is done by a data formatting process where a large amount of synchrophasor data and logs are aggregated and processed into a special form called path. A path is a compact
4
The IDS should be able to
representation of large volume of data as it
process large amount of
only consists of a sequence of system states.
data
The mining common paths algorithm is further used to shrink the larger group of paths into a representative set of common paths which represent normal variation and serve as a set of signatures for each scenario.
136
Table 6.1 (Continued) Req. #
Req. Description
How the proposed IDS meets requirements The IDS construction process from data formatting to generating common paths can be automated by software. Although expert
5
The Development of IDS
knowledge is still needed for feature
should have low cost.
quantization and may be used for path grouping, this is huge progress with comparison to [27] where rules are created manually using expertise. Results show the IDS can detect changes in configuration which result from operators taking a line out of service or a relay operating
The IDS should be able to withstand continuous 6
changes to system configuration and load level changes.
after detecting a fault by learning these patterns from collected data. New changes in configuration will result in new scenarios. Since the IDS learns patterns from data, new scenarios will be simulated in the test bed and relevant data will be collected to train the IDS. The IDS overcomes changes in load level by grouping paths according to load level ranges before the common paths learning process.
137
Table 6.1 (Continued) Req. #
Req. Description
How the proposed IDS meets requirements The evaluation results in Section 5.5 has
The IDS should have high 7
detection accuracy and a low false positive rate.
shown that for classifying 25 scenarios 90.4% of the tested instances were correctly classified and 2.7% of the instances were misclassified. 4.7% of instances were classified as unknown and 2.2% were classified as uncertain.
6.2
Future Works This dissertation enables multiple possible future. First, the vulnerability
assessment process presented in this work can be applied to other emerging cyberphysical systems such as advanced metering infrastructure (AMI) and other industrial control systems. As to different cyber-physical systems, different sets of penetration tests can be developed based on the unique structure of the target system and the control and protection algorithms available in the system in order to study the attack consequences on corresponding systems. The fuzzing framework proposed in this work can also be extended to test other industrial protocols such as MODBUS and ANS C12.22 for AMI. While penetration testing is a practical method to assess a target system’s security features, the other method of performing vulnerability assessment is through theoretical methodologies such as Bayesian network and attack tree formulation. The theoretical method can be applied to cyber-physical systems to derive quantitative vulnerability measures in order to determine how likely a vulnerability can be exploited. 138
Second, we have shown that the proposed IDS works for a 3-bus and 2-line transmission system implemented distance protection scheme. However, a realistic power system usually contains thousands of buses and transmission lines. Training the IDS for such a large system will raise other questions, for example, is data from all transmission line required for training? Are all features needed? While PMU are not available for each transmission line, what will be the optimal locations to place PMU in order to collect the data needed for training the IDS? Third, an immediate next step for the IDS will be to implement the IDS in realtime. This requires the IDS to be able to process a continuous stream of synchrophasor data. In this dissertation, for proof of concept the proposed IDS is trained and tested with off-line data. To achieve real-time implementation, two methods can be used. In the first method, the synchrophasor data stream can be first buffered in a historian. Then the common paths of different scenarios can be learned from historian data off-line using mining common paths algorithm but the detection can be implemented in real time to match the system states to the common paths. The second method is to implement the learning process in real-time as well. In this case, the continuous data stream may be windowed to learn paths. The mining common path algorithm might need to be updated so that the known patterns can be refined based on the new path learned from the coming data in a window. The potential problems associated with this method are related to the definition of the size for a window and the start of the window. The start of the window determines the start state of a path. In this dissertation, a path starts from the system normal state. But in a more complex environment where the occurrence of scenarios might overlap, the start of a window may not be easily found. Also, other data mining 139
methods such as stream data mining may be worth investigating to learn patterns from a continuous data stream for the purpose of intrusion detection. Forth, the future plan for intrusion detection will include using pattern recognition techniques to detect anomalies [76][77][78][79]. In addition, the causal event graph theory can be used to develop the intrusion detection for power system .
140
REFERENCES [1] “A systems view of the modern grid,” National Energy Technology Laboratory (NETL), 2007. [Online]. Available: https://www.smartgrid.gov/sites/default/files/pdfs/a_systems_view_of_the_modern _grid.pdf. [2]
“NERC standards critical infrastructure protection CIP-002-3 through CIP-009-3,” North American Electric Reliability Corporation, 2010. [Online]. Available: http://www.nerc.com/page.php?cid=2|20.
[3]
“NISTIR 7628 guidelines for smart grid cyber security: vol. 2, security architecture and security requirements,” The Smart Grid Interoperability Panel – Cyber Security Working Group, 2010. [Online]. Available: http://csrc.nist.gov/publications/nistir/ir7628/nistir-7628_vol2.pdf. 2010.
[4]
“GAO-11-117: Electricity grid modernization: progress being made on cybersecurity guidelines, but key challenges remain to be addressed,” U.S. Government Accountability Office (GAO), 2011. [Online]. Available: http://www.gao.gov/new.items/d11117.pdf.
[5]
A. Cardenas, S. Amin, B. Sinopoli, A. Giani, A. Perrig, and S. S. Sastry, "Challenges for securing cyber physical systems," in DHS Workshop on Future Directions in Cyber-physical Systems Security, July 2009. [Online]. Available: http://cimic.rutgers.edu/positionPapers/cps-security-challenges-Cardenas.pdf.
[6]
Y. Liu, P. Ning and M. K. Reiter, “False data injection attacks against state estimation in electric power grid,” in Proceedings of the 16th ACM Conference on Computer and Communications Security, pp. 21-32, Nov. 2009.
[7]
N. Falliere, L. O’Murchu, E. Chien, “W32.Stuxnet dossier, V 1.4,” Symantec Tech. Rep., 2011. [Online]. Available: http://www.symantec.com/content/en/us/enterprise/media/security_response/whitep apers/w32_stuxnet_dossier.pdf.
[8]
C. Marinez, M. Parashar, J. Dyer, and J. Coroase, “Phasor data requirements for real time wide-area monitoring, control and protection applications,” White Paper, 2005. [Online]. Available: http://citeseerx.ist.psu.edu/viewdoc/summary?doi=10.1.1.122.1737. 141
[9]
“Common cyber security vulnerabilities observed in control system assessments,” INL NSTB Program, Idaho National Laboratory, Nov. 2008. [Online]. Available: http://www.inl.gov/scada/publications/d/inl_nstb_common_vulnerabilities.pdf.
[10] E. O. Schweitzer III, H. J. Altuve, "Real-time synchrophasor applications for widearea protection, control, and monitoring," Schweitzer Engineering Lab, 2009. [Online]. Available: https://www.selinc.com/WorkArea/DownloadAsset.aspx?id=6388. [11] D. E. Bakken, A. Bose, C. H. Hauser, E. O. Schweitzer III, D. E. Whitehead, and G. C. Zweigle, “Smart generation and transmission with coherent, real-time data,” Technical Report TR-GS-015, Washington State University, Aug. 2010. [Online]. Available: www.gridstat.net/trac/raw-attachment/wiki/WikiStart/TR-GS-015.pdf. [12] R. Moxley and D. Dolezilek, "Case studies: synchrophasors for wide-area monitoring, protection, and control," in Proceedings of 2011 the 2nd IEEE PES International Conference and Exhibition on Innovative Smart Grid Technologies, pp.1-7, 5-7, Dec. 2011 [13] S. Horowitz, D. Novosel, V. Madani, and M. Adamiak, “System-wide protection”, IEEE Power & Energy Magazine, vol. 6, no. 6, pp. 34–42, Sep. 2008. [14] V. Madami, M. Adamiak, M. Thakur, "Design and implementation of wide area special protection schemes," in Proceedings of 2004 the 57th Annual Conference for Protective Relay Engineers, pp. 392- 402, Mar. 2004. [15] K. Zhu, M. Chenine, L. Nordstrom, "ICT architecture impact on wide area monitoring and control systems' reliability," IEEE Transactions on Power Delivery, vol.26, no.4, pp.2801-2808, Oct. 2011. [16] R. Fink, D. Spencer, and R. Wells, “Lessons learned from cyber security assessments of SCADA and energy management systems,” Idaho National Laboratory, Sep. 2006. [Online]. Available: http://energy.gov/sites/prod/files/oeprod/DocumentsandMedia/1NSTB_Control_Systems_Security_Standards_Accomplishments_and_Impacts.pdf. [17] “Wireless procurement language in support of advanced metering infrastructure security,” Idaho National Laboratory, Aug. 2009. [Online]. Available: http://www.inl.gov/scada/publications/d/inl-ext-09-15658_ami_proc_language.pdf. [18] I. Nai Fovino, L. Masera, L. Guidi, and G. Carpi, “An experimental platform for assessing SCADA vulnerabilities and countermeasures in power plants,” in Proceedings of the 3rd Conference on Human System Interactions, pp. 679-686, 2010.
142
[19] B. Skaggs, B. Blackburn, G. Manes, S. Shenoi, "Network vulnerability analysis," in Proceedings of 2002 the 45th Midwest Symposium on Circuits and Systems, vol.3, pp. III-493-5, Aug. 2002. [20] Wurldtech Security Technologies Inc. http://www.wurldtech.com/ [21] MU Dynamics. http://www.mudynamics.com/ [22] A. Bykhovsky, J. Chow, “Power system disturbance identification from recorded dynamic data at the Northfield substation,” Electrical Power and Energy Systems, vol. 25, no. 10, pp. 787-795, Dec. 2003. [23] T. Bi, X. Song, J. Wu, Q. Yang, “Novel method for disturbance identification in power system,” presented at 2006 IEEE Power Engineering Society General Meeting, Montreal, QC, Canada, 2006. [24] J. Dong, J. Zuo, L. Wang, K. Kook, I. Chung, Y. Liu, S. Affare, B. Rogers, and M. Ingram, "Analysis of power system disturbances based on wide-area frequency measurements," in Proceedings of 2007 IEEE Power Engineering Society General Meeting, pp.1,8,24-28 Jun. 2007. [25] M. Karthikeyan, V. Malathi, “Wavelet-support vector machine approach for classification of power quality disturbances,” International Journal of Recent Trends in Engineering, vol. 1, no. 3, pp. 290-293, 2009. [26] S. Santoso, J. Lamoree, “A scalable PQ event identification system,” IEEE Transactions on Power Delivery, vol. 15, pp. 738-743, 2000. [27] R. Mitchell, I.-R. Chen, "Behavior-rule based intrusion detection systems for safety critical smart grid applications," IEEE Transactions on Smart Grid, vol.4, no.3, pp.1254-1263, 2013. [28] R. Borges, J. Beaver, M. Buckner, T. Morris, U. Adhikari, S. Pan, “Machine learning for power system disturbance and cyber-attack discrimination,” in Proceedings of 2014 Resilience Week, Aug. 2014. [29] Y. Yang, K. McLaughlin, S. Sezer, T. Littler, B. Pranggono, P. Brogan, H. Wang, "Intrusion detection system for network security in synchrophasor systems," in Proceedings of IET International Conference on Information and Communications Technologies, pp.246-252, 2013. [30] B. Sikdar, J. Chow, "Defending synchrophasor data networks against traffic analysis attacks," IEEE Transactions on Smart Grid, vol.2, no.4, pp.819-826, 2011. [31] R. Agrawal, R. Srikant, "Mining sequential patterns," in Proceedings of the 11th International Conference on Data Engineering, pp. 3-14, Mar. 1995.
143
[32] F. Lin, S. Chen, S. Pan, Y. Chen, “Mining time dependency patterns in clinical pathways,” International Journal of Medical Informatics, vol. 62, no. 1, pp. 11-25, 2001. [33] F. Lin, C. Chiu, S. Wu, "Using Bayesian networks for discovering temporal-state transition patterns in hemodialysis," in Proceedings of the 35th Annual Hawaii International Conference on System Sciences, pp. 1995-2002, Jan. 2002.
[34] J. Han, M. Kamber, J. Pei, Data Mining Concepts and Techniques, 3rd Edition, Morgan Kaufmann Press, 2012. [35] C.W. Ten, J. Hong, C.C. Liu, "Anomaly detection for cybersecurity of the substations," IEEE Transactions on Smart Grid, vol.2, no.4, pp.865-873, Dec. 2011. [36] Y. Chen, B. Lou, “S2a: Secure smart household appliances,” in Proceedings of the 2nd ACM Conf. Data Application Security Privacy, pp.217-228, Feb. 2012. [37] Zhang, Y., Wang, L., Sun, W., Green, R.C., Alam, M., "Distributed intrusion detection system in a multi-layer network architecture of smart grids," IEEE Transactions on Smart Grid, vol.2, no.4, pp.796-808, Dec. 2011. [38] H. Hadeli, R. Schierholz, M. Braendle, C. Tuduce, "Leveraging determinism in industrial control systems for advanced anomaly detection and reliable security configuration," in Proceedings of 2009 IEEE Conference on Emerging Technologies & Factory Automation, pp.1-8, Sep. 2009. [39] R. Berthier, W. Sanders, "Specification-based intrusion detection for advanced metering infrastructures," in Proceedings of 2011 IEEE the 17th Pacific Rim International Symposium on Dependable Computing, pp.184-193, Dec. 2011. [40] J. Valenzuela, J. Wang, N. Bissinger, "Real-time intrusion detection in power system operations," IEEE Transactions on Power Systems, vol.28, no.2, pp.10521062, May 2013. [41] M. Talebi, J. Wang, Z. Qu, “Secure power systems against malicious cyber-physical data attacks: protection and identification,” World Academy of Science, Engineering and Technology, vol. 6, no. 6, pp. 112-119, 2012. [Online]. Available: http://waset.org/publications/6605/secure-power-systems-against-malicious-cyberphysical-data-attacks-protection-and-identification. [42] S. Zonouz, K.M. Rogers, R. Berthier, R.B. Bobba, W.H. Sanders, T.J. Overbye, "SCPSE: Security-oriented cyber-physical state estimation for power grid critical infrastructures," IEEE Transactions on Smart Grid, vol.3, no.4, pp.1790-1799, Dec. 2012. [43] W. Lee, S. Stolfo, K. Mok, “A data mining framework for building intrusion detection models,” in Proceedings of 1999 IEEE Symposium on Security and Privacy, pp. 120-132, 1999. 144
[44] J.L. Lin, X.S. Wang, S. Jajodia, “Abstraction-based misuse detection: high-level specifications and adaptable strategies,” in Proceedings of the 11th IEEE Computer Security Foundations Workshop, pp.190-201, Jun. 1998. [45] J.P. Pouzol, M. Ducasse, “Formal specification of intrusion signatures and detection rules,” in Proceedings of the 15th IEEE Computer Security Foundations Workshop, pp. 60, Jun. 2002. [46] “Cyber Security Procurement Language for Control Systems, Building Security into Control Systems,” Department of Homeland Security, 2009. [Online]. Available: http://www.us-cert.gov/control_systems/pdf/FINALProcurement_Language_Rev4_100809.pdf. [47] “Recommended security controls for federal information systems and organizations,” National Institute of Standards and Technology (NIST) Special Publication 800-53 Revision 3, Aug. 2009. [Online]. Available: http://csrc.nist.gov/publications/nistpubs/800-53-Rev3/sp800-53-rev3-final.pdf. [48] “Catalog of control systems security: recommendations for standards developers,” Control Systems Security Program, National Cyber Security Division, Department of Homeland Security, Sep. 2009. [Online]. Available: http://www.uscert.gov/control_systems/pdf/Catalog_of_Control_Systems_Security_Recommenda tions.pdf. [49] M. Sutton, A. Greene, and P. Amini, Fuzzing, Brute Force Vulnerability Discovery, Upper Saddle River, NJ: Pearson Education Inc. 2007. [50] “IEEE Standard C37.118–2005 (Revision of IEEE Std. 1344–1995),” IEEE Standard for Synchrophasors for Power Systems, 2006. [51] A. Takanen, J. Demott, and C. Miller, Fuzzing for Software Security Testing and Quality Assurance, Norwood, MA: Artech House, Inc. 2008. [52] Ettercap, [Online]. Available: http://ettercap.github.io/ettercap/. [53] ZZUF, [Online]. Available: http://caca.zoy.org/wiki/zzuf. [54] SCAPY, [Online]. Available: http://www.secdev.org/projects/scapy/. [55] CERT Basic Fuzzing Framework, [Online]. Available: http://www.cert.org/vuls/discovery/bff.html. [56] T. Morris, S. Pan, U. Adhikari, N. Younan, R. King, and V. Madani, “Cyber security testing and intrusion detection for synchrophasor systems,” International Journal of Cyberspace Sciences and Emergency Management, accepted for publication. 145
[57] Quick Draw SCADA IDS, [Online]. Available: http://www.digitalbond.com/tools/quickdraw/.
[58] R. Sprabery, T. Morris, S. Pan, U. Adhikari, “Protocol mutation intrusion detection for synchrophasor communications,” in Proceedings of the 8th Annual Cyber Security and Information Intelligence Research Workshop, Jan, 2013 [59] G. Andersson, P. Donalek, R. Farmer, N. Hatziargyriou, I. Kamwa, P. Kundur, N. Martins, J. Paserba, P. Pourbeik, J. Sanchez-Gasca, R. Schulz, A. Stankovic, C. Taylor, V. Vittal, “Causes of the 2003 major grid blackouts in North America and Europe, and recommended means to improve system dynamic performance,” IEEE Transactions on Power Systems, vol. 20, no. 4, pp. 1922-1928, 2005. [60] Y. Huang, A. Cardenas, S. Amin, Z.-S. Lin, H.-Y. Tsai, and S. Sastry, “Understanding the physical and economic consequences of attacks on control systems,” International Journal on Critical Infrastructure Protection vol. 2, no. 3, pp. 73-83, 2009. [61] A. Bose, “Power system stability: new opportunities for control,” in Stability and Control of Dynamical Systems with Applications, New York: Springer, 2003. [62] P. Anderson, Analysis of Faulted Power Systems, Wiley-IEEE Press, 1995. [63] H. Saadat, Power System Analysis, PSA Publishing, 2010. [64] Metasploit, [Online]. Available: http://www.metasploit.com/. [65] D. Salmon, M. Zeller, A. Guzman, V. Mynam, and M. Donolo, “Mitigating the aurora vulnerability with existing technology,” Schweitzer Engineering Laboratories, Inc. [Online]. Available: https://www.selinc.com/WorkArea/DownloadAsset.aspx?id=6379. [66] Q. Chen, S. Abdelwahed, A. Erradi, “A model-based validated autonomic approach to self-protect computing systems,” IEEE Internet of Things Journal, no. 99, pp. 114. 2014. [67] H. Lin, Y. Deng, S. Shukla, J. Thorp, and L. Mili, "Cyber security impacts on allPMU state estimator - a case study on co-simulation platform GECO," in Procedings 2012 IEEE Third International Conference on Smart Grid Communications, pp.587-592, Nov. 2012. [68] M. Al Karim, M. Chenine, K. Zhu, and L. Nordstrom, "Synchrophasor-based data mining for power system fault analysis," in Proceeding 2012 3rd IEEE PES International Conference and Exhibition on Innovative Smart Grid Technologies (ISGT Europe), pp.1-8, Oct. 2012.
146
[69] N. Dahal, “Synchrophasor data mining for situational awareness in power systems,” Ph.D. dissertation, Mississippi State University, Mississippi State, MS, 2012. [70] J. Han, J. Pei, Y. Yin, and R. Mao, “Mining frequent patterns without candidate generation: a frequent-pattern tree approach,” Data Mining and Knowledge Discovery, vol. 8, no. 1, pp. 53-87, Jan. 2004. [71] M. Zeller, “Myth or reality-does the aurora vulnerability pose a risk to my generator,” in Proceedings of the 37th Annu. Western Protective Relay Conf., Spokane, WA, Oct. 2010. [72] W. Lin, C. Yang, J. Lin, and M. Tsay, "A fault classification method by RBF neural network with OLS learning procedure," IEEE Transactions on Power Delivery, vol. 16, pp. 473-477, 2001. [73] R. Aggarwal, Q. Xuan, R. Dunn, A. Johns, and A. Bennett, "A novel fault classification technique for double-circuit lines based on a combined unsupervised/supervised neural network," IEEE Transactions on Power Delivery, vol. 14, pp. 1250-1256, 1999. [74] B. Chowdhury, K. Wang, "Fault classification using Kohonen feature mapping," in Proceedings the 1996 International Conference on Intelligent Systems Applications to Power Systems, pp.194-198, 1996. [75] K. Silva, B. Souza, and N. Brito, "Fault detection and classification in transmission lines based on wavelet transform and ANN," IEEE Transactions on Power Delivery, vol. 21, pp. 2058-2063, 2006. [76] B. Ma and Q. Du, "Hyperspectral targe detection with sparseness constraint," in Proceedings of IEEE International Geoscience and Remote Sensing Symposium, Melbourne, Australia, Jul. 2013. [77] B. Ma and Q. Du, "Improvement of background characterization for hyperspectral target detection," in Proceedings of IEEE 4th IEEE GRSS Workshop on Hyperspectral and Signal Processing: Evolution in Remote Sensing, Shanghai, China, Jun. 2012. [78] H. Yang, B. Ma, and Q. Du, "Decision fusion for supervised and unsupervised hyperspectral image classification," in Proceedings of IEEE Geoscience and Remote Sensing Symposium, Cape Town, South Africa, Jul. 2009. [79] H. Yang, B. Ma, Q. Du, and L. Zhang, "Comparison of spectral-spatial classification for urban hyperspectral imagery with high resolution", in Proceedings of Joint Urban Remote Sensing Event, Shanghai, China, May 2009.
147
[80] A. Srivastava, T. Morris, T. Ernster, C. Vellaithurai, S. Pan, and U. Adhikari, “Modeling cyber-physical vulnerability of the smart grid with incomplete information,” IEEE Transactions on Smart Grid. Vol. 4, No.1, pp.235-244, Mar. 2013. [81] U. Adhikari, T. Morris, S. Pan, “A cyber-physical power system test bed for intrusion detection systems,” in Proceedings of the 2014 IEEE Power Energy Society General Meeting (PESGM), Jul. 2013. [82] U. Adhikari, T. Morris, N. Dahal, S. Pan, R. King, N. Younan, V. Madani, “Development of power system test bed for data mining of synchrophasors data, cyber-attack and relay testing in RTDS,” in Proceedings of IEEE Power Energy Society General Meeting, pp. 1-7, Jul. 2012. [83] T. Morris, U. Adhikari, S. Pan, “Cyber security recommendations for wide area monitoring, protection, and control systems,” in Proceedings of IEEE Power Energy Society General Meeting, pp. 1-6, Jul. 2012. [84] S. Pan, T. Morris, U. Adhikari, “Causal event graphs cyber-physical system intrusion detection system,” in Proceedings of the 8th Annual Cyber Security and Information Intelligence Research Workshop, Jan., 2013. [85] U. Adhikari, T. Morris, S. Pan, “A causal event graph for cyber-power system events using synchrophasor,” in Proceedings of the 2014 IEEE Power Energy Society General Meeting, Jul. 2014.
148