Daily Life Behaviour Monitoring for Health Assessment using. Machine Learning: .... server where the collected data is aggregated and pro- cessed, hence ...
Noname manuscript No. (will be inserted by the editor)
Daily Life Behaviour Monitoring for Health Assessment using Machine Learning: Bridging the gap between domains Hande Alemdar · Can Tunca · Cem Ersoy
Received: date / Accepted: date
Abstract Analysis of human behaviour for deducing health and well-being information is one of the contemporary challenges given the ageing in place. To this end, existing and newly developed machine learning methods are needed to be evaluated using annotated realworld datasets. However, the metrics used in performance evaluation are directly taken from the machine learning domain and they do not necessarily consider the specific needs of human behaviour analysis such as recognizing the duration, start time and frequency of the activities. Moreover, the commonly used metrics such as accuracy or f-measure can be misleading in the presence of skewed class distributions as in the case of human behaviour recognition. In this study, we evaluate the performance of two machine learning methods, hidden Markov model (HMM) and time windowed neural network (TWNN) on five different real-world datasets through human behaviour understanding for health assessment perspective. According to the experimental results, standard metrics fail to reveal the actual performance of the two compared machine learning methods in terms of behaviour recognition. On the other hand, the proposed evaluation mechanism which considers three different activity categories leads to a more realistic evaluation of the overall performance. Keywords Activities of Daily Living · Behaviour Monitoring · Performance Evaluation · Machine Learning · Smart Homes This work is supported by the Bo˘ gazi¸ci University Research Fund under the grant number 8684 H. Alemdar · C. Tunca · C. Ersoy Bo˘ gazi¸ci University, Department of Computer Engineering Istanbul, Turkey E-mail: {hande.alemdar,can.tunca,ersoy}@boun.edu.tr
1 Introduction With the rapidly ageing world population, ever- increasing health care costs put economic pressure both on governments and individuals. The need for self managing health in partnership with health care providers is inevitable. When a caretaker or a relative live with an elderly or disabled person, health state changes can easily be detected since they are indicated by changes in the activities of daily life, for example changes in the eating or sleeping behaviour. Unfortunately, the growing population of the elderly make it prohibitive to assign a human caretaker for all homes with elderly residents. For that reason, ambient assisted living (AAL) systems which enable relatives and health personnel to monitor everyday behaviour of the elderly living alone are needed. In order to make such long term health monitoring systems sustainable, we need smart environments in which the human activities, hence the human behaviour are recognized automatically [4, 21]. Everyday behaviour is closely related with the health state of an individual and can be deduced by examining the activities of daily living in terms of start time, duration, and frequency. If changes in human behaviour can be detected, situations that require further health evaluation can be identified. Some of these changes concern short term, like recent changes in the last few days, like very frequent usage of the toilet that may indicate that the person may have a urinary infection. On the other hand, some of the behaviour changes concern, several months or even years, like preparation of meals are getting longer and longer, and newspaper reading is getting shorter and shorter which may indicate to either mild cognitive impairment or more serious forms of dementia.
2
Hande Alemdar et al.
ActualFSleepingFActivity 7GroundFTruth)F
InferenceFMethodF1 AccuracyFFFF=F86F0 F-measureF=F83F0
InferenceFMethodF2 AccuracyFFFF=F71F0 F-measureF=F83F0
t0 .F.F.
.F.F. t10 .F.F.
.F.F. t20
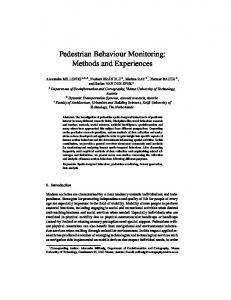
Fig. 1: Two example of inference output sequence for sleeping activity with the same F-measure performance according to time-slice based evaluation
Other short term behaviour change examples which may raise the flag for further inspection are: skipping meals which indicate lack of appetite, excessively long sleeping and lack of social interaction which may be caused by depression. In fact, other sleep disorders, such as shorter and fragmented sleeping may also be caused by certain health problems, or at least should be attended so that they will not become health problems [3, 8]. Identifying short-term behaviour change is easier since automated everyday behaviour monitoring systems can follow the start times, durations and frequencies of everyday activities. Of course, the weekday, weekend behaviours or seasonal everyday behaviours can be quite different and the monitoring system should be flexible enough to adapt to these expected changes. Long term behaviour changes which may be indicators of health problems are more difficult to identify. It is quite normal to expect that after a certain age, every year, an elderly person may have degrading physical and mental capacity. However, even for a human caretaker, it is not easy to tell when to raise the flag and call for health personnel for further evaluation. Performing some tasks slower may be caused by some orthopedic problems, as well as some form of dementia. On the other hand, introduction of a new home appliance with a new user interface or some other environmental changes can also play a role in these changes. Some everyday behaviours are indirectly related with health such as eating behaviour or social interaction among residents of the house. On the other hand, some everyday behaviours may have a more direct impact on the health such as the behaviour of the person related to the medication intake. Frequent changes in the time of medicine, skipping or duplicating medicine intake may have immediate consequences in terms of the health of the person. It is a well-known fact that the quality of the sleep is also directly related with the health of the person. Sleep disorders such as insomnia either may be an indicator of deeper health problems or if not attended may result in serious health problems.
In order to make automated health monitoring systems accurate and robust enough to be commercialized, significant research effort is currently being spent. [1] Several research groups built test environments equipped with sensors and recorded annotated datasets in order to evaluate the performance of novel machine learning methods. However, most of these evaluations are performed in terms of recognition of activities on a timeslice level. The metrics widely used in machine learning domain such as accuracy, precision, recall and Fmeasure are directly being used in the behaviour understanding domain. Although the metrics are solid, they may fail to reveal the actual performance in terms of behaviour understanding. Consider the scenario in Fig. 1 and assume that inference method 1 and 2 are being proposed in order to identify sleeping behaviour and their time-slice level outcome is being compared to the ground truth sleeping activity. From a machine learning perspective, both methods have the same F-measure performance of 83% and the first method have higher accuracy than the second method. From a behaviour monitoring perspective, the output of the first method indicates that the person may have a sleeping disorder whereas the output of the second method identifies the normal sleeping behaviour correctly with a shift in start the time. This article extends the previous work with an evaluation of the state-of-the-art from a behaviour recognition perspective rather than using standardized machine learning metrics. We use two different real-world datasets collected by two different research groups for experimental evaluation. We use two separate machine learning models from two different categories in order to compare and contrast the strengths and weaknesses of each category. We use a hidden Markov model (HMM) from the generative model family and use a time windowed neural network (TWNN) from the discriminative model family. The rest of the paper is organized as follows. In Section 2, we summarize some of the related research effort. In Section 3, we give the details of the proposed evaluation methodology together with the datasets and models used. In Section 4, we describe the experimental setup and provide the results of our experiments together with a discussion on the outcome of the experiments. Finally, Section 5 concludes the paper. 2 Related Work In order for the automatic human behaviour monitoring research to become mature, the community needs realistic benchmark datasets to work on; to develop efficient machine learning methods to understand human
Daily Life Behaviour Monitoring for Health Assessment using Machine Learning
behaviour; and to find appropriate evaluation methods serving the specific needs of human behaviour understanding. The research effort on smart environments has two main branches. In the first branch, there are studies where several sensors are deployed in smart laboratory houses [17, 11, 14, 10]. Those studies generally focus on human interactions with the smart environments and do not necessarily have a healthcare focus. The second branch is comprised of studies that focus on human behaviour monitoring for health assessment purposes [5,16, 7, 23, 12]. In [23], the authors employed reed and piezoelectric switches in two different homes on various household elements and electronic appliances ranging from doors, windows, cabinets, lamps, toilets, showers, light switches to refrigerators, ovens and stoves, with the aim of recognizing more than 20 activities. A naive Bayes classifier, which exhibits a performance of 25% to 89% depending on the evaluation metric, is utilized. In another study [16], van Kasteren et al collected data for 28 full days via 14 binary sensors (e.g., passive infrared, pressure mat and reed switches) in a real house. The data was annotated automatically by a voice recognition software processing the recordings obtained via a Bluetooth headset. Seven different activities were classified using hidden Markov models (HMMs) and conditional random fields (CRFs) with an accuracy of 79.4%. In [6], the authors introduce an unobtrusive elderly monitoring and assisted living application that employs current and water flow measurement sensors on home appliances to detect excessive usage of resources and force sensors on the bed to determine the sleeping patterns. The proposed architecture also includes a central server where the collected data is aggregated and processed, hence enabling the notification of related people in case of an abnormal situation. The system was deployed in a two-bedroom house. However, no performance evaluation results are presented. In a similar study [22], wellbeing of the elderly is monitored using a variety of wireless ambient sensors in the home setting. Apart from the sensors connected to the home appliances, force and contact sensors were attached to frequently used household items such as bed, couch, chairs, cabinets and fridge to monitor their usage throughout the day. Two different wellness functions are defined that are computed using the monitored household item and home appliance usage. The system was deployed in four houses and real-time data regarding the wellness of the elderly was collected for a whole week. An alternative system is presented in [18], where accelerometers were attached to the sanding hand blocks to monitor the exercise level and routine of the
3
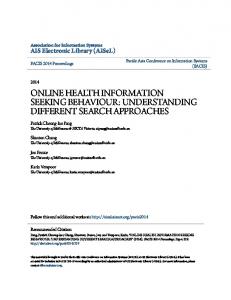
Fig. 2: Event Error Assignments [25]
elderly, rather than attempting to infer the daily activities. Another system utilizing body area networks for the purposes of physical activity monitoring is presented in [9]. Most of the relevant literature used standard metrics directly taken from machine learning domain. In machine learning, the standard evaluations are based on four different types of outcomes. The correct outcomes are true positives (TP) and false negatives (FN) and the errors are false positives (FP) and false negatives (FN). Ward et al. [25] introduced an extended set of performance metrics for evaluating continuous activity recognition methods. The proposed metrics make use of six different types of errors. They call FP as an Insertion error and FN as Deletion error. Then they extend the error definitions to include also Merge, Overfill, Underfill, and Fragmentation errors. These error definitions are not based on time-slices but based on segments. A segment is defined as the largest part of an output sequence on which the comparison between ground truth and the output sequence can be made in an unambiguous way. An event is defined as any single occurrence of an activity. Using segment level error assignments, event level error assignments can be made in 8 different categories. Four of these categories belong to ground truth events: deletions (D), fragmented (F), fragmented and merged (FM) and merged (M). The remaining four belong to output events: merging (M’), fragmenting and merging (FM’), fragmenting (F’) and insertions (I’). The events that do not belong to any error category are identified as correct (C). In Fig. 2, the error types are depicted on a sample recognition output scenario.
3 Performance Evaluation from Behaviour Monitoring Perspective In this section, we first describe the methodology we use for evaluating the performance of machine learning methods from a behaviour monitoring perspective. Then, we describe the datasets used for evaluation of two different machine learning methods: hidden Markov models (HMM) and time windowed neural networks (TWNN). We provide the details of these methods in Sec. 3.3.
4
Hande Alemdar et al.
3.1 Evaluation Methodology In evaluations we use two levels. In the first level, we use sensitivity (true positive rate) and specificity (true negative rate) analysis based on time-slice performance.
Sensitivity = T P/P = T P/(T P + F N )
(1)
Specif icity = T N/N = T N/(F P + T N )
(2)
Sensitivity and specificity provide an overview of the recognition performance but hide the detailed information about the errors. For instance, we observe the total number of erroneous time-slices but we cannot infer any information about the nature of these errors. The errors can be grouped at a specific position or distributed across the sequence or they can be occurring at the beginning or at the end of the activity. From a machine learning perspective, all types of errors should be eliminated as much as possible. From a behaviour analysis perspective, different error types can lead to different meanings about health status of the people being monitored. Depending on the activity type, some errors may not be so harmful to the outcome and some errors have more severe impact on the outcome. For that reason, a second level of analysis is required. In the second level, we analyze the performance using not the time-slices but the activity occurrences (events). For the event based analysis, we use event analysis diagrams (EAD) [25]. In the following subsections, we define time-slice and event level error types we use. 3.1.1 Time-slice Level Error Types At time-slice level, we use the following categories for false negative (FN) errors: – Deletion (Dt ) occurs when a time-slice corresponds to a deleted event. – Fragmenting (Ft ) occurs when a FN is between two TP segments. – Start Underfill (Ua ) occurs when starting segment of an event is deleted. – End Underfill (Uω ) occurs when an ending segment of an event is deleted. Likewise, the following categories are defined for false positive (FP) errors: – Insertion (It ) occurs when an activity time-slice that has no corresponding time-slice in the ground truth is produced as output.
– Merge (Mt ) occurs when a FP is between two TP segments. – Start Overfill (Oa ) occurs when starting segment of an event is inserted falsely. – End Overfill (Oω ) occurs when an ending segment of an event is inserted falsely. Defining several error categories provides the information about the nature of the errors, yet still event level analysis is required in order to get a glimpse of the big picture on the behaviour level. 3.1.2 Event Level Error Types At the event level, the error types are categorized according to the ground truth events and output events that are inferred by the inference method as depicted in Fig 2. There are two categories at the event level: ground truth events and output events complement each other’s error types. For the ground truth events the error types are defined as follows: – Deletion (D) occurs when an occurrence of an activity is completely missed. – Fragmented (F ) events occurs when a ground truth activity is output as several fragments. – Merged (M ) events occurs when several instances of ground truth activity are output as a single event. – Fragmented and Merged (F M ) events occurs when a ground truth event is both merged and fragmented. The output event counterparts of the ground truth events are given as: – – – –
Insertion (I0) Fragmenting (F 0) Merging (M 0) Fragmenting and Merging (F M 0)
Any event that does not fall in these categories is defined to be a correct (C) event. Fig 2 depicts an example sequence containing whole event error types together with correct events. 3.1.3 Evaluation of Activity Recognition Performance with a Behaviour Analysis Perspective In order to evaluate the performance in terms of behaviour recognition, we map the error types to activity types as being negligible and non-negligible. We define three categories of activities for this purpose: – Duration sensitive activities are the ones that only the total duration of the activity is important in terms of medical assessment. For example, relaxing activities such as watching tv, reading a book, leaving the house, or other activities like cleaning the
Daily Life Behaviour Monitoring for Health Assessment using Machine Learning
5
Table 1: Information about datasets used in experiments
House A
ARAS House B
# of Sensors House Type House Information
20 50m2 Apartment bedroom, living room, kitchen, bathroom
Resident Gender Resident Age Data Duration # of Activities
Male 25 29 days 14
20 90m2 Apartment 2 bedrooms, living room, kitchen, bathroom Female 32 11 days 12
house, studying and talking on the phone can be categorized in this group. For the duration sensitive activities, event level merging and fragmentation errors can be considered as correct events, in turn, time-slice based metrics such as overfill and underfill errors are given more weight in the performance evaluation. – Frequency sensitive activities are the ones only the number of occurrences matters in terms of medical assessment. Having a snack or drink, brushing teeth, taking medicine are the candidate activities for this category. The important error types for this activity category are the fragmentation and merging errors since they can lead to wrong interpretations about the frequency of the activity. Timing errors such as overfill and underfill can be classified as correct events since they do not change the frequency output. – Duration and frequency sensitive activities are the activities for which both the duration and the frequency are essential. Sleeping, toileting, taking a shower, preparing and eating meals belong to this category. All error metrics should be considered in the recognition performance evaluation for this type of activities. Based on these categories and the error types defined in the previous sections, we provide a more objective performance evaluation for different behaviour monitoring systems. For this purpose, we first categorize the daily activities according to their frequency and duration sensitivity values. After that, we assign the relevant error metrics for the specified activity group in the second step. We provide a general categorization of activities together with our recommended evaluation metrics in Table 2. Proposed method is easily generalizable to other activities that are not listed. Once a domain expert such as a physician or another healthcare professional decides the type of the activity, the recom-
Kasteren House B
House A 14 Apartment 2 bedrooms, living room, kitchen, bathroom, toilet Male 26 25 days 10
22 Apartment bedroom, living room, kitchen, bathroom Male 28 13 days 14
House C 21 2-storey house 3 bedrooms, living room, kitchen, 2 bathrooms Male 57 18 days 16
mended metrics for an evaluation with a behavioural perspective is easily determined. Table 2: General Categorization of Activities Activity Recommended Sensitivity Metric Duration Frequency Time-slice Event Sleep high Shower Toilet Outside Watch TV Study high Telephone Change clothes Play piano Relax Prepare meal Have meal medium Brush teeth Shave Wash dishes medium Snack low Drink Take medicine
high
yes
yes
low
yes
no
high
yes
yes
low
yes
no
high
no
yes
3.2 Datasets for Behaviour Monitoring Annotated datasets are required to develop novel machine learning algorithms and to evaluate their performance in inferring human behaviour. However, recording and annotating these datasets are costly since they require time and human effort. Hence, the publicly available annotated datasets are of significant importance to the research community. The datasets recorded in real world conditions rather than laboratory settings
6
Hande Alemdar et al.
are even more difficult to obtain and also more valuable since they reflect the natural human behaviour. In this study, we use five different publicly available real-world datasets collected in different smart homes. Two of the datasets are from the ARAS datasets [2], the remaining three are taken from ‘Kasteren’ datasets [15]. Table 1 summarizes the information about the datasets in terms of house types, residents demographics, sensors and activities included. All smart homes are equipped with binary sensors such as photocells, pressure mats, contact sensors, proximity sensors, float sensors, infrared receivers. The activities recorded include leaving the house, toilet use, showering, brushing teeth, sleeping, preparing a meal, having a meal, having a snack, dressing, and watching tv.
Activities
S0
S1
St
St+1
ST
O10
O11
O1t
O1t+1
O1T
O20
O21
O2t
O2t+1
O2T
OK0
OK1
OKt
OKt+1
OKT
Sensor Values
Fig. 3: Hidden Markov model for activity recognition from binary sensors. N softmax outputs for N classes yn
y1
...
3.3 Methods for Behaviour Understanding Machine learning methods for classification are grouped into two main categories: discriminative and generative models. Given the training data, discriminative models learn the boundary between classes whereas generative models model the distribution of individual classes. A common view on the generalization performance of generative models is that their performance is poorer than the performance of discriminative models due to differences between the model and the true distribution of the data. However, generative methods are preferred when the size of the training data is limited, since they can exploit unlabeled data in addition to labelled data. When the size of annotated training data is large enough, discriminative models result in higher generalization performance [19]. Because of their differences, we selected one classifier from each category in order to generalize the evaluation. We use the hidden Markov model and the time windowed neural network since they are well-suited for modeling the sequential nature of human activities. 3.3.1 Hidden Markov Model A hidden Markov model (HMM) is a temporal probabilistic model that has been widely used in applications where the nature of the data is sequential such as speech recognition, optical character recognition and activity recognition [20, 13, 16]. As depicted in Figure 3, the hidden states correspond to the activities performed and the observations correspond to the sensor readings. There are three factors in the distribution. π = p(S0 ) A=
K Y i=1
p(Oti | St )
(3) (4)
yN
...
vnh
bias term
z0 = +1
...
zh
zH
...
bias term
H sigmoid hidden units
whj
x0 = +1
... xt-T
... xt-1
xt
xt+1
xt+T
Data window input of size 2T+1
Fig. 4: Time windowed neural network model B = p(St | St−1 )
(5)
where π is the initial state distribution, A is the observation probability distribution, and B is the transition probability distribution. These three factors correspond to the three parameters of the HMM. We use the maximum likelihood method for learning the parameters and the well-known Viterbi algorithm for inference. 3.3.2 Time Windowed Neural Network A time windowed neural network (TWNN) is an artificial neural network model we proposed as an extension to the time-delay neural networks (TDNN) [24]. TDNNs aim to capture the sequential nature of time series data by also feeding previous inputs delayed in time along with the input belonging to the targeted time instance. The sequentially aggregated input is then fed into a feed-forward multilayer architecture which implements sigmoid activation units in its hidden layers.
Daily Life Behaviour Monitoring for Health Assessment using Machine Learning
TWNN extends this idea by also incorporating the future inputs, thus constructing a time window around the targeted time instance. Such an approach is especially useful for human activity inference purposes, since utilizing the data related to the activities following a specific time instance can provide significant information on the activity performed at that particular time, due to the temporally dependent (both forwards and backwards in time) nature of human behaviour. The TWNN model used in this work (with a single hidden layer) is depicted in Figure 4. The operation of TWNN is defined as: T x) = zh = sigmoid(wh
T on = vn z=
H X
1 P −( D j=1 whj xj +wh0 )
4.1 Experiment Setup
(7)
Data obtained from the sensors is transformed into timeslices of length ∆t = 60 seconds. We split the data into a test and training set using a ‘leave one day out’ approach. In this approach, one full day of sensor readings are used for testing and the remaining days are used for training. We cycle over all the days in the dataset, so that each day is used exactly once for evaluation. For the TWNN classifier, a single hidden layer model with 12 hidden units is constructed. The model is trained by performing 20 epochs over the training sets with the learning factor of 0.01. The window size is selected as 21 (corresponding to T = 10). All the experiments are conducted on the experiment framework software developed by the authors using Matlab. The repository is provided in github.com/ cmpe-aras/perf-eval-behavioural.
(8)
4.2 Results
(6)
1+e
vnh zh + vn0
7
h=1
exp on yn = softmax(on ) = P exp oi i
where xj denotes individual features in a time window composed of D = (2T + 1) ∗ K features. wh is the first layer weights for the hidden unit h, vn denotes the second layer weights for the output n, zh denotes the output of the hidden unit h, and yn denotes the output of the second layer. The softmax operator scales the output of the hidden layer ensuring that a single output is close to 1 and the other outputs are close to 0, thus acting as a selector among different classes. For training the TWNN model, we use the widely used backpropagation algorithm. Online learning, for which individual instances of the training set are fed to the neural network in random order, is employed. The rate at which an individual instance contributes to the learning process is determined by the learning factor parameter. A random order pass over the whole training set denotes an epoch. Multiple epochs are performed to achieve good convergence.
4 Experimental Evaluation In the experimental evaluation, we answer two questions: Which of the machine learning methods are better suited for behaviour monitoring rather than activity recognition only? What are the strength and weaknesses of the methods in terms of behaviour monitoring? In the following subsection we describe our experimental setup. Then, we give results of the experiments on five datasets taken from ARAS and Kasteren, for both machine learning models, HMM and TWNN, using two levels, time-slice and event level.
HMM vs. TWNN on ARAS Datasets. Time-slice based performance of all activities in ARAS datasets are provided in Fig. 5 and Fig. 6 for HMM and TWNN respectively. For each house, the graphs at the top depict the true positive ratio together with the false negative error types for each activity. Similarly, the graphs at the bottom provide the true negative ratio together with the false positive error types. For both houses in ARAS datasets, the false negative rates are rather low with two exceptions of having a meal and watching tv activities for House A. Falsely inserted time-slices are the most common error types for all houses and methods. In terms of true positive rates, there are significant differences. For House A, preparing meal activity suffers from timing errors more when TWNN is used. Having a snack activity is completely deleted when TWNN is used while with HMM it is still possible to capture about 50% of time-slices with timing errors. For studying, the same performance change occurs in the other direction. TWNN captures more time-slices than HMM. For both brushing teeth and dressing activities, the error percentages increase in the TWNN case but the distribution of the errors demonstrate different characters. For the dressing case, the deletion errors are decreased but timing and fragmentation errors are much more increased compared to the case with HMM. For House B, having a snack, taking shower, toileting, brushing teeth and dressing activities are completely deleted when TWNN is used. It is very notable that taking shower and toileting activities have very high true positive rates with HMM whereas they are totaly missed by the TWNN. Being outside, sleeping, watching
8
Hande Alemdar et al.
(a) House A
(a) House A
(b) House B
(b) House B
Fig. 5: Time-slice Based Performance Metrics of HMM Fig. 6: Time-slice Based Performance Metrics of TWNN on ARAS Dataset on ARAS Dataset
tv and studying activities yield nearly equal time-slice based performances for both methods. In order to evaluate the activity recognition performance from behavioural perspective, we also use the event level evaluations together with time-slice level metrics. The Event Analysis Diagrams (EAD) of all activities in ARAS datasets are provided in Fig. 7 and Fig. 8 for HMM and TWNN respectively. In terms of correctly classified activity occurrences, HMM outperforms TWNN. The diagrams also suggest that the main error types for TWNN are fragmentation and insertion. For the frequency sensitive activities, TWNN would be worse choice in ARAS datasets. One important observation is revealed when we compare the time-slice level performance with the event level performance of the sleeping activity. At the time-slice level, both HMM and TWNN performance metrics are extremely high for sleeping activity in both houses. However, the event level analysis suggests that the recognition for sleeping is more robust with HMM since it does not make frag-
mentation errors for a frequency and duration sensitive activity. It can be concluded from the event based analysis that HMM outperforms TWNN on ARAS datasets in terms of behaviour recognition for well-being assessment purposes. When time-slice level analysis is also taken into account, it can be stated that TWNN fails to recognize the short duration activities efficiently and tends to fragment longer duration activities. HMM vs. TWNN on Kasteren Datasets. Kasteren data sets are among the first examples of benchmarking data sets, which have been used in many studies with a variety of machine learning methods, but to the best of our knowledge, this is the first study that evaluates the datasets from a behaviour recognition perspective. Time-slice based performance of all activities in Kasteren datasets are provided in Fig. 9 and Fig. 10 for HMM and TWNN respectively. At time-slice level, the HMM performance is higher for shorter activities and the results are nearly the same for longer activi-
Daily Life Behaviour Monitoring for Health Assessment using Machine Learning
9
(a) House A
(a) House A
(b) House B
(b) House B
Fig. 7: Event Based Performance Metrics of HMM on ARAS Dataset
Fig. 8: Event Based Performance Metrics of TWNN on ARAS Dataset
ties like being outside and sleeping. The general trend in performance across different houses in the dataset is downwards, House C being the most challenging one. In House C, falsely inserted time-slices for sleeping activity has the highest ratio among all five datasets indicating a sensor failure or annotation accuracy problem.
of false activities are more problematic for frequency sensitive activities than they are for duration sensitive activities. Hence, one method can be more preferable depending on both the application specific needs and the type of activities.
The Event Analysis Diagrams (EAD) of all activities in Kasteren datasets are provided in Fig. 11 and Fig. 12 for HMM and TWNN respectively. For House A, all of the activities can be recognized with HMM although with different accuracies. TWNN fails to capture any correct occurrence of having a drink or snack and brushing teeth activities in House A. For House B, washing dishes activity cannot be captured by either method but the difference is that TWNN deletes the all instances whereas HMM also inserts wrong instances for washing dishes activity. The same holds for having a drink activity in House C. In this case, both methods yield 0% accuracy but from a behaviour monitoring perspective, deletion of actual activities and insertion
4.3 Comparison with Conventional Evaluation Metrics In this section, in order to stress on the shortcomings of the conventional metrics, we compare the performance of the HMM and TWNN classifiers on the ARAS datasets in Fig. 13. As an example, consider ARAS House A. TWNN yields higher accuracy than HMM, however, our behaviour oriented evaluation showed the opposite. TWNN fails to capture most occurrences of frequency sensitive activities. For the particular activity of sleeping which is both frequency and duration sensitive, HMM outperforms TWNN. Moreover, TWNN cannot successfully recognize short duration activities and tends to make fragmentation errors on longer dura-
10
Hande Alemdar et al.
(a) House A
(a) House A
(b) House B
(b) House B
(c) House C
(c) House C
Fig. 9: Time-slice Based Performance Metrics of HMM Fig. 10: Time-slice Based Performance Metrics of TWNN on Kasteren Dataset on Kasteren Dataset
tion activities. Despite these deficiencies, if we were to consider the accuracy metric only, we would argue that it performed better than HMM. Similarly, for ARAS House B, the performance of the two methods are nearly equal in terms of accuracy. However, behaviour oriented
evaluation indicates that TWNN suffers from similar shortcomings.
Daily Life Behaviour Monitoring for Health Assessment using Machine Learning
11
(a) House A
(a) House A
(b) House B
(b) House B
(c) House C
(c) House C
Fig. 11: Event Based Performance Metrics of HMM on Kasteren Dataset
Fig. 12: Event Based Performance Metrics of TWNN on Kasteren Dataset
5 Conclusions In this study, we address the challenges in the evaluation of different approaches for the purposes of human behaviour understanding through a well-being assessment perspective. The metrics used in the perfor-
mance evaluation of newly developed algorithms are directly taken from the machine learning domain. The shortcomings of the use of general purpose metrics are demonstrated with experiments on real world data. Human behaviour analysis from a medical perspective requires analysis of daily activities in terms of timing, du-
12
Hande Alemdar et al. ARAS A HMM ARAS A TWNN ARAS B HMM ARAS B TWNN
100 90 80
3.
Value (%)
70
4.
60 50 40
5.
30 20 10 0
6. Accuracy
Precision
Recall
F−measure
Fig. 13: Performance evaluation using standard metrics
ration and frequency. Given the high variations in these attributes for different activities, the general purpose metrics fail to accurately reflect the actual performance. We proposed an evaluation method generally applicable to real world applications that require human behaviour understanding. In the proposed method, we first group the activities of daily living in terms of their duration and frequency sensitivities. Then, we map the categories to appropriate evaluation strategy using either time-slice level or event level criteria. In this way, we provide sounder evaluation criteria rather than a onesize-fits-all approach, i.e. using the same single metric for all types of activities. Using the newly proposed method, we compared the performance of two machine learning models, HMM and TWNN, on five different real world datasets from a behaviour monitoring perspective. The results with real world human behaviour data revealed that the use of standard metrics can be misleading in demonstrating the performance from a behaviour understanding perspective. Conventional metrics such as accuracy and F-measure are widely used for evaluation purposes because of their compactness. Yet, this compactness causes a loss in the human behaviour perspective when applied to assessment of well-being in AAL systems. There exists a trade-off between compactness and informativeness. Since the human behaviour understanding for healthcare monitoring purposes requires delicacy, we propose trading some of the compactness with informativeness to obtain deeper insights.
References 1. Alemdar, H., Ersoy, C.: Wireless Sensor Networks for Healthcare: A survey. Computer Networks 54(15), 2688 – 2710 (2010) 2. Alemdar, H., Ertan, H., Incel, O.D., Ersoy, C.: ARAS Human Activity Datasets in Multiple Homes with Multiple Residents. In: 7th International Conference on Per-
7.
8.
9.
10.
11.
12.
13.
14.
15.
16.
17.
18.
vasive Computing Technologies for Healthcare. Venice, Italy (2013) Alvarez, G., Ayas, N.: The Impact of Daily Sleep Duration on Health: A Review of the Literature. Progress in Cardiovascular Nursing 19(2), 56 (2004) Bamis, A., Lymberopoulos, D., Teixeira, T., Savvides, A.: The behaviorscope framework for enabling ambient assisted living. Personal Ubiquitous Computing 14(6), 473–487 (2010) Cook, D.J.: Learning setting-generalized activity models for smart spaces. IEEE Intelligent Systems 27(1), 32–38 (2012) Gaddam, A., Mukhopadhyay, S., Gupta, G.: Elder Care Based on Cognitive Sensor Network. IEEE Sensors Journal 11(3), 574 –581 (2011) Gallissot, M., Caelen, J., Bonnefond, N., Meillon, B., Pons, S.: Using the multicom domus dataset. Research Report RR-LIG-020, LIG, Grenoble, France (2011) Gangwisch, J.E., Heymsfield, S.B., Boden-Albala, B., Buijs, R.M., Kreier, F., Pickering, T.G., Rundle, A.G., Zammit, G.K., Malaspina, D.: Short Sleep Duration as a Risk Factor for Hypertension: Analyses of the First National Health and Nutrition Examination Survey. Hypertension 47(5), 833–839 (2006) Ghasemzadeh, H., Jafari, R.: Physical Movement Monitoring Using Body Sensor Networks: A Phonological Approach to Construct Spatial Decision Trees. IEEE Transactions on Industrial Informatics 7(1), 66 –77 (2011) Gordon, D., Czerny, J., Beigl, M.: Activity Recognition for Creatures of Habit. Personal Ubiquitous Computing 18(1), 205–221 (2014) Helal, S., Mann, W., El-Zabadani, H., King, J., Kaddoura, Y., Jansen, E.: The Gator Tech Smart House: A Programmable Pervasive Space. Computer 38(3), 50–60 (2005) Hong, X., Nugent, C.D.: Segmenting Sensor Data for Activity Monitoring in Smart Environments. Personal Ubiquitous Computing 17(3), 545–559 (2013) Hu, J., Brown, M.K., Turin, W.: Hmm based on-line handwriting recognition. IEEE Transactions on Pattern Analysis and Machine Intelligence 18(10), 1039 – 1045 (1996) Intille, S.S., Larson, K., Beaudin, J.S., Nawyn, J., Tapia, E.M., Kaushik, P.: A living laboratory for the design and evaluation of ubiquitous computing technologies. In: In Extended Abstracts of the 2005 Conference on Human Factors in Computing Systems, pp. 1941–1944. ACM Press (2005) van Kasteren, T., Englebienne, G., Kr¨ ose, B.: Human Activity Recognition from Wireless Sensor Network Data: Benchmark and Software. In: Activity Recognition in Pervasive Intelligent Environments, pp. 165–186. Springer (2011) van Kasteren, T., Noulas, A., Englebienne, G., Kr¨ ose, B.: Accurate activity recognition in a home setting. In: Proceedings of the 10th international conference on Ubiquitous computing, UbiComp ’08, pp. 1–9. ACM, New York, NY, USA (2008) Kientz, J.A., Patel, S.N., Jones, B., Price, E., Mynatt, E.D., Abowd, G.D.: The Georgia Tech Aware Home. In: HI ’08 Extended Abstracts on Human Factors in Computing Systems (2008) Kuo, C.H., Chen, C.T., Chen, T.S., Kuo, Y.C.: A Wireless Sensor Network Approach for Rehabilitation Data Collections. In: Proceedings of 2011 IEEE International Conference on Systems, Man, and Cybernetics (SMC),, pp. 579 –584 (2011)
Daily Life Behaviour Monitoring for Health Assessment using Machine Learning 19. Lasserre, J., Bishop, C.M.: Generative or Discriminative? Getting the Best of Both Worlds. Bayesian Statistics 8, 3–24 (2007) 20. Rabiner, L.R.: A Tutorial on Hidden Markov Models and Selected Applications in Speech Recognition. Proceedings of the IEEE 77(2), 257–286 (1989) 21. Salah, A.A., Gevers, T., Sebe, N., Vinciarelli, A.: Challenges of Human Behavior Understanding. In: Proceedings of the First International Conference on Human Behavior Understanding, HBU’10, pp. 1–12. SpringerVerlag, Berlin, Heidelberg (2010) 22. Suryadevara, N., Mukhopadhyay, S.: Wireless Sensor Network Based Home Monitoring System for Wellness Determination of Elderly. IEEE Sensors Journal 12(6), 1965 –1972 (2012) 23. Tapia, E.M., Intille, S.S., Larson, K.: Activity recognition in the home using simple and ubiquitous sensors. In: Proceedings of International Conference on Pervasive Computing, pp. 158–175 (2004) 24. Waibel, A., Hanazawa, T., Hinton, G., Shikano, K., Lang, K.J.: Phoneme recognition using time-delay neural networks. Acoustics, Speech and Signal Processing, IEEE Transactions on 37(3), 328–339 (1989) 25. Ward, J., Lukowicz, P., Gellersen, H.: Performance metrics for activity recognition. ACM Transactions on Information Systems and Technology (TIST) 2(1) (2011)
13