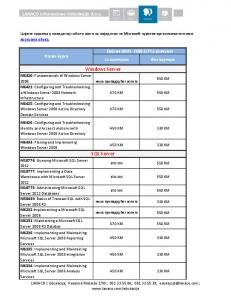
Microsoft Dashboard Tools. •Excel. •Reporting. Services. •Performance. Point. •
Power View. Simple. Accessible. Visual options. Interactivity. Moderate to.
Dashboard Design Making Reports Pop
Paul Turley Mentor, SQL Server MVP
[email protected] SqlServerBiBlog.com
Microsoft Dashboard Tools Simple
• Excel • Reporting Services
• Performance Point
• Power View
Advanced
Simple Accessible
Visual options Interactivity
Moderate to advanced skills
Very flexible Advanced visuals Programmable
Specialized design UI
Interactive Ad-hoc visuals Cross-product
Coming soon Enterprise only Not programmable
Highly-interactive Rich visuals Rich exploration
Excel Dashboards • Desktop for simplicity • •
Row limits Data sprawl
• Analysis Services for data scalability • PowerPivot for scalable business data modeling • SharePoint/Excel Services for collaboration • New visuals • Filter, sort • Charts, pivot table, conditional formatting • Sparklines, indicators, slicers
Excel Reports
add-in visuals from BonaVista Systems
Demonstration • SharePoint dashboard & reporting tools • Excel visualization • PowerPivot • PerformancePoint
Reporting Services • Professional IT reports •
Programmable, advanced flexibility
• Evolution of SSRS self-services reporting • Report Builder [3.0] • Report parts • Shared datasets
Dashboard Reports
SSRS Advanced Design Skills Dynamic Visibility
Composite Report Items
Report Actions
Expressions
Parameters
Filters
Grouping
SSRS Charting • Multi-area
• Multi-series
• Repeated regions
Interactive & Synchronized Report Items
Scorecard & Indicators • KPI Indicators
• Business
Scorecard
Spatial & Map Reports
Demonstration • Designing SSRS dashboard components • Report parameters • Gauge panel • Business scorecard with KPI indicators • Sparkline report • Interactive chart • Thumbnail map with interactivity
Enabling Self-service Reporting • Shared data sources • Semantic models • Report parts • Report Builder [3.0] • Deployment planning
Deployment Planning • Each target folder is SharePoint library
Deploying Report Parts • Any data region or container
• All dependent
objects are deployed & attached
Demonstration • Planning deployment & setting targets • Designing report parts • Deploying & saving report parts
Enabling Self-service Reporting • Shared data sources • Semantic models • Report parts • Report Builder [3.0] • Deployment planning
Report Builder [3.0]
Demonstration • Run Report Builder [3.0] • Find report parts • Assemble report
Thank You Resources Contact Paul
[email protected]
My Blog
SqlServerBiBlog.com
Books & Blogs
SolidQ.com/journal
FlowingData.com PerceptualEdge.com