Data Cleansing Techniques for Large Enterprise. Datasets. K Hima Prasad , Tanveer A Faruquie, Sachindra Joshi, Snigdha Chaturvedi, L Venkata ...
2011 Annual SRII Global Conference
Data Cleansing Techniques for Large Enterprise Datasets K Hima Prasad , Tanveer A Faruquie, Sachindra Joshi, Snigdha Chaturvedi, L Venkata Subramaniam, Mukesh Mohania IBM Research-India New Delhi, India {
1
hkaranam,ftanveer,jsachind,snchatur,lvsubram,mkmukesh}@in.ibm.com Error Type Multiple valid representation
Abstract— Data quality improvement is an important aspect of enterprise data management. Data characteristics can change with customers, with domain and geography making data quality improvement a challenging task. Data quality improvement is often an iterative process which mainly involves writing a set of data quality rules for standardization and elimination of duplicates that are present within the data. Existing data cleansing tools require a fair amount of customization whenever moving from one customer to another and from one domain to another. In this paper, we present a data quality improvement tool which helps the data quality practitioner by showing the characteristics of the entities present in the data. The tool identifies the variants and synonyms of a given entity present in the data which is an important task for writing data quality rules for standardizing the data. We present a ripple down rule framework for maintaining data quality rules which helps in reducing the services effort for adding new rules. We also present a typical workflow of the data quality improvement process and show the usefulness of the tool at each step. We also present some experimental results and discussions on the usefulness of the tools for reducing services effort in a data quality improvement.
Data in wrong fields
Spelling errors Data variability
Non Standard Abbreviation
Regional Variation
E XAMPLES OF DATA
Example 56/A R K Puram 56 Sector A RamaKrishna Puram Anil Kumar 44 Vasant Kunj, Delhi India 997546055 123 Civil Line, Kandivali 123 Civil Line, Kaandivalli KH172 3.5Y M socket Socket type Male KH 172 3.5 in. Male KH 172 3.5 inch skt 134 Bypass, Nasik Maharashtra 134 Bypass Road, Nasik, Mah 134 Bypass Rd, Nasik, MH 345 Poorvi Mg 124 Kucha Dakkhani 123 Poorani Sadak House 44th 12th St TABLE I A DDRESSES AND P RODUCT
PROBLEMS IN
DESCRIPTIONS
I. I NTRODUCTION Data has become a central asset for most of the enterprises for taking their operational, strategic and competitive initiatives. However, most of the real world data is dirty and error rates commonly vary between 0.5%-30%, with 1%-5% being very common[1]. Low data quality results in incorrect reporting, inability to create a complete view of the customers from various segments and also results in poor customer service. Lack of data quality results in customer churn and low customer satisfaction. Studies reveal that poor data costs billions of dollars to US business [2] [3] [4] [5] and as much as 75% of the companies experienced profit erosion because of poor quality data [6]. Hence the data quality becomes an important step for organizations to achieve their strategic initiatives. Enterprise data is always evolving and new data keeps coming into the enterprise with different characteristics. Hence, data quality improvement is an on going exercise which needs to be performed to handle the variability that comes with the growing data. Data quality improvement is very tedious task with lots of manual efforts in creating new dictionaries and rules. These dictionaries and rules are created by domain experts and they change across customers and require considerable tuning from customer to customer. The amount of effort 978-0-7695-4371-0/11 $26.00 © 2011 IEEE DOI 10.1109/SRII.2011.26
involved in tuning depends on the type of data. For example for domain like postal addresses where external standards are defined, it may take a little effort to customize rules from one customer another. Whereas for a domain like product data which is captured in different forms with different customers needs almost developing new set of rules and dictionaries for each customer. Address cleansing tasks in developing countries also requires lot customization effort as there are no standards defined. This problem could further compound in places like India where there are lot of regional variations, dialects, multi-linguality and noise introduced because of spelling mistakes and non-standard abbreviations. In Table 1 we show a few examples of addresses obtained for the Indian subcontinent and highlight some of the differences which exist from customer to customer. It also shows different ways in which same product description can be defined. Currently there are many data cleansing softwares present in the market [7] [8] [9]. Most of these products are costly and customer has to invest lot of effort in customizing them to suit their data [10]. Also there are companies that offer data cleansing as a service [11], where customer upload their data to the service provider who customizes the cleansing model 135
by pointing to the node which has to be modified or to which a new exception has to be added. This helps in reducing the time required for writing rules and hence reducing the services effort.
to suit customer needs and deliver the cleaned data back. Also there are many customers who perform one time cleansing of their data before implementing a data warehousing or an MDM kind of solution. In these kind of scenarios it makes sense to employ data cleansing as a service offering than to buy product and maintain it. In both product and services offering cases it is evident that there is a fair amount of services effort that goes with the data cleansing process which is very manual. In this paper we look at the data cleansing as a service offering and try to present tools that can quickly customize the data quality rules and dictionaries to address the quality issues of the new customers as when they buy this service. Tools and the workflow presented can be easily be applied in both models to reduce the services effort required to customize the data quality process. Data cleansing in general has been extensively studied [12] [13] [14], but little work has been done on supporting quick customization of data quality rule sets and tools to guide the quick development of dictionaries. In this paper we look at the framework which reduces the services effort significantly for customizing the rule sets to improve data quality. The current approach followed by the data quality practitioners is to look at the data and generate token and pattern frequency reports which guide the addition of dictionary entries and rules [7] [8] [9]. Patterns represent the intermediate form in which input records are converted before writing rules. Details about the patterns are described in the next section. In the current scenario one has to go through each token and decide if it has to be added to the domain dictionary or not. Another problem in handling the tokens is that the domain expert may not always know the meaning of the tokens that are being investigated. Example of such cases is if you are looking at Indian address context each state has different language and hence the same entity like street is written in forms like sadak, gali, marg, kucha, rasta etc depending on the state and people also write different abbreviations and spelling variations of the same token like street can be written as st, str, street, stret etc. All these tokens unless presented with some context it will be difficult for the rule writer to handle them efficiently. Another important step in data quality improvement is to write new data quality rules to handle the failed instances in the data. This is assisted by pattern frequency reports where patterns guide the rule writer to add new rules. Data quality rules are generally written in the form of (if condition then action) where each rule looks for some condition and takes some action. These rules are generally organized in a sequential order and the rule writer has to decide on where to add a new rule to handle the failed instance. This process of manually adding new rules is tedious and error prone. In this paper we present a methodology to organize rules using a framework called ripple down rules (RDR), which helps rule writer in organizing the rules in a better way [15]. In this framework rules are organized in a tree structure where most generic rules are placed on the top and the exceptions to them form the branches. This helps in tracking which rules are firing on a given instance and also helps the rule writer
We also present tools to interpret the unhandled tokens by mining the context of these tokens and relating them to other known tokens with similar context and known meaning. The assumption being that the tokens appearing in the same context are often handled in the same semantic manner. Thus we assist the data quality practitioner for better decision making during the customization of a solution. We describe two algorithms to handle unknown terms. The first algorithm is for finding variants which are different surface forms for the same term. Examples of such terms include Kandivili, Kandivalli(East), KVL, Khand vili and KVL(E) which are different ways for writing a particular area Kandivili. This algorithm uses a global context to group similar records containing possible variants and then finds the differences between these records in relation to a particular token to mine different variants. The other algorithm is for finding synonyms which are tokens which have different surface form but whose semantic usage is the same. Examples of such terms include Temple, Church, Apartment, Mandir, Mosque etc which are used as building types. This algorithm uses local context constructed using a limited neighborhood around each token. Synonym in the rest of the paper describe all the words which are used for describing similar type of attributes but not used in its strict sense. We integrated our tool with the standard data cleansing workflow and show how synonym finder, variant finder, and RDR framework fit at the various stages of the workflow. With the addition of proposed workflow instead of using a reactive approach we use a proactive approach to find the possible unhandled terms and the associated context that can be utilized to handle them upfront. We present the results of our findings on applying this tool on these data sets. With the help new reports generated we help the data quality practitioner to add dictionaries quickly without spending much time on understanding the token and deciding on what it means. RDR framework presented helps in easy addition of rules. The rest of the paper is organized as follows. In Section II, we present the data quality improvement methodology along with the need for the synonym and variant finder methods presented in this paper and how they can be used in the standard data quality improvement workflow. In the section IIIA we present the ripple Down rule management framework which is used for easy maintenance of rules. In section III-B III-C, we present in detail the algorithm used for discovering variants for a given token and the algorithm for finding synonyms for a given a token. In section IV we evaluate our tool on some real life datasets and quantify the gains obtained. In section V we discuss some of the experiences in using this tool and in section VI we present our conclusions.
136
II. DATA Q UALITY I MPROVEMENT M ETHODOLOGY
From the above it is clear that rule set consists of classifications, dictionaries and rules. Each of these are explained in the following subsections. 1) Classifications: These are used to abstract individual tokens into some broad meaningful categories. For example in address standardization street identifiers like road, street, avenue, galli, etc. are assigned the same classification label. Building a rule set begins with defining what are the different classes one can expect in the data. For each such class a label is assigned. Each class has an associated list of tokens belonging to that class. For Indian addresses a few classes, their label and the corresponding tokens are shown below.
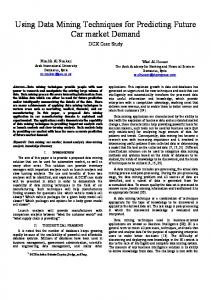
In this section, we explain various steps involved in data quality improvement and the methodology followed. A. Data Cleansing Stages Data quality improvement is achieved through data cleansing which has four stages namely, investigate, standardize, deduplication, and survivorship. Each of these stages is explained in the following subsections. 1) Investigation Stage: This is the auditing phase in which client data is analyzed to identify different errors and patterns in the data. This stage requires all or a sample of data to discover the data quality. Investigation results include frequency reports on various tokens, labels and record patterns. These reports provide the basis for tuning standardization rule sets for a given customer data. 2) Standardization Stage: In this stage data is transformed to a standard uniform format agreed by the customer. This involves segmenting the data, canonicalization, correcting spelling errors, enrichment and other cleansing tasks using rule sets. This stage usually requires iterative tuning of rule sets. The tuning can be done on the whole data or a sample data-set. 3) De-duplication/Matching Stage: This is an optional phase where standardized data from previous stages is used to identify similar or duplicate records within or across datasets. This stage is configured by providing parameters for the blocking and the matching steps. Blocking is used to reduce the search scope and matching is used to find the similarity between the records by using edit distance or other known matching methods. It generally takes few iterations to decide on these thresholds in practice. 4) Survivorship stage: In this stage the customer decides what data has to be retained after the match stage. If data is being merged from different sources then how the overall merging should take place is defined using rules. This is done by incorporating the inputs from the customer who decides the credibility of data sources using his business knowledge.
Class Street Type Area Type Building Type
Label T A B
Tokens street, road, galli, rd, raod, kucha Nagar, Kunj, Wadi, Mohalla, Ganj, Tal Niwas, Chawl, Arcade, Haveli
Tokens that do not fall into any of the defined classes are marked with generic classification labels. For example, non-numeric tokens are marked as + and numeric tokens are represented with N . The classification labels are useful in formulating patterns for known classes. The classifications can also be used to canonicalize matched tokens. For example different variants in which people write street (st, strt, str) can be replaced by its canonicalized form. This kind of canonicalization helps in generating correct reports on the data and also helps in the matching stage.
Synonym/V ariant finder
Investigate
B. Rule Sets
Identify Data Quality
Rule sets form the heart of any cleansing software. These define how the input data needs to be processed. The accuracy of standardization depends on how good the underlying rule sets are. With better standardization one can achieve better matching results and better duplicate detection. Following are the basic steps involved in a standardization process. • Input records are pre-processed and divided into tokens. • Each token in the record is processed to associate it with a classification label which defined in next subsection. • Replace each token of the input record with its classification label to obtain the input pattern • Input pattern is passed to the engine which applies the rule set. Each rule has a pattern and an associated action to be taken when the pattern is matched. Each rule can process the input pattern fully or partially. There is an ordering on rules where the remaining unprocessed pattern by a rule is handled by the rules following it.
Standardize
RDR Framework
Matching
Survivorship
Customize Rule Set Setting up a Match job
Identify data Specific dictionary Entries
Fig. 1.
Tuning the match Parameter
Write Record Merging Rules
Add New Rules
Data cleansing Workflow
2) Patterns and Rules : Patterns give a generalized view of how the customer data looks. A pattern is obtained by parsing the data and classifying all the tokens into appropriate classes and replacing them with their corresponding labels. For example for the Indian address, 22/7, vasant Arcade, Nelson Mandela Marg, Sector C-2, Vasnt Kunj New Delhi 110070. The corresponding pattern is written as N/N + B + +T + I − N + A + +N . Here, N represent numeric type, B represent building type, T represent street types. I represents a single
137
alphabet, A represents area type, and + represent any unigram which cannot be assigned a classification label. Rules are written to process patterns from either left to right or from right to left. For example, rules for pincode and city scan the pattern from right to left whereas rules for door number and building scan the pattern from left to right. A set of rules to identify a city and pincode are shown below. Here # is used to represent processing of a records from right to left. The matched tokens are numbered from left to right.
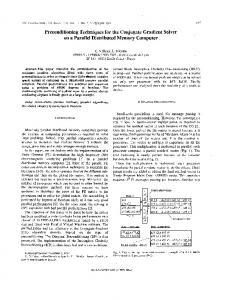
Start with empty KB Execute on a case •Provide new conclusion •Give new Attr-Val pair in case which form the new exception rule & justify conclusion
Is conclusion correct
Yes
\* Two word city name followed by pincode *\ if pattern is #++N then copy(token[3],pincode) and copy(token[1]+ " "+token[2], city) \* One word city name followed by pincode *\ if pattern is #+N then copy(token[2],pincode) and copy(token[1],city) \* Two word city named with no pincode *\ if pattern is #++ then copy(token[1]+" "+token[2], city)
Fig. 2.
No
Knowledge acquisition process in RDR.
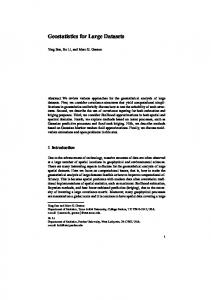
The RDR framework uses a failure driven approach. The rules are only added when the system incorrectly classifies a case or fails to classify a case. The creation of extra rules in the system is to cater for the wrongly classified cases. The knowledge found to be incorrect by a human expert’s knowledge is patched locally within the current context at the point where knowledge was in error. Ripple down rules methodology allows incremental changes to the knowledge base without causing unwanted side effects to the existing knowledge base. When a rule is added to the expert system, the case that prompted the rule is also stored with the rule. The rules written using RDR approach form a tree structure. An example of this structure is shown in Figure 3. We begin when nothing is known, i.e. the knowledge base (KB) is empty. So a default rule (rule 0) is fired which is always true. If a case is satisfied by a node which does not have child nodes, i.e. no branches, the conclusion associated with the rule in the node is asserted. In general if the rule in a node is true then the rule in the node connected by TRUE branch is also tested.If the case satisfies the child rule, its conclusion takes precedence on the conclusion of the parent rule. The conclusion of the parent is returned only if the rule on the TRUE branch does not satisfy the case. If a rule is not satisfied for a case, the child rule with a FALSE link is tested. In Figure 3 in Rule 1, if the current token is in road dictionary we do not declare it as a road type immediately. We check if the left context of this token has a landmark type. If yes we declare the token as part of landmark rather than as a road type. Addition of new rules to the knowledge base should be such that they do not cause misclassification of previous cases that prompted the additions of rules. The RDR methodology ensures that such conflicts are effectively managed. In fact, errors can be virtually eliminated by validating the rules as they are added [16]. A valid rule is one that correctly interprets the case for which it is added and not misinterpret any other cases which the system already interprets correctly. The RDR methodology allows one to add an exception to already written rules by adding the exception conditions using the TRUE
3) Dictionaries: In many cases it is necessary to validate the standardized data against some domain to make sure that it is correctly identified. For this we use a list of tokens containing valid representations. For example, a dictionary of the available cities can be used to validate the city names that are identified by pattern actions. This validation is generally specified along with the pattern action rules. In the above case after adding the city dictionary, D = {“N ew Delhi”, “Chennai”, ”M umbai”, . . .}, the rules can be modified to do validation before segmenting a city name. C. Data Quality Improvement Workflow Figure 1 gives the typical data cleansing workflow and gives an idea of how different cleansing stages are connected. Major steps performed in each stage are given below each stage. Shaded boxes on top provide some of the important features we introduced in the workflow which speeds up the whole process of data quality improvement. Details about each of these steps are described in the next section. III. T OOLS FOR DATA Q UALITY I MPROVEMENT In this section we describe the tools for data quality improvement which have the features like ripple down rules framework, variant finder, and synonym finder. Following sub sections explain the details of each of these methods. A. Ripple Down Rules (RDR) Framework The basic philosophy behind Ripple Down Rules (RDR) [16] is based on the observation that experts do not ‘explain’ how they wrote a rule but they ‘justify’ that a rule is correct and provide the justification in a context [17]. As is shown in Figure 2, in RDR approach the domain experts process the cases, make a recommendation, and provide some features if necessary to ’justify’ their recommendation.
138
Fig. 3.
variants of each other. The problem of variant detection is defined as given a term from a reference set, discover all the other members that belong to the same reference set. We next present the approach that we adopt for solving this problem. 2) Approach for Detecting Variants: In order to discover all the terms that belong to the same reference set, we first group all the records, based on how similar they are to each other. Two records are similar to each other if they are almost identical to each other, i.e. they have the same set of terms in sequence except at a few places. This is also known as syntactic clustering in the literature [18] and has been widely studied for detection of near duplicate Web pages [19]. In the Figure 4, address (a) and (b) form one group of similar addresses. This is true as both the addresses are very similar and differ only at one place where one address has the term “Road” and the other address contains the term“Rd”. On the same lines the address (c), (d) and (e) form another group of similar addresses. Once the groups of similar records are identified, we detect variants of a term referred to as a query term, by comparing each pair of records in the group and determine how they differ from each other. For this we consider a group of similar records only if it contains at least one record with the query term. As an example, if we want to discover variants of the term “Kandivali”, we consider the group of similar addresses that consists of the address (c), (d), and (e) as given in the Figure 4. Note that the address (c) in the group contains the query term. We do not consider the group consisting of address (a) and (b) as none of the members of this group contains the query term. We then compare each pair of addresses in this group and determine how they differ from each other. The comparison of addresses may give rise to a pair of terms where the first term in the first address needs to be replaced with the second term in order to obtain the second address from the first address. If one of the term in the discovered pair of terms is the query term then the other term in the pair belongs to the same reference set. As an example, comparing the address (c) and (d) we discover that they differ at one place where the first address contains the term “Kandivali” and the second address contains the term “KVL”. Therefore the term “KVL” belongs to the same reference set as the term “Kandivali”. Similarly comparing the address (c) and (e), we find that the term “Kandivalli” also belongs to the same reference set. We implement this method in two phases. In the first phase, we discover all the groups of similar records and index them. This is shown in the Figure 5. The component “Similar Record Detector” in the figure discovers all the groups of similar records. We present the details of this component in the Section III-B.3. These groups are then indexed. The index enables the following two kinds of operations. First it lets us identify all the records that contain a given term. Second, it enables us to determine all the records that belong to a given group id. In our solution, we use the Lucene index 1 for this purpose.
Rule organization in RDR framework.
branch and the context of this exception by adding the case for which this exception is relevant. B. Discovering Variants of a Term In this section, we first describe the problem of detecting variants of a given term and then provide a method based on finding similar records to detect variants of a given term. 1) Problem of Variant Detection: As pointed out earlier, there is a lack of any standard in many domains. Even when a standard exists for a domain, it may not always be adhered to while storing data. A good example of such a domain is addresses of customers. In several geographical areas either there is a lack of any standard for writing addresses or the standard is not strictly adhered to. This results in substantial variability in writing the same address where the same entity is referred to in multiple ways. Figure 4 shows addresses that have been written in multiple ways.
Fig. 4.
Different ways of referring to the same address
Typically there is a set of terms that are used for referring an entity. This set of terms is called the reference set for the entity. Based on the addresses given in the Figure 4, {“Road”, “Rd”} is the reference set for the entity Road. Similarly, {“Kadivali”, “KVL”, “Kadivalli”} is the reference set for the entity Kandivali. All the terms in a reference set are called
1 http://lucene.apache.org/
139
Procedure LeaderClustering (RecordSet R) (1) Start with the first record as an initial leader (2) For each record in the data set do (a) Find the nearest leader Lj for the current record ri from the set of all the currently available leaders (b) If Sim(Lj , ri ) < τ assign ri to the cluster represented by Lj else add ri as a new leader Fig. 7.
Fig. 5.
Index Time Processing for Finding Variants.
Fig. 6.
Query Time Processing for Finding Variants.
Leader Clustering Algorithm
contains all the substrings of length k that appear in the record r1 . Similarly the set S2 contains all the substrings of length k for the record r2 . The value of resemblance vary from 0 to 1 where a higher value denotes that the pair of records is more similar. While the method proposed in [18] focuses on determining a subset of these substrings that should be used to make the further computation efficient, we do not use those methods as the total number of substrings generated for each record is not large. Therefore, we do not need to use complex and sophisticated methods as proposed in [18]. For each record we generate all the k length substrings for it and then apply leader clustering algorithm [21] to generate groups of similar records. The leader clustering algorithm as shown in the Figure 7 makes a single pass through the data set and finds a set of leaders as the cluster representatives. It uses a user specified threshold τ which is used to create new leaders. One of the advantages of grouping similar records together is that it can be used as a new investigation stage, which can help data quality practitioner to get a view of the same record is written differently. This helps in adding exceptions to the existing data quality rules. Another advantage with grouping similar records is that it gives a rough estimate of the number of duplicates present in the current data. As explained earlier, matching job generally requires a lot of tuning depending on the type of customer data and knowing an estimate of number of duplicates present helps in achieving that. 4) Detecting Record Differences: Once the group of similar records are identified and indexed, for a given query term q, we obtains the set groupsq as described in Section III-B.2. We then take each pair of records from every group in the set groupsq and find the difference between them using a diff 2 like utility. In computing, diff is a file comparison utility that outputs the difference between two files. It outputs the changes made per line of text files. We create a text file using a record where each token in the record is written in a new line. We then use the diff utility to obtain the differences between the two records. The output of the diff utility is used to create a pair of terms, called diff-terms. The first term in the diff-term that appears in the first record can be replaced by the second term to obtain the the second record. We therefore say that these terms are used interchangeably. If any of the term in the pair is the query term q then the other term is recorded as a
In the second phase as shown in Figure 6, we detect all the records that contain the query term q. Let this set of records be referred to as the set resultq . Next, for each record r in resultq , we identify its group id and then gather all the other records that have the same group id using the index. This gives us a set of groups of similar records where each group contains at least one record with the query term q. This set of groups is referred to as groupsq . Using each group in groupsq , we identify the terms that belong the reference set of the query term by using a diff like method referred to as “Record Diff Detector”. We present the details of this method in Section IIIB.4 3) Finding Groups of Similar Records: In order to detect groups of similar records, we adopt a technique for detecting near duplicate documents. Detection of near duplicate documents has been an active area of research in the Web mining area. On the Web there exist several near duplicate documents as different versions of the same document exist on different Web sites with some slight modifications or formatting changes. Several techniques have been proposed to detect them [18], [20], [19]. For detecting groups of similar records, we use a measure called resemblance measure as used by the method proposed in [18]. This measure is defined as follows: S1 ∩ S2 (1) S1 ∪ S2 Here r1 and r2 denote a pair of records. S1 is a set that Sim(r1 , r2 ) =
2 http://linux.die.net/man/1/diff
140
variant. Once we get variants by computing the diffs in every pair of records, we rank these variants by the number of times they appear in diff-terms. All the variants above a certain threshold are then taken as the variants for the query term.
nx,j tfx = P j nx,j idfx = log
|1 + yj = tfx .idfx
C. Discovering Synonyms In this section we describe our algorithm to find the synonyms of given word. As described earlier synonyms are words that may have different surface forms but have similar usage. Since the semantic usage of a word is decided by the local context we first have to extract the local context of a token under consideration. In the following section we describe how this local context is constructed for a token. 1) Local context construction: For finding words with similar usage we first have to establish its context. Given a token x, the local context, `x , of x is established by the tokens that appear within a neighborhood of all appearances of x in the corpus. The neighborhood is defined by a window of size {−W, W } around the token x. If the complete corpus consists of N records then consider every record r in the corpus containing x appearing at position i. Then the context obtained from r consists of previous W words and the subsequent W words around x and consists of 1) The current word, x for which the local context is computed. 2) The left association CLx which consists of previous W words {xi−W , . . . , xi−1 }. The number of words considered is limited by the window boundary or the beginning of record boundary. x 3) The right association CR which consists of next W words {xi+1 , . . . , xi+W }. The number of words considered is limited by the window boundary or the end of record boundary. For example if r = ”1456, New Azad Hind Marg, Sector 4, Rohini, New Delhi 110065” then for a word x = ”Marg” with a window size of {−3, +3} the left association and right association is respectively given by CLx = {New, Azad, x Hind} and CR = {Sector, $NUM, Rohini}. We construct x the local context of x using CLx and CR from records in x which x appears. A context document d is constructed by x concatenating CLx and CR obtained from all records in the corpus. This context document consists of p words appearing in the vicinity of x and is represented as
{dx
|D| : xj ∈ dx }|
Here, nx,j is the numberP of times j th word in `x occurs in local context of x and j nx,j is the total number of words that occur in the local context of x. • |D| is the total number of context vectors that are formed and is equal to |V | if the number of context vector is constructed only for words in V . x x • |{d : xj ∈ d }| is the number of context document containing xj . It should be noted that local context `x can be purely left context or right context or both depending on whether only CLx x is used or only CR is used or both is used for constructing the context vector. Once the local context is constructed for both known and unknown terms we can use these context to retrieve terms with similar usage. 2) Local Context Matching: Given a term x which is a handled term i.e. it belongs to dictionary and classification table so it is know what semantic tag to associate with this term. We find terms with similar usage as this term by matching the context of this term with the context of every other term. This local context is pre-constructed as described in the previous section. To match the context of the term x with other terms we compute the cosine similarity between the context vector `x and the context vector of every other term `z . This is the dot product between these two vectors and is given by •
S(x, z) =
`x .`z ||`x ||||`z ||
We sort all z according to S(x, z) and consider the top k tokens. All tokens in this list whose match score with x is above a certain threshold, τs is declared as the synonym of x. For each x we find a list of synonyms and find which of these synonyms are already handled by checking for their presence in the classification table. All the synonyms which are not present in classification table are shown to the user so that they can impart a semantic meaning to these unhandled terms upfront by looking at the semantic meaning imparted to x. Thus we are able to discover the synonyms in a data driven fashion before even encountering any failure cases. This help reduce the iterative process and assist the data quality practitioner in customizing the resources for a particular customer.
dx = {x1 , . . . , xj , . . . , xp } Where the words, xj , are generated from a vocabulary V containing both known and unknown terms. The vocabulary is constructed after pruning words whose frequency of occurrence in the corpus is less than a particular threshold. Each xj denotes the local context features around x, 1 ≤ j ≤ |V |. The local context `x is given by
IV. E VALUATION This section presents the evaluation of the synonym and variant finder methods presented in Section III. Experiments are focused on evaluating the quality of synonyms and variants
`x = {y1 , . . . , yj , . . . , yp } Each yj is calculated as a tf-idf vector as follows
141
Precision and Recall for some of the entities are presented in the following table. One can observe that the variant tool does return a few false positives which is evident from the precision values. However, most of the time it catches almost all the variants present in the data and the recall values support this assertion.
extracted by the tool. The extracted synonyms and variants are used to populate the classification entries and dictionary entries which is an important task in rule set customization. In the absence of this tool, data quality practitioners use a token frequency report which contains all the tokens along with their frequencies. He then manually goes through this report to extract tokens that should be added to the classification tables and dictionaries. This is a tedious task. Using the synonym and variant tool the data quality practitioner is presented all relevant synonym and variant terms for a given set of terms which gives more coverage allows easy updating of the dictionary entries. We used two different data sets for performing the experiments.
TABLE II P RECISION AND R ECALL FOR VARIANTS ON A DDRESS DATA Word BORIVALI ROAD QUARTERS SOCIETY NAGAR NEAR APARTMENT BUILDING
A. Datasets We present our evaluations on two data sets which are described below. • Address Data: This data set consists of 100k Indian addresses from Mumbai in India. On this dataset the cleansing task involved segmenting these addresses into various address elements like: door number, housename, housetype, street name, street type, landmark, area, city and pincode. It also involved standardizing various terms like rd, street, etc. into a standard form so that better reporting and matching can achieved. This data had lot of spelling variations for various area names and various classifications word that are specific to that region. • Deo data: This data set consists of 65k product descriptions of deodorants which had to be segmented and standardized into various fields like Brand name, product name, color, volume, volume type, etc. This data had a lot of inconsistent abbreviations in all the fields
Precision 0.67 0.74 0.63 0.71 0.64 0.6 0.7 0.69
Recall 0.90 1.0 0.71 0.83 0.91 0.85 0.875 0.81
Table III gives the precision and recall for various terms from the Deodorant data. It is observed that the variant tool presents a high recall in this case as well. TABLE III P RECISION AND R ECALL FOR VARIANTS ON D EO DATA Word CLEAR POWDER DRY LADIES SOFT STICK DEO FRESH
Precision 0.75 0.6 1.0 0.75 0.71 0.72 0.73 0.83
Recall 0.85 0.75 1.0 0.85 0.71 0.81 0.85 0.83
C. Evaluation of the Synonym Finder
B. Evaluation of the Variant Finder
This section presents the precision and recall values for various entities evaluated based how many of their synonyms are correctly returned by the synonym finder. Table V presents the results for Address Data and Table IV presents the evaluation results for various terms in Deodorant data. The comparison is against a synonym set hand created by a domain expert.
The performance of variant finder is evaluated by finding variants for various entities using the tool. The ground truth was known for each of these entities as a domain expert compiled a similar list by manually going through the data. We measure the precision and recall for the set. Let x be the total number of correct variants returned by the tool, y be the total number of variants returned by the variant finder, and z be the number of correct variants present in the data. The Precision and Recall for a word variant cluster is given as follows. P recision = x/y
(2)
Recall = x/z
(3)
TABLE IV P RECISION AND R ECALL FOR SYNONYMS ON A DDRESS DATA Word STICK DEO BLUE SOLID OZ
Table II presents the precision and recall values for various terms taken from the address data. Terms are chosen such that they come from different parts of the address record, like area, street, building etc. For example, the word BORIVALI is an area name in Mumbai which had been written with various abbreviations and with various spelling variations. It had about 22 variants present in the data. Similarly NAGAR is an area marker used along with area names in India. The
Precision 0.57 0.5 0.66 0.58 0.66
Recall 0.66 0.55 0.66 0.7 0.66
TABLE V P RECISION AND R ECALL FOR SYNONYMS ON D EO DATA Word ROAD BUILDING NEXT NAGAR ANDHERI
142
Precision 0.53 0.66 0.55 0.62 0.55
Recall 0.66 0.75 0.55 0.55 0.55
Fig. 8.
Synonym Tool in Use
Fig. 9.
Variant Tool in Use
In the case of synonyms the precision and recall values are lower than for the variant. This is because the records are usually very small, 5-10 tokens long, resulting in context vectors not being able to cluster tokens with high accuracy. However, it has to be noted that to the data quality practitioner still uses her judgment in using the results of the tool. The suggestions made by the tool are still useful for her and she is able to understand the data much faster as a result.
KANDIVALI in Mumbai and one can see that it brings out various spelling variations in which the same area has been written the given dataset. For each variant the user is also presented with the number of occurrences of that term in the dataset. These frequency information can help practitioner to decide on which terms are to be added to the dictionaries and which can be discarded.
V. U SER E XPERIENCE AND D ISCUSSION
The data quality challenge extends to almost all domains, ranging from product data, address data, personal data, name data, parts data, etc. There are also domains within these domains. So for example product data can include personal goods, clothes, consumables. etc. Each data set has its peculiarities and one cleansing job cannot work across domains. With each new dataset the data quality practitioner has to restart by looking at the data and setting up a new cleansing job for the particular data at hand. Our tool has been tried on datasets as large as 20 million records for domains ranging from address and name data to different kinds of product data. In the case of product data the cleansing rules had to be built from scratch. For this data investigation was the key to understand the kinds of entities and variants present in the data. Table VI lists the colour clusters for Black found using the tool on a product dataset. This dataset comprised of 9 K product descriptions of the type: Nike T-Shirt ST440 hampton plaid K, Timara cls sht set K45 solid blue J, ladies headband Jimani Y789-0 red print small. In this case the tool allowed the practitioner to understand
A. Handling data from different domains
In this section we present the user experiences in using this tool. Enterprise data sizes can run into tens of millions of records. Enterprises provide their data to the data quality practitioner and it is his job to cleanse this data quickly. The cleansing Itself is often provided as a service [22]. The data practitioner is provided access to the enterprise data so that he can build cleansing jobs. Also he is given a target on what level of data quality is expected. He has to build classification tables, dictionaries and rules by looking at the data. This tool was provided to different practitioners working in the field to assist them in this task. All practitioners who were provided this tool reported a speed up in creating cleansing jobs as a result of using this tool. This was true for all the domains on which this tool was used. Figures 8 shows the tool which shows the synonyms for a given token temple on a given address set. One can see that it brings out various building types as an output which are expected from a synonym tool. It also brings out the count of each synonym in the dataset along with their relevance score. Figure 9 shows the variants for an area name called
143
TABLE VI
a given token and find other tokens with different surface forms but same semantic usage. We also describe another algorithm that can associate different surface forms of a token present in the data. We also present a RDR framework for organizing rules which helps in easy addition of rules. In order to effectively utilize this tool we have established a new investigation process and demonstrate its effectiveness on different real life data sets. We plan to improve this tool to find similar semantic segments rather than tokens.
VARIANTS AND S YNONYMS FOR THE ENTITY B LACK Word Black
Variants blk bl bk blck
Synonyms blue red green gn yellow burg yellow
R EFERENCES
the data quickly and build the classification tables and dictionaries. Once the classification tables and dictionaries were constructed writing rules for cleansing and standardization of this data became much easier. Cleansing typically involves many iterations. But understanding the data quickly and writing rules with better coverage reduces the total number of iterations required for a dataset considerably.
[1] T. Redman, “The impact of poor data quality on the typical enterprise,” Communications of the ACM, vol. 2, pp. 79–82, 1998. [2] W. Eckerson, “Data Quality and the Bottom Line: Achieving Business Success through a Commitment to High Quality Data,” The Data Warehousing Institute, Tech. Rep., 2002. [3] T. C. Redman, “Data: An unfolding quality disaster,” Information Management Magazine, August 2004. [4] L. English, “The high costs of low-quality data,” Information Management Magazine, January 1998. [5] W. W. Eckerson, “Achieving business success through a commitment to high quality data,” TDWI Report Series: The Data Warehousing Institute, 2002. [6] “Global data management survey,” Price Waterhouse Coopers, 2001. [7] “IBM Quality Stage,” 2009, http://www-01.ibm.com/software/data/ infosphere/qualitystage/. [8] “Oracle Product Data Quality,” 2010, http://www.oracle.com/us/products/ middleware/data-integration/data-quality/index.html. [9] “Initiate Quality Solutions,” 2009, http://www.initiate.com/PRODUCTS/ INITIATEDATAQUALITYSUITE/Pages/default.aspx. [10] G. Kothari, T. A. Faruquie, L. V. Subramaniam, K. H. Prasad, and M. K. Mohania, “Transfer of supervision for improved address standardization,” in ICPR, 2010, pp. 2178–2181. [11] “Address Doctor,” 2010, http://www.addressdoctor.com/. [12] G. Cong, W. Fan, F. Geerts, X. Jia, and S. Ma, “Improving data quality: consistency and accuracy,” in VLDB ’07: Proceedings of the 33rd international conference on Very large data bases. VLDB Endowment, 2007, pp. 315–326. [13] S. Y. Sung, Z. Li, and P. Sun, “A fast filtering scheme for large database cleaning,” in Proceedings of the Conference Information and Knowledge Management, 2002. [14] E. Rahm and H. H. Do, “Data cleaning: Problems and current approaches,” in IEEE Data Engineering Bulletin, 2000. [15] M. N. Dani, T. A. Faruquie, R. Garg, G. Kothari, M. K. Mohania, K. H. Prasad, L. V. Subramaniam, and V. N. Swamy, “A knowledge acquisition method for improving data quality in services engagements,” in IEEE SCC, 2010, pp. 346–353. [16] P. Compton and R. Jansen, “A philosophical basis for knowledge acquisition,” Knowledge Acquisition, vol. 2, no. 3, pp. 241 – 257, September 1990. [17] V. H. Ho, P. Compton, B. Benatallah, J. Vayssire, L. Menzel, and H. Vogler, “An incremental knowledge acquisition method for improving duplicate invoices detection,” International Conference on Data Engineering, 2009. [18] A. Z. Broder, S. C. Glassman, M. S. Manasse, and G. Zweig, “Syntactic clustering of the web,” Computer Networks, vol. 29, no. 8-13, pp. 1157– 1166, 1997. [19] M. Henzinger, “Finding near-duplicate web pages: A large-scale evaluation of algorithms,” in In Proceedings of SIGIR, Aug. 2006. [20] M. S. Charikar, “Similarity estimation techniques from rounding algorithms,” in In 34th Annual ACM Symposium on Theory of Computing, May 2002. [21] H. Yu and H. Luo, “A novel possibilistic fuzzy leader clustering algorithm,” in RSFDGrC ’09: Proceedings of the 12th International Conference on Rough Sets, Fuzzy Sets, Data Mining and Granular Computing, 2009, pp. 423–430. [22] T. A. Faruquie, K. H. Prasad, L. V. Subramaniam, M. K. Mohania, G. Venkatachaliah, S. Kulkarni, and P. Basu, “Data cleansing as a transient service,” in ICDE ’10: Proceedings of the IEEE international conference on data Engineering, 2010.
B. Handling data with regional variations Often rule sets are available for a particular domain, but when moving from one region to another local variations creep in. So for example address cleansing rule sets built for the US may be able to take care of variations in street types like road, rd, street, st, lane, ln, bylane, byln, avenue, ave, circle, ccl. However, if this rule set is used on addresses from another geography with other street types the classification tables and dictionaries will need to be updated. When we applied the data quality tool to data from the western region of India. We discovered several new street types gali, galli, kucha, marg, mg, sadak, sadhak, rasta, main. Discovering these and adding them to the dictionaries helped in faster rule customization. Similarly product data for a company from the US listed serving sizes in Ounces. For the same company product listings in other geographies were in Grams. Since the investigation method used by this tool is data driven, it allows the data quality practitioner to discover regional variations so that they can be incorporated into the existing classification tables and dictionaries. The method of this tool is language independent and allows investigation of data from different languages. Even when languages are mixed in a single entry this tool is able to find variants. Often in Indian product data multiple languages are used in a single description. In the street type example given above, the new street types listed for Mumbai are actually names in the local language. VI. C ONCLUSION In this paper we have describe a new method for investigating data quality of a data set. Our method is useful in assisting data quality practitioners to quickly discover the semantic relevance of unhandled tokens and their closet valid forms. This thus reduces the dependency on domain experts and decreases the time to customize rule sets for new customer data. Our method is a data driven approach which relies on mining the context of tokens without relying on external resources. We describe one algorithm to mine the context of 144