the least reporting countries is employment in the business services sector. .... not reflect the cost of the whole range of hardware, software and services in a ...
1
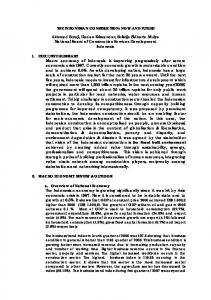
ITR-162.doc
Determinants of IT Investment at the Country Level Kenneth L. Kraemer, Jason Dedrick and Eric Shih Center for Research on Information Technology and Organizations (CRITO) and Graduate School of Management University of California, Irvine
ABSTRACT Much has been written about the determinants of capital investments by countries with the usual conclusion that wealth and capital availability are the most important factors. However, investment in a specific category of capital goods may be driven by specific factors beyond such macroeconomic factors. In this paper, we analyze the determinants of investment in information technology (IT), using data on 31 countries for the period 1985-1995 to study the impact of the structure of the economy, wealth, PC prices, education, and telecommunications infrastructure on IT investment. We found a strong relationship between the structure of the economy, measured by the share of national employment in finance and business services, and IT investment as a percent of GDP. We also found a relationship between national wealth (GDP per capita) and IT investment. These factors explain about 60% of the variance among countries’ levels of IT investment. Based on these analyses, we conclude that IT investment is driven by the structure of the economy and by the level of wealth in a country. Other factors, such as telecommunications penetration, education levels and prices did not provide additional explanatory power in estimating IT investment.
I. INTRODUCTION Much has been written about the determinants of capital investments by countries with the usual conclusion that wealth and capital availability are the most important factors (Barro, 1997). The availability of capital is determined by domestic savings and inflows of foreign savings (in the form of investment, lending, or foreign aid), and varies widely among countries (Gillis et al., 1987). When we move beyond determinants of total investment and start to look at the composition of that investment, new factors come into play. For instance, there is reason to believe that the determinants of investment in information technology (IT)1 are not simply like other capital investments which are usually made in anticipation of demand for manufactured products. IT investments are likely to be driven more by the service sector because services are more information intensive and therefore have a greater need for IT (Bell, 1973). Historically, the service sector has lagged behind manufacturing in productivity growth, so services companies have strong incentives to substitute IT for labor in the expectation of increased productivity. Since services
1
Information technology in its broadest meaning includes computers, telecommunications and management science techniques. This papers focuses on the computer component of IT.
ITR-162.doc
2
constitute a larger share of the economy in more developed countries, we would expect higher rates of IT spending (as a share of GDP) in wealthier countries. The objective of this paper is to better understand the factors that drive investment in IT at the country level. We knew from earlier analyses that IT investment is related to national income, but did not know if a country’s level of wealth is the primary determinant or if other factors might be important (Kraemer and Dedrick, 1994). In order to get a better picture of what determines IT investment, we conducted a series of analyses using country data on IT spending and a variety of national indicators over time. These analyses were determined by a conceptual model of key factors which the literature suggests are related to IT investments (Figure 1) . The model suggests that levels of investment in IT use at the national level are influenced by four key factors: (1) national wealth, measured by GDP per capita; (2) structure of the economy, particularly the size of information intensive sectors such as finance and business services; (3) IT infrastructure, including human resources and telecommunications networks; and (4) price/performance of IT, hardware, software and services. National wealth is important because wealthier countries should have more capital and more efficient capital markets to provide the necessary capital for companies and other organizations to invest in IT. Wealthier countries also have higher wage rates, which also should stimulate greater IT demand as organizations paying higher wages stand to gain a higher return from replacing labor or improving labor productivity (Barro, 1997). The structure of the economy is expected to influence IT demand, as some industry sectors are more information intensive than others and therefore create higher need for information processing. For instance, we would expect countries with a large financial services sector to have a higher demand for IT than those with economies based mostly on agriculture or manufacturing (Bell, 1973; Porat, 1977). The presence of an adequate IT infrastructure is expected to be related to investment in IT because IT is a complex technology requiring supporting networks of electricity, telecommunications and skilled human resources. The greater the reliability and the lower the cost of the supporting infrastructure, the greater should be the investment in IT. Finally, the price/performance of IT available in a country should have an impact on IT investment. When computers are cheaper, relative to their performance, the potential returns from an investment in IT should be greater, and countries with lower overall IT prices should have greater demand for IT. The historical pattern of increasing IT investments as the prices of computers fall provide support for this expectation (Dewan and Kraemer, 2000).
3
ITR-162.doc
Figure 1. Conceptual Framework
National Wealth and wage rates
Structure of the Economy
Resources to make technology investments, labor substitution payoffs
Value of IT use varies by industry sector
Level and growth of IT Investment Necessary support for productive application of IT
IT Infrastructure
Technology improvements increase returns to use
Price/performance of IT
Using this framework, we ran several analyses to assess the relative importance of the factors that might determine levels of IT investment. Specifically, we used data on 31 countries for the period 1985-1995, and conducted time series analyses to study the impact of the structure of the economy, wealth, PC prices, education, and telecommunications infrastructure on IT investment. We found a strong relationship between the structure of the economy and IT investment. We also found a relationship between national wealth and IT investment. Based on these analyses, we conclude that IT investment is driven by the structure of the economy and by the level of wealth in a country. Other factors, such as telecommunications penetration, education levels and prices did not provide additional explanatory power in estimating IT investment.
II. DATA AND METHODS Data Sources Data on IT investment from 1985-1995 for 46 countries was provided by International Data Corporation (IDC). PC prices were calculated by dividing total PC spending by the number of units sold in each country. Data on the structure of national economies comes from the International Labour Organization's Yearbook of Labour Statistics, showing employment for each country in ten industry categories (single digit ISIC categories). GDP per capita and GDP growth rates were calculated from the World Bank's World Development Indicators. Educational data is average years of education, from the United Nations Development Programme's Human Development Report. Unfortunately, data is only available for one year (1990), so this figure was applied for all years, as it was assumed that this measure would not change much over 10 years. Telecommunications investment as a percentage of GDP is obtained from the International Telecommunications Union World Telecommunication Development Report. Ultimately, we were able to include 31 countries in the analysis, as adequate data was available for those countries.
4
ITR-162.doc
Data Issues One of the major issues in the conduct of the analysis was the treatment of GDP. Specifically, there was an issue of how we account for exchange rates and inflationary factors in each individual country. In order to address the issue, we used GDP, price, and investment data in U.S. dollars for a constant year for all countries. Without this, meaningful comparisons across counties would be impossible because the results would not have the same basis for comparison or interpretation. For some countries such as Great Britain and Canada where inflation is kept relatively in check and each maintains a relatively steady exchange rate with the U.S. dollar, such computation can be made quite easily. However, for most developing countries that have undergone dramatic swings in inflation and exchange rates, the volatility is more difficult to handle. The problem arises when, following normal practices, we adjust each countries’ GDP first by its annual inflation index, and then convert it into U.S. dollars by the years average exchange rates. A problem arises because by nature, exchange rates are related to the countries’ inflationary factor--higher inflation rates are generally associated with falling currency values or lower exchange rates. Though the two factors are not perfectly correlated, there are substantial overlaps such that when one adjusts for both inflation and exchange rates, one is in effect double discounting. Several methods were tried to correct for double discounting and one method was found to provide the most consistent results across countries. The resultant adjustment equation for GDP is show below. The adjusted GDP using this equation was applied to all subsequent analyses: GDPX =
WDGDPX
* (WDOEA90X)
DEFX / 100
Where: WDGDPX = World Development GDP for country X in local currency = IMF inflationary index for country X (100=1990) DEFX WDOEA90X = World Development average annual daily exchange rate for country X in year 1990
Variables In order to proceed with the analysis, the following variables were constructed. GDP per Capita =
GDP Population
Percent of investment in IT =
Total IT investments GDP
Percent of workforce in = business services
Average PC prices =
Total employment in business Services Total work force Total PC investments Total PC market (units)
ITR-162.doc
5
Note: business services is defined as the ISIC category for finance, insurance, real estate and business services.
The Sample The mean and median statistics for all variables across all countries in the analysis are reported in Tables 1 and 2 respectively. There are a total of 31 countries in the analysis, but not all countries are represented in all the analyses. As the years go on, some countries drop out because of failure to report data to various international agencies (e.g., IMF, World Development). At the same time new countries are added because international agencies started to collect data on these countries. In particular, after the breakup of the Soviet Union, there is a sudden increase in the number of countries reporting in the 1990s that were not reporting during the 1980s. The data are further complicated by the fact that not all countries report all relevant statistics. The variable with the least reporting countries is employment in the business services sector. Thus, the sample size fluctuates; the year with the lowest number of countries is 1995.2 In general, the mean and median country statistics show an increasing trend for IT investments, GDP, and percent of workforce in business services from the year 1985 to 1995. Average PC prices is the only variable that has shown consistently decreasing numbers as would be expected. Comparison between means and medians was initially somewhat troubling. The median for GDP and Total Investment in IT are significantly lower than the corresponding means for all years. This is an indication that the sample is not normally distributed, but rather is positively skewed. Deviation from normality will cause problems in model estimation in that it causes the estimated parameter to be positively biased and inconsistent. The cause for this is the inclusion of large and economically advanced countries such as U.S. and Japan that invest heavily in IT and have high GDP. We alleviated this problem by adjusting for country size; that is we used GDP per capita and IT investment as percent of GDP instead of GDP and IT investment alone. Looking at the means and medians for these two variables, the differences between means and medians are relatively small, indicating that the distributions are well behaved for the analyses planned.
2
A possible explanation for the low numbers in 1995 may be that certain countries were late in reporting their domestic statistics.
6
ITR-162.doc
Table 1. Mean statistics of the country sample (US$) Total IT Investment
Total IT Investment /GDP
% Workforce in Business Services
Average PC Prices
YEAR
GDP
GDP Per Capita
1985
354 B
10,534
3.76 B
0.62%
6.68%
N/A
1986
365 B
10,810
4.71 B
0.77
7.40
N/A
1987
379 B
11,130
5.63 B
0.92
7.63
N/A
1988
397 B
11,482
6.63 B
1.08
7.34
N/A
1989
411 B
11,776
7.22 B
1.18
7.70
N/A
1990
453B
11,959
8.49 B
1.41
7.68
2,780
1991
458 B
11,847
9.03 B
1.46
7.81
2,666
1992
468 B
11,954
9.66 B
1.52
8.09
2,256
1993
477 B
12,045
10.00 B
1.49
9.61
2,011
1994
494 B
12,428
10.90 B
1.61
9.51
1,941
1995 513B 12,705 1985 – 430B 11,714 1995 *Average is for 1990 to 1995 only.
12.90 B
1.89
8.57
2,017
8.08 B
1.27
7.91
2,279*
Table 2. Median statistics of the sample countries (US$) Total IT Investment 0.44 B
Total IT Investment /GDP 0.61
% Workforce in Business Services* 6.33
Average PC Prices N/A
YEAR 1985
GDP 114 B
GDP Per Capita 10,020
1986
119 B
10,253
0.56 B
0.87
7.10
N/A
1987
125 B
10,858
0.68 B
0.93
7.35
N/A
1988
128 B
11,481
0.86 B
1.01
7.60
N/A
1999
135 B
11,975
1.07 B
1.09
7.83
N/A
1990
138 B
12,228
1.34 B
1.37
7.79
2,499
1991
142 B
12,371
1.53 B
1.53
7.22
2,417
1992
147 B
12,478
1.80 B
1.57
8.48
2,057
1993
155 B
12,678
1.56 B
1.52
9.28
2,025
1994
160 B
13,040
1.85 B
1.62
9.42
2,102
1995 166 B 13,626 1985 – 134 B 11,283 1995 * Averages for 1990 to 1995 only.
2.20 B
2.04
8.03
2,007
1.27 B
1.15
7.67
2,157*
III. MODEL DESCRIPTION The general model for the analysis was a linear regression where: KIT = α + β (GDPCAP, TELECOM, INVEST, ED, EMPBUS, PCPRICE)
7
ITR-162.doc
An initial analysis was run on all elements of the conceptual model, but no significant relationship was found between telecommunications investment and IT investment, when controlling for other factors. We also found no significant relationship between IT investment and education (average years of schooling) for the year that it was available (1990). We then focused on the impacts of wealth, structure of the economy, and PC prices, for which we had data for multiple years. We used the following base model: INVESTit = α + β1 GDPCAPit + β2 EMPBUSit + β3 PCPRICEit + ε Where: INVEST = Percentage of GDP invested in IT GDPCAP = GDP per capita EMPBUS = Percentage of workforce employed in business service sectors PCPRICE = Average PC prices i = 1, 2, …, Ith countries t = 1985, 1986, …, 1995
Essentially, the model is a pooled linear regression model whereby instead of estimating a different model for each country or each year, the countries and their data across time are “pooled” together in estimating a single model. Such a model has the benefit of increasing sample size, thus providing additional power to detect significant parameters. In addition to the base model, we developed three different nested models. The purpose of the nested models was to test for effects for individual country (i.e., country characteristics) and effects of time that may be lost due to the aggregation in the base model. The nested model tested for individual country effects by introducing a set of I-1 dummy variables of 1 and 0 into the base model. If these I-1 dummy variables contribute significantly to the explanatory power of the model, then it means there are individual country effects that are captured by the model. Similarly, 10 dummy variables (11 years –1) were used to account for the time effect. The third model combines these two sets of dummy variables in the same model. The three nested models are shown below: INVESTit = α + β1 GDPCAPit + β2 EMPBUSit + β3 PCPRICEit + ΣT γt DTt + ε INVESTit = α + β1 GDPCAPit + β2 EMPBUSit + β3 PCPRICEit + ΣI λi DIi + ε INVESTit = α + β1 GDPCAPit + β2 EMPBUSit + β3 PCPRICEit + ΣT γt DTt + ΣI λi DIi + ε Where: DT = 0 and 1 dummy variables where control = 1985 DI = 0 and 1 dummy variables where control = Hong Kong
IV. MODEL ESTIMATION AND RESULTS After pooling the data, a total sample of 290 country datapoints were available for analysis. The model was estimated using ordinary least square regression analysis. The base model produced the results shown in Table 3.
8
ITR-162.doc
The base model produced significant parameter estimates for GDPCAP and EMPBUS, but the parameter estimate for PCPRICE was not significant. This indicates that investment in IT as a proportion of GDP is positively related to national wealth and percentage of workforce employed in business services, but that average PC prices have no effect in determining the annual IT investment levels. Further, GDP per capita is relatively more important, based on t-value (6.852 vs. 4.877), in determining IT investments than the structure of the economy. Table 3. Base model results Parameter Constant 0.695 GDPCAP 4.090E-5 EMPBUS 0.049 PCPRICE 1.091E-5 R2 = 0.589 F = 52.53, p < 0.001
t-value 5.450 6.852 4.877 0.230
p-value < 0.001 < 0.001 < 0.001 0.819
However, the R2, while significant, is relatively modest. The current model accounts for roughly 59 percent of the variance observed in IT investment level. This suggests that we will need to turn to the nested models and test for additional explanatory power. The first nested model tested is the model with time dummy variables (Table 4). The model produced similar parameter estimates as the base model; thus all interpretations remain the same. The time-dummy model yielded one significant year effect for 1995. This indicates that after controlling for GDPGAP, EMPBUS, and PCPRICE, 1995’s IT investment level is still significantly above 1985 levels. Thus, the time-dummy model provided better explanatory power than the base model (R2 = 0.640 vs. 0.589) and the difference was significant. Table 4. Base model with time dummy variables (years) Parameter t-value Constant 0.497 3.133 GDPCAP 3.744E-5 6.330 EMPBUS 0.047 4.821 PCPRICE 6.393E-5 1.287 YD10 0.596 3.521 2 R = 0.640 F = 23.304, p < 0.001 Significance of Change in F, p < .05
p-value < 0.003 < 0.001 < 0.001 0.201 < 0.001
The second nested model tested was the country-dummy model, which produced one significant change (Table 5). The parameter PCPRICE was significant, indicating that higher prices result in higher IT investment levels. This result was unexpected and is problematic. The result should not be taken to indicate that higher that higher PC prices will result in higher investment levels. The problem with the price analysis was the lack of any measure of performance of PCs at comparable prices in different countries, and the fact that PC prices were calculated rather than directly observed. It is likely that the method we used for deriving PC prices leads to results that do not reflect the actual prices in the countries. That is, actual prices may be lower than our estimates.
9
ITR-162.doc
In addition, there is no means of determining the performance of PCs in different countries. For instance, an average $1500 PC in one country could be a more powerful model that a $1500 PC in another country. A more meaningful test of the impact of prices on demand would come from data showing prices of comparable systems for all countries. Such data is not presently available in the industry. Finally, PC price/performance is only a surrogate measure of overall IT prices, and might not reflect the cost of the whole range of hardware, software and services in a country. Table 5. Base model with country dummy variables Parameter t-value Constant -1.419 -2.418 GDPCAP 2.770E-4 14.105 EMPBUS 0.030 2.245 PCPRICE 4.564E-4 1.287 R2 = 0.828 F = 1233.974, p < 0.001 Significance of Change in F, p < .001
p-value < 0.020 < 0.001 < 0.030 < 0.050
The second nested model provided good overall fit as indicated by the high R2 (0.828) compared to the base model (0.589). A majority of the country-dummy variables were significant, but were not reported because the control group, Hong Kong, was selected idiosyncratically and individual parameters have no real meaning. The proper explanation for the country-dummy effect is that there exist significant levels of variability (roughly 23%) that are accounted for by individual country level effects and not captured by the base model or available data. These effects may be from a number of sources such as governmental policies, cultural factors, labor relations, or prevailing business and managerial practices not tested. The third nested model incorporated country-dummy and time-dummy variables, and did not produce results that were different from the models above. The change in explanatory power was not significant from the country-dummy model (p < 0.05). Because the results were similar, it is not reported here. V. DISCUSSION The only consistently significant determinants of IT investment at the country level are the level of wealth and the structure of the economy. Those two factors explain roughly 60% of the variance in IT investment. Other hypothesized factors such as telecommunications infrastructure, education levels or IT price/performance either had no impact or the results were inconclusive due to inadequacy of the data. These findings are valuable in that they give us better insight into why some countries spend more of their national income on IT than others. They also can serve as a basis for developing better forecasting tools. Some key points that come from this analysis are as follows: •
GDP growth should lead to a proportionately higher growth in investment in IT. This is because as countries become wealthier, they spend a greater share of their national wealth on IT. Furthermore, this relationship is not linear, but actually curves upward, as seen in Figure 2 below. So for wealthy countries, even a small growth in GDP can lead to relatively large increases in IT investment.
10
ITR-162.doc
Figure 2. Relationship between GDP per capita and IT as percent of GDP, 1995 •Sweden• US
New Zealand
•
3
Australia
•
Canada
• •UK
2.5 South Africa
Switzerland
Netherlands
•
•
• Singapore
•
•
•
2
Belgium
Israel
•
Malaysia
•
•
•
Norway
Finland Korea
Denmark •
•
Japan
•
France • Austria
•
Ireland
Hungary
•
1.5
Chile
Hong Kong
•
• • Brazil Colombia•
Italy
Spain
•
•
1
Portugal Poland • Venezuela •• Philippines Taiwan • • Thailand Greece • India • • Russia Mexico• • China • Argentina ••• Egypt 0.5 Indonesia
•
Turkey
0 0
5000
10000
15000
20000
25000
30000
35000
40000
45000
GDP per capita
•
IT spending as a share of GDP has continued to increase over time for all countries. As seen earlier in Table 2, the mean share of IT as a percent of GDP grew from 0.61% in 1985 to 2.04% in 1995. Moreover, Figure 3 below shows that the trend line for IT investment has shifted upward over time for all countries (Figure 3 uses a log/log scale).
•
There is a trend for poorer countries to have faster growth in IT spending than richer ones. This can be seen again in Figure 3 by the fact that the trend line flattens over time (i.e., the 1995 trend line converges somewhat towards the 1985 trend line). This seems surprising, given the upward curve of the trend line in Figure 3, suggesting that wealthier countries would see higher growth rates in IT investment over time. The explanation may be that poorer countries have higher GDP growth rates on average than rich countries.
11
ITR-162.doc
•
Countries with similar levels of wealth may have very different economic structures. Those whose economy is more heavily concentrated in the information-intensive business services sector will have greater demand for IT. Therefore, any factors that lead to faster growth in the business services sector (such as liberalization of financial markets, adoption of e-commerce) should lead to increased demand for IT, regardless of the level of economic growth.
Figure 3. IT/GDP and GDP per capita, 1985 and 1995
10.00 1995 y = 1E-05x 1.2288 R2 = 0.7172
IT/GDP (%)
1.00 1000
10000
1985 y = 2E-06x 1.3144 R2 = 0.5936
100000
0.10
0.01
GDP per capita
VI. CONCLUSION This research has sought to develop understanding of the factors that drive IT investment. It is an important step in theory-building in that we have shown that the only consistently significant determinants of IT investment at the country level are the level of wealth and the structure of the economy. Moreover, these two variables explain about 60 percent of the variance. Other national characteristics such as unionization, economic liberalization, government regulation, and business practices might explain some of the remaining variance, but they were not examined in this research. Future research should address such national characteristics. The research is also an important step in practical application as it leads to developing better models for market forecasting and estimating market potential. While short term demand for IT, and therefore IT investments, can rise and fall with business cycles and other economic fluctuations, it is clear from this research that longer term demand will move in line with economic
ITR-162.doc
12
growth trends and with changes in the structure of each country’s economy. As more countries shift towards an information economy, there will be proportionately greater investments in IT. For IT companies, these findings have implications in terms of what markets have the most potential and where they might focus marketing efforts. These findings are also useful because they offer a simple set of variables to concentrate on when analyzing international markets. For national governments, these findings show that one of the fastest ways to promote IT diffusion is through policies that liberalize the finance and business services sectors. As those sectors grow and become more competitive, they will invest heavily in IT, helping to improve the productivity of those sectors and the economy as a whole. They will also spur demand for local IT companies and workers, especially in the information services industry, whose services by nature must be provided locally (Dedrick and Kraemer, 1998). At this point in the evolution of the global IT industry, most countries cannot hope to develop a competitive local hardware industry, except perhaps in highly specialized, niche markets. However, nearly all countries can develop software, content and services industries which are the fastest growing segments of the IT industry today.
13
ITR-162.doc
REFERENCES Barro, Robert (1997). Determinants of Economic Growth: A Cross-Country Empirical Study. Cambridge, MA: The MIT Press. Bell, Daniel (1973). The Coming of Post-Industrial Society: A Venture in Social Forecasting. New York: Basic Books. Dedrick, Jason and Kenneth L. Kraemer (1998). Asia’s Computer Challenge: Threat or Opportunity for the United States and the World. New York: Oxford University Press. De Long, J. Bradford and Lawrence H. Summers (1991). “Equipment Investment and Economic Growth.” Quarterly Journal of Economics 106:445-503. Dewan, Sanjeev, and Kenneth L. Kraemer (2000). “Information Technology and Productivity: Evidence from Country Level Data.” Management Science, special issue on the Information Industries. Gillis, Malcolm, Dwight H. Perkins, Michael Roemer and Donald R. Snodgrass (1987). Economics of Development (second edition). New York: W.W. Norton. International Data Corporation (1997). “Value of IT Shipments,” data and documentation from IDC provided to Center for Research on Information Technology and Organizations (CRITO), University of California, Irvine. International Labour Organization (1998). Yearbook of Labour Statistics, Geneva: ILO. International Telecommunications Union (1997). World Telecommunication Development Report Geneva: ITU. Kraemer, Kenneth L., and Jason Dedrick (1994). 'Payoffs from investment in information technology: lessons from the Asia-Pacific region'. World Development 22: 1921-31. Kraemer, Kenneth L. and Jason Dedrick (forthcoming). Information Technology and Economic Development: Results and Policy Implications of Cross-Country Studies. In Pohjola (ed.), Information Technology and Economic Development, Oxford University Press. Porat, Marc (1977). The Information Economy: Definition and Measurement. Washington, DC: U.S. Department of Commerce. United Nations Development Programme (1996). Human Development Report. New York: Oxford University Press. World Bank (1997). World Development Indicators on CD-ROM. Washington D.C.: The World Bank