Data Driven Fuzzy Membership Function Generation for Increased Understandability Dumidu Wijayasekara, Milos Manic
Abstract—Fuzzy Logic Systems (FLS) are a well documented proven method for various applications such as control classification and data mining. The major advantage of FLS is the use of human interpretable linguistic terms and rules. In order to capture the uncertainty inherent to linguistic terms, Fuzzy Membership Functions (MF) are used. Therefore, membership functions are essential for improving the understandability of fuzzy systems. Optimizing FLS for improved accuracy in terms of classification or control can reduce the understandability of fuzzy MFs. Expert knowledge can be used to derive MFs, but it has been shown that this might not be optimal, and acquiring expert knowledge is not trivial. Therefore, this paper presents a data driven method using statistical methods to generate membership functions that describe the data while maintaining the understandability. The presented method calculates key points such as membership function centers, intersections and slopes using data driven statistical methods. Furthermore, the presented method utilizes several understandability metrics to adjust the generated MFs. The presented method was tested on several benchmark datasets and a real-world dataset and was shown to be able to generate MFs that describe the dataset, while maintaining high levels of understandability.
F
I. INTRODUCTION
UZZY Logic Systems (FLS) are a well documented and proven method for control, classification, data mining and various other fields [1], [2]. The main advantage of FLS is the utilization human understandable linguistic terms that are capable of capturing uncertainty and vagueness in everyday language [3]. The ability to handle such linguistic terms make FLS attractive as they are highly interpretable and transparent [4]-[7]. However, the understandability of a fuzzy system is heavily dependent on the understandability of its linguistic terms [1], [8]. The linguistic terms are modeled in the data domain via Fuzzy Membership Functions (MFs). Therefore, determination of the linguistic terms, hence the generation of MFs plays a significant role fuzzy system design [1]. The MF should be capable of conveying the knowledge contained in the original data [9], [10]. However, the design of MFs significantly affect the outcome of the FLS [11], [12]. Therefore, many recent work optimize FLS by focusing on the accuracy of the output without considering the understandability of the system [7], [13]-[16]. Such numerical optimization results in highly accurate FLS, however, they pay little attention to the Dumidu Wijayasekara is with the Computer Science Dept, University of Idaho, Idaho Falls, ID 83402 USA (phone: 208-533-8127, e-mail:
[email protected]). Milos Manic is with the Computer Science Dept, University of Idaho, Idaho Falls, ID 83402 USA (e-mail:
[email protected]).
semantical properties of the generated MFs and linguistic terms, thus degrading the understandability of the resulting system [2], [7], [17]. Furthermore, for data mining applications such as linguistic summarization [2], [18], [19] or descriptive rule generation [20], where understandability of data is the goal [19], generating semantically correct MFs is important. Membership functions derived from expert knowledge are capable of solving understandability issues [12]. However, expert knowledge acquisition can be a difficult task. Experts on the required domain may not be always available, and even when they are available their opinions vary and can be incomplete, varying, and overly precise [4], [17]. Furthermore, due to the large number of dimensions, gathering expert knowledge for highly multi dimensional problems is difficult. Many applications consider pre-defined fuzzy MF [1]. However, this is also sub-optimal as it assumes the data will be distributed in a certain manner and therefore cannot be effectively used to handle specificity of real-world problems [1]. Therefore, the most attractive method of deriving MF is data driven. Furthermore, data driven methods have been shown to accommodate adaptation and self-tuning [4]. Typical MF generation techniques include data histogram based methods, heuristic methods, probability based methods, clustering based methods, neural networks based methods, etc. [21]. However, very little work focuses on the understandability of generated MF [1], [4], [13]-[17]. Furthermore, it has been shown that there is no one optimal way of generating MFs and the optimality depends on the application [21]. Thus, this paper presents a simple, data driven MF generation method that is capable of describing the dataset while maintaining understandability. The presented method utilizes statistical techniques to calculate MF centers, spread, overlap, slope etc. Student’s t-test is utilized to identify initial prototypes for MFs. Two different understandability metrics are introduced that measures understandability of MFs. The presented MF generation method utilizes these and several other understandability metrics to generate MFs and thus further increasing the understandability of the MFs. The presented method was tested on several benchmark datasets with known distributions as well as a real-world dataset. The generated MFs were shown to describe the data while maintaining high levels of understandability. The rest of the paper is organized as follows. Section II describes metrics proposed in the literature for measuring understandability of MFs, and discusses related work. Section III details the presented data driven method for MF generation. Finally, Section IV presents experimental results
dataset, and is considered to be a property for increased understandability [9], [8], [17]. For a given MF i, Normality can be expressed as:
normi max( i ( x)), x X
(5)
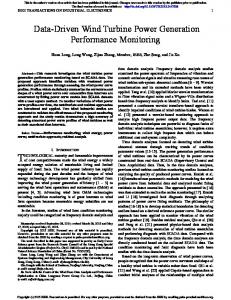
where, normi is the normality for ith MF. Thus, if a given MF has a core, then normality will be 1. It is universally agreed that MFs should be monotonic and convex for increased understandability [3], [9], [8], [23], [24]. In [23] this property is referred to as Unimodality, which can be expressed as: Fig. 1 Typically used Fuzzy Membership Functions (MF)
x1, x2 , x3 X : x1 x2 x3
and Section V concludes the paper.
i ( x2 ) min{i ( x1 ), i ( x3 )}
II. UNDERSTANDABILITY OF FUZZY MEMBERSHIP FUNCTIONS This section first presents metric proposed in literature to calculate understandability, and then discusses related work. A. Metrics for Understandability in Membership Functions Fuzzy Membership Functions (MFs) capture the uncertainty and vagueness of everyday linguistic terms [3]. Therefore, finding optimal partition of the input space, the shape of MFs, the coverage of MFs, and the linguistic term associated with the MFs are significant factors affecting the understandability of FLS [1], [10], [16], [22], [23]. Many metrics have been proposed in literature that measure understandability of MFs [8], [10], [16], [17], [24]. However, since understandability or interpretability depends on multiple factors, and understandability is extremely subjective and domain dependant, metrics for measuring true understandability are difficult to define [8], [10]. Fig. 1 shows three commonly used MFs defined for the input dimension X; a) triangular, b) trapezoidal and c) Gaussian. For a given input value x the membership degree for each MF i (x ) , where i is the MF, can be calculated (See Fig. 1). The core or the center of the MF is defined as the set of values whose membership degree is 1: x i ( x) 1 . Similarly, the footprint or the support of the MF is where the membership degree is greater than 0: x i ( x) 0 . The core and the support of a MF can be expressed as:
CL,i min(x : i ( x) 1) x X
(1)
S L,i max( x : i ( x) 0) x X
(2)
CR,i max( x : i ( x) 1) x X
(3)
S R,i min(x : i ( x) 0) x X
(4)
(6)
Dataset Coverage is also considered by many as a simple yet important metric for understandability [8], [17], [24]. This metric states that the range of the input dataset should be covered by at least one MF to a certain degree:
x X , i ( x)
(7)
where, 0 1 and can be preset by the user, and i p where p is the set of MF for input dimension X. Relatively moderate number of MFs for each dimension is also important for understandability [7], [8], [17]. This characteristic is simplified by authors in [7] as Partition Granularity by:
part
1 p 1
(8)
where, p is the number of MFs for a given dimension, and it is assumed that p 2 . For increased understandability, generated MFs should be sufficiently distinct from each other, with limited overlap [8], [17], [24]. This is typically achieved by a threshold value for intersection points:
i, j p : i ( x) j ( x) iff i ( x)
(9)
where, 0 1 and can be preset by the user, and p is the number of MFs. The measure Complementarity [8] is also closely related to the above measure. Complementarity is a property where for a given input value, the sum of all membership degrees is close to 1, and can be expressed as: p
Equations (1) and (3) describe the left and right boundaries of the core, respectively. Equations (2) and (4) describe the left and right footprint of the MF respectively. A Normal MF is defined as a MF that has a core, i.e. the membership degree is 1 for at least one point in the input
x X : (1 ) i ( x ) (1 )
(10)
i 1
where, 0 and can be preset by the user Another measure used to identify the distinctness of MFs is
the property of Separation. This property states that the cores of adjacent MFs must be separated by at least :
i p; C R,i C L, j ; j i p
(11)
Symmetry of generated MF is also considered as a relative measure of understandability as it reflects of universal duality and natural relativity of terms [8], [25]. In this paper, the measurement, Relative Dissymmetry is proposed to measure symmetry in MFs and is formalized as:
dissi
C L ,i
S R ,i
x S L ,i
x C R ,i
i ( x )
i ( x )
(12)
where, dissi is the dissymmetry measure for ith MF, and the dissymmetry measure can be normalized for a given MF as:
dissi
dissi S R ,i C L ,i max i ( x ), i ( x ) xS x C R ,i L ,i
(13)
The dissymmetry measure cannot be calculated for shoulder MFs that describe extremes (minimum and maximum) of data. A threshold can also be set for the membership degree of a MF inside the core of another MF [8], [16]. This property can be formalized as:
x [CL,i , CR,i ], j ( x) j i p
(14)
where, 0 1 and can be preset by the user. Typically is set to zero [16], meaning membership degree of other MFs is zero within the core of a given MF. Finally, in this paper, a measurement is introduced that measures the compliance of a MF to the data explained by it. This measure is called Compliance and can be measured by utilizing a normalized histogram [26] containing n bins. The normalized degree of compliance for ith MF comp i can be formalized as:
comp i 1
uncomp i S R ,i h ( x)
(15)
x S L ,i
where, h ( x ) is the maximum possible value of the histogram for the input value x, which in the case of the normalized histogram is 1. And,
uncomp i
S R ,i
h ( x ) i ( x )
x S L ,i
(16)
where, h(x) is the height of the normalized histogram for value x. The normalized degree of compliance is 1 when the MF fully complies with the data and decreases as the MF does not comply with the data. B. Related Work Several authors have proposed methods for generating understandable MFs in recent years [8]. Some have used several of the above mentioned understandability (interpretability) measures. Typically the proposed methods used can be separated into three main categories: cluster based methods, evolutionary methods, and combined methods with pre-set MFs. A constrained Fuzzy C-Means (FCM) based method is used in [3] generating more understandable MFs. Similarly, a modified FCM based method is used in [23]. The authors utilize clustering to generate MFs and then combine similar MFs for increased understandability in [4] and [27]. Clustering and cluster distances are used to derive understandable MFs in [24]. However, clustering based methods has several disadvantages as well as advantages [3]. In [1] the authors use hedge algebra based semantics to assign linguistic terms to information granules and utilize simulated annealing to optimize MFs. Symmetrical MFs are generated using evolutionary algorithms in [25]. In [16] and [17] evolutionary algorithm based approaches are proposed that make use of understandability metrics. The authors use preset MFs, and tune these using lateral movements in [28]. In [14] and [15] the authors propose an algorithm that utilizes pre-shaped MFs along with Fuzzy C-Means (FCM) clustering to generate transparent MFs. Similar method that also utilizes evolutionary algorithms is proposed in [13] and [29]. Pre-set MFs require the use of experts and may be sub-optimal as mentioned in Section I. The primary drawback of clustering and evolutionary algorithm based methods is the increased computational complexity. In contrast, the presented method utilizes a deterministic, statistical approach to identify the optimal parameters for MFs. Furthermore, the presented method utilizes several understandability metrics to derive and fine-tune these parameters. This ensures that the understandability of generated MFs is maintained, while describing the data distribution. III. DATA DRIVEN METHOD FOR GENERATING UNDERSTANDABLE MEMBERSHIP FUNCTIONS The presented data driven, statistics based MF generation method is a 5 step process: Step1: Generate initial prototypes, Setp2: Refine generated prototypes, Step3: Generate initial MFs, Step4: Remove unwanted MFs, Step5: Refine generated MFs. Each step is focused on increasing the understandability of the MFs while maintaining the ability to describe the data properly. Prior to the MF generation process the dataset is normalized between 0 and 1. Detailed descriptions of each step are given below. Step1: In the first step initial prototypes for MFs are
generated. The first prototypes are the sample mean X data , minimum, mindata and maximum, maxdata values of the dataset. The Students’ t-test for unequal sample size and unequal variance [30] was used to identify portions of the data that are significantly different from the mean, to generate secondary prototypes. The Students’ t-test for two mean values x1 and x 2 can be expressed as:
x1 x 2
t ( x1 , x 2 )
s12 s2 2 n1 n2
(17)
where, s and n are standard deviation and sample size of each sample, respectively. If the t value is greater than the critical t value then the null hypothesis is rejected, meaning the two sample means are significantly different from each other. Using the Student’s t-test two prototypes to the left and two prototypes to the right of the sample mean are generated. These are formalized as:
PBL max( x ) : 0 x X dara ,
(18)
t ( x0, x , X dara) tCritical
PM L x0,PBL
(19)
Similarly,
PBR min(x ) : X dara x 1
(20)
t ( x x ,1 , X dara) tCritical
PM R x PB R ,1
(21)
where, PBL and PML are two secondary prototypes to the left of the sample mean and PBR and PMR are two prototypes to the right of the sample mean. These prototypes signify portions of the data that are significantly different from the initial prototype (sample mean). This process is iterated to the left of PBL and to the right of PBR using PML and PMR as the initial prototypes, until the newly generated prototypes surpasses the minimum and maximum values. Step2: In this step the generated initial prototypes are refined. First similar prototypes are combined. Prototypes within range of each other are averaged:
i j k , Pn
Pi Pj
2
Pi Pj
(22)
where k is the set of generated prototypes, Pi and Pj are
prototypes Pn is the new prototype and is a preset constant, and denotes the absolute value. Once this is done, Pi and Pj are removed from k and Pn is added to k. Secondly, prototypes within of the minimum and maximum values are removed, retaining only the minimum and maximum values. This is done because it is generally accepted that data extremes must be prototypes of some MFs [24]. Pi mi ndata Pi mi ndata
(23)
Pi ma xdata Pi ma xdata
(24)
Thirdly, the remaining prototypes are grouped to satisfy the separation property described in (11): i k , Pi Pi 1 Gm {Pi , Pi 1} (25) i k , Pi Pi 1 Gm {Pi },Gm1{Pi 1} (26)
where, G is a set of prototypes. By performing the grouping, portions of the data that are separable, but leads to higher granularity, are combined. During grouping if a group contains more than three prototypes, prototype that is closest to the left or right boundary of the group is deleted. This grouping process is performed until all prototypes satisfy the (25) and (26). Step3: Once the prototypes are refined, the initial MF are generated. For each of the generated groups G a MF is generated. The cores of the MFs are defined using the minimum and maxim prototypes of a group G: CL,i min(Pj )Pj Gi ; i 1,2,...,M
(27)
CR,i max( Pj )Pj Gi ; i 1,2,...,M
(28)
where, i is the generated MF and M is the set of generated groups in Step2. The support of the ith MF is defined as: S L,i max( Pj )Pj Gk : Pj CL,i ; k 1,., M (29) S R,i min(Pj )Pj Gk : Pj CR,i ; k 1,., M (30)
Thus, the left support of the ith MF SL,i is the prototype to the immediate left of the left core CL,i, and similarly the right support SR,i is the prototype to the immediate right of the right core CR,i. Step4: In this step the some of the generated MF are removed or combined to decrease granularity and increase understanding. Average understandability is defined for the fuzzy system which is used to identify MFs that will be removed or combined. The average understandability, AU is defined in terms of normalized dissymmetry (13) dissi and normalized degree of compliance (15) comp i , because
TABLE I PRESET CONSTRAINTS Description
TABLE II SIMILARITY OF GENERATED FUZZY SYSTEMS AT DIFFERENT LEVELS OF NOISE Symbol
Dataset coverage Maximum overlap point for two MF Complementarity Core Separation MF inside the core of another MF Hard threshold for the number of MF Soft threshold for the number of MF
Value 0.2 0.7 0.15 0.15 0 5 3
other metrics are already fulfilled:
M dissi AU i 1 M
M
comp i i 1
M
Noise Level (SNR)
2
(31)
where M is the number of MF in the system, and AU is the averaged understandability. When a MF is deleted, the prototypes that were used to generate the core of that MF are also deleted. For certain occasions detailed below, MFs are combined. This is done by creating a new MF by defining the core as the leftmost and rightmost prototypes of the MFs that are combined: CL, n min(Pk )Pk Gi , G j
(32)
CR,n max( Pk )Pk Gi , G j
(33)
where, i and j are the MFs that are being combined and n is the new MF that is generated. The MFs generated using the minimum and maximum prototypes of data are not deleted [24]. The remaining MFs are deleted or removed as follows: remove MFs that increases AU while the number of MF is greater than . If the number of MFs is still greater than then identify MF that reduces AU the least, and combine it with the closest MF using (32) and (33), until the number of MF is less than or equal to . The constants and are preset such that 2 . This ensures that the generated fuzzy system contains at least MFs and less than or equal to MFs. Step5: Finally, the spread of the remaining MFs are adjusted to fulfill criteria (7), (9), (10) and (14). This is achieved using the same method in Step3 using (29) and (30). IV. EXPERIMENTAL RESULTS The presented method was tested on several benchmark datasets with known distributions and a real world dataset. In order to verify the understandability of the generated MF, the compliance of each MF to the understandability metrics presented in Section II was used. In [5] Takagi and Sugeno stated that in order to claim the validity of a generated fuzzy system and the linguistic terms, the MFs must remain same in the presence of noise. Thus, in order to evaluate the validity of the presented system,
Dataset
Benchmark Uniform Benchmark Normal Benchmark Bivariate Benchmark Skewed Real-world Zone1 Real-world Zone2 Real-world Zone3
20dB
14dB
12.5dB
11dB
10dB
1 0.99 0.98 0.99 0.9 0.99 1
0.99 0.97 0.94 0.91 0.9 0.93 0.92
0.97 0.9 0.91 0.85 0.87 0.88 0.88
0.98 0.87 0.86 0.81 0.8 0.85 0.79
0.85 0.82 0.8 0.73 0.81 0.8 0.79
different levels of noise were introduced to the dataset and MFs was generated. These MFs were then compared to the MFs generated without noise by using the following measure:
simi , j
min(i ( x ), j ( x )) x
max( i ( x ), j ( x ))
(34)
x
where, i and j are the MF that are being compared, and i is from the set of original MF and j is from the set of MF created with noisy data. The similarity value, sim is 1 when i and j are completely overlapped and 0 when there is no overlap. The similarity of the fuzzy system was calculated using: p n o ise
max( simi, j )i pori
sysori, noise
j i
pnoise
(35)
where, ori is set of MF generated using the original data and noise is the set of MF generated using the noisy data. pori is the number of MF in ori and pnoise is the number of MF in noise. Noise from Signal-to-Noise Ratio (SNR) 20dB to SNR 10dB was introduced to the original data to generate the noisy data, where SNR is defined as:
Asignal SNRdB 10 log10 Anoise
(36)
where, Asignal and Anoise are amplitude of the input and amplitude of the noise, respectively. The preset values as tested for the understandability constraints presented in Section II are shown in Table I. Using these preset values four different benchmark datasets were tested. Each dataset was generated using a random number generator to follow a known distribution and contained 2000 data points. The tested known distributions were: uniform distribution, normal distribution, bivariate normal distribution, and right skewed distribution. Fig. 2 shows the initially generated prototypes and final MF for each benchmark dataset.
(a)
(b)
(c)
(d)
(e)
(f)
(g)
(h)
Fig. 2 Initial prototypes for (a) uniformly distributed data, (c) normally distributed data, (e) bivariate normal data, and (g) right skewed data, along with generated MF for, (b) uniformly distributed data, (d) normally distributed data, (f) bivariate normal data, and (h) right skewed data.
(a)
(b)
(c)
(d)
(e)
(f)
Fig. 3 Initial prototypes for real world zone temperature data - (a), (c) and (e), along with generated MF - (b), (d) and, (f)
For further validation, the presented method was tested on a real-world dataset obtained form an office building containing temperature of 3 zones. These zones were selected for their varying distributions of data. The dataset contained temperature values collected every 30 minutes for a period of a month. The initial prototypes and the generated MFs for the real world dataset are shown in Fig. 3. For all cases tested, all understandability constraints given in Section II were met. This is because the presented method ensures each of the understandability constraints is met during the MF generation process. The similarity of the generated fuzzy systems for different
noise levels is shown in Table II. Even for high noise levels, the generated fuzzy systems are close to the ones generated for the original dataset, thus confirming that the generated fuzzy systems are valid and describe the data consistently. V. CONCLUSION This paper presented a novel, data driven, statistical method for generating understandable Fuzzy Membership Functions (MFs) that describe data. The presented method uses classical statistical methods to identify initial MF prototypes. Two understandability measures were introduced. These, along with several other understandability metrics
were used to generate and fine-tune MFs for increased understandability. The presented method was tested on several benchmark datasets with known distributions as well as real-world datasets. The presented method was shown to produce meaningful MFs that describe the data while maintaining high degree of understandability. As future work, the presented method will be compared to other methods for understandable MF generation. The presented method will also be expanded further using more advanced statistical methods and will extended to accommodate the generation of Gaussian or Bezier MFs. Furthermore, the presented method can also be extended to facilitate the generation of type-2 MFs. Hybrid of classical methods and the presented method can be used to improve accuracy in classification and control system FLS while maintaining high levels of understandability. REFERENCES [1] [2] [3] [4] [5] [6]
[7] [8] [9]
[10]
[11] [12] [13] [14] [15]
C. H. Nguyen, W. Pedrycz, T. L. Duong, T. S. Tran, “A genetic design of linguistic terms for fuzzy rule based classifiers,” in Int. Journal of Approximate Reasoning, vol. 54, no. 1, pp. 1-21, Jan. 2013. A. Wilbik, J. M. Keller, J. C. Bezdek, “Generation of prototypes from sets of linguistic summaries,” in Proc. IEEE Int. Conf .on Fuzzy Systems, FUZZ-IEEE, pp 1-8, Jun. 2012. T. W. Liao, A. K. Celmins, R. J. Hammell II, “A fuzzy c-means variant for the generation of fuzzy term sets,” in Fuzzy Sets and Systems, vol. 135, no. 2, pp. 241-257, Apr. 2003. M. Setnes, R. Babuska, H. B. Verbruggen, “Transparent Fuzzy Modelling,” in Int. Journal of Human-Computer Studies, vol. 49, no. 2, pp. 159-179, Aug. 1998. H. Takagi, M. Sugeno, “Fuzzy identification of systems and its applications to modeling and control,” in IEEE Trans. On Systems, Man. and Cybernetics, vol. 15, no. 1, pp. 116-132, Jan. 1985. W. Duch, R. Adamczak, K. Grabczewski, “A new methodology of extraction, optimization and application of crisp and fuzzy logical rules,” in IEEE Trans. on Neural Networks, vol. 12, no. 2, pp. 277-306, Mar. 2001. D. D. Nauck, “Measuring interpretability in rule-based classification systems,” in Proc. IEEE Int. Conf. on Fuzzy Systems, FUZZ-IEEE. vol. 1, pp. 196-201, May 2003. M. J. Gacto, R. Alcalá, F. Herrera, “Interpretability of linguistic fuzzy rule-based systems: an overview of interpretability measures,” in Information Sciences, vol. 181, pp. 4340–4360. 2011. A. L. Medaglia, S. C. Fang, Henry L.W. Nuttle, J. R. Wilson, “An efficient and flexible mechanism for constructing membership functions,” in European Journal of Operational Research, vol. 139, no. 1, pp. 84-95, May 2002. O. Cordón, “A historical review of evolutionary learning methods for Mamdani-type fuzzy rule-based systems: designing interpretable genetic fuzzy systems,” in Int. Journal of Approximate Reasoning, vol. 52. pp. 894–913, 2011. I. Rojas, H. Pomares, J. Ortega, A. Prieto, “Self-organized fuzzy system generation from training examples,” in IEEE Trans. on Fuzzy Systems, vol. 8, no. 1, pp. 23-36, Feb. 2000. M. Mottaghi-Kashtiban, A. Khoei, Kh. Hadidi, “Optimization of rational-powered membership functions using extended Kalman filter,” in Fuzzy Sets and Systems, vol. 159, no. 23, pp. 3232-3244, Dec. 2008. L. Chen, C. L. Philip Chen, “Transparent linguistic interface generation and its application in fuzzy decision trees,” in Proc. IEEE Int. Conf. on Systems, Man. and Cybernetics, pp. 1337-1342, 2008. L. Chen, C. L. Philip Chen, “Pre-shaped fuzzy c-means algorithm (pfcm) for transparent membership function generation,” in Proc. IEEE Int. Conf. Systems, Man. and Cybernetics, pp. 789-794, 2007. L. Chen, C. L. Philip Chen, “Gradient pre-shaped fuzzy C-means algorithm (GradPFCM) for transparent membership function generation,” in Proc. IEEE Int. Conf .on Fuzzy Systems, FUZZ-IEEE, pp. 428-433, 2008.
[16] A. Riid, E. Rüstern, “Transparent fuzzy systems and modeling with transparency protection,” in Proc. IFAC Symp. on Artificial Intelligence in Real Time Control, pp. 229-234, 2000. [17] J. Valente de Oliveira, “Semantic Constraints for Membership Function Approximation,” in IEEE Trans. on Systems, Man. and Cybernetics, part A, vol. 29, no. 1, pp. 128-138, 1999. [18] C. Martinez-Cruz, D. Sanchez, G. Trivino, “Three main components of experience base in linguistic description of data,” in Proc. IEEE Int. Conf. on Fuzzy Systems FUZZ-IEEE, pp. 1-6, Jul. 2013. [19] D. Wu, J. M. Mendel, J. Joo, “Linguistic Summarization Using IF-THEN Rules,” in Proc. IEEE Int. Conf. on Fuzzy Systems FUZZ-IEEE, pp. 1 - 8, Jul. 2010. [20] D. Wijayasekara, M. Manic, “Visual, Linguistic Data Mining Using Self-Organizing Maps,” in Proc. of Intl. Joint Conference on Neural Networks, IJCNN, Jun. 2012. [21] S. Medasani, J. Kim, R. Krishnapuram, “An overview of membership function generation techniques for pattern recognition,” in Int. Journal of Approximate Reasoning, vol. 19, pp. 391-417, 1998. [22] M. Sugeno, G. T. Kang, “Structure identification of fuzzy model,” in Fuzzy Sets and Systems, vol. 28, no. 1, pp 13-33, Oct. 1988. [23] F. Hoppner, F. Klawonn, “A new approach to fuzzy partitioning,” in Proc. 20th NAFIPS Int. Conf., vol. 3, pp. 1419-1424, Jul. 2001. [24] G. Castellano, A. M. Fanelli, C. Mencar, “Design of transparent Mamdani fuzzy inference systems,” in Proc of HIS 2003, pp. 468-477, 2003. [25] C. H. Chang; Y. C. Wu, “The genetic algorithm based tuning method for symmetric membership functions of fuzzy logic control systems,” in Proc. IEEE Conf. on Industrial Automation and Control: Emerging Technologies, pp. 421-428, May 1995. [26] L. Chengyu, L. Peng, L. Zhao, J. Yang, L. Liping, “Evaluation method for heart failure using RR sequence normalized histogram,” in Computing in Cardiology, pp. 305-308, Sept. 2011. [27] M. Y. Chen, D. A. Linkens, “Rule-base self-generation and simplification for data-driven fuzzy models,” in Proc. IEEE Int. Conf. on Fuzzy Systems, FUZZ-IEEE, vol. 1, pp. 424-427, 2001. [28] R. Alcalá, Y. Nojima, F. Herrera, H. Ishibuchi, “Multi-objective genetic fuzzy rule selection of single granularity-based fuzzy classification rules and its interaction with the lateral tuning of membership functions,” in Soft Computing, vol. 15, pp. 2303–2318, 2011. [29] L. Chen, W. Pedrycz, C. L. P. Chen, “Computational intelligence techniques for building transparent construction performance models,” in Proc. IEEE Int. Conf. on Systems, Man. and Cybernetics, pp. 1166-1171, 2006. [30] C. A. Markowski, E. P. Markowski, “Conditions for the Effectiveness of a Preliminary Test of Variance,” in The American Statistician, vol. 44, no. 4, pp. 322–326, 1990.