Source: Proceedings of the 3rd Annual ANCRiSST Workshop, Lake Tahoe, CA, May 29-30, 2006.
Data Driven Model Updating using Wireless Sensor Networks Andrew T. Zimmerman1 and Jerome P. Lynch2 Department of Civil and Environmental Engineering, University of Michigan, USA
[email protected],
[email protected]
ABSTRACT In recent years, the structural engineering community has been actively exploring the use of wireless sensors in structural monitoring systems. A direct result of low-cost wireless sensors is wireless monitoring systems defined by high nodal densities offering extensive sets of structural response data. Such data sets can serve as a powerful tool for validation of structural design assumptions and formulation of performance-based design concepts. However, these benefits can only be gained if this data is analyzed. This paper explores the automated analysis of large sets of response data created by wireless sensor networks. Using the software modules and information technologies made available on the Network for Earthquake Engineering Simulation (NEES), structural response data collected with a wireless sensor network can be used to update analytical models commonly associated with the design and analysis of civil structures. For validation, a simple test structure is assembled in which wireless sensors are installed. Dynamic excitation and subsequent monitoring of the structure are performed using the NEES cyber-environment. Simulated annealing methods are employed to automate the updating of model parameters within OpenSees. This internet-based model updating framework can be further extended to serve as a scalable and fully automated structural health monitoring system. INTRODUCTION The long-term health and stability of civil structures (buildings, bridges, tunnels, among others) must be maintained to ensure societal functionality and public safety. As such, the structural engineering community is currently pursuing many new sensing paradigms aimed towards quick and accurate detection of damage in an instrumented structure. These types of technologies, often referred to as structural health monitoring systems, have been proposed for use in a variety of structures, especially in those where dynamic forces (e.g. winds and earthquakes) are quite high. In order to guarantee the accuracy of the sensor data collected, monitoring systems often require vast quantities of coaxial wire to link each individual sensor with a centralized data repository (Lynch and Loh 2005). The vast amount of labor and materials required to install such a system often drive the installation costs of a tethered monitoring system to be very large. For example, a monitoring system 1
Ph.D. Student
2
Assistant Professor
installed in a tall building can easily incur costs in excess of $5000 (USD) per sensing channel (Celebi 2002). As a result, monitoring systems tend to have insufficiently low nodal densities for accurate system identification and damage detection. Over the last 10 years, a wide variety of academic and commercial wireless sensor platforms have been developed and installed in civil structures around the world (Lynch and Loh 2005). While these wireless technologies can still be considered quite young, field validation studies have proven that wireless sensor networks can function at a level at or above that of traditional tethered systems. Thus, as costs associated with sensing networks are minimized and field deployments of high-density wireless health monitoring systems become more pervasive, extensive sets of structural response data will be made available to structural engineers in much larger quantities than ever before. These large sets of data can provide engineers with a powerful tool for both the validation of structural design assumptions and for the possible early detection of damage within a structure. However, these benefits can only be gained if the data gathered by the wireless monitoring system is analyzed. In this study, a scalable internet-based framework is proposed to track the health of a civil structure in which a dense array of wireless sensors are installed. Specifically, the cyberinfrastructure tools of the Network for Earthquake Engineering Simulations (NEES) are leveraged to provide realtime visualization of wireless sensor data, automate the comparison of analytical and experimental response data, and rapidly determine the health (damaged versus undamaged) of the structure. A core element of the framework is the use of a simulated annealing software agent that determines the parameters of analytical models implemented in OpenSees, an academic structural analysis package. The framework proposed is validated using a three-story structure excited by ground motion records. NETWORK FOR EARTHQUAKE ENGINEERING SIMULATION (NEES) The past two decades have witnessed a significant increase in the computing and information technologies readily available to the engineering profession. These advances have allowed the earthquake engineering research community to propose the formation of the Network for Earthquake Engineering Simulation (NEES). In order to provide advanced networking and data management tools to earthquake engineering researchers worldwide, NEES has made available an extensive cyberinfrastructure which allows its users to organize and share data, perform hybrid simulations, and participate in remote experiments all via the internet. Specifically, NEES users can capture and transmit a variety of live streaming data (sensor, video, audio) with Data Turbine (designed by Creare), and can view this data in real-time with the Real-Time Data Viewer (RDV) Java client. Users are also provided with a data repository and additional data organization tools in the web-based NEES Central (a centralized on-line data repository for all NEES projects). Additionally, NEES supports the use of OpenSees, an open source object-oriented structural analysis software package developed for the Pacific Earthquake Engineering Research Center. The NEES architecture is modular with all software elements remotely available through the internet, as shown in Figure 1. While designed to link a spatially distributed set of research facilities engaged in earthquake engineering research, the NEES architecture is also ideally suited for the implementation of an on-line data management system for monitoring the health of civil structures. For example, NEES data collection and visualization tools would allow facility owners and managers to view structural response data in real-time via the World Wide Web (WWW). In addition, the coupling of analytical and empirical data can automate the interrogation of response data for signs of structural damage. DAMAGE ASSESMENT BY MODEL UPDATING A plethora of damage detection methods have been proposed in the literature. For example, damage to a structure can often be detected by comparing structural vibration characteristics of an unknown structural condition (damage versus undamaged) to known undamaged states (Doebling et al.
Fig. 1. NEES cyberinfrastructure
1998, Teughels et al. 2002). In recent years, as computing resources have become more powerful and less expensive, sensitivity-based finite element model updating techniques have also been developed and successfully used for damage assessment (Teughels et al. 2004). By using iterative methods to adjust analytical model parameters (Young’s modulus, mass density, moment of inertia, etc) to experimental vibration results, structural damage can be detected based on the fact that these parameters change when a structure is damaged. Additionally, because these parameters can be applied individually to different sections of a structure, damage can not only be detected in a generalized sense, but localized and associated with a specific structural element. In structural dynamics, finite element or structural analysis models are often used to predict the dynamic response of structures to known external loading. However, the results obtained from these models often differ from the experimental results obtained from an actual dynamic test of the structure. There are many effects that may cause such disparity including incorrectly assumed boundary conditions and inaccurate modeling of material properties, among others. But in general, experimental data is assumed to be a better representation of how a structure behaves than any predictions made by a finite element or structural analysis model. As a result, it is generally desirable to update model parameters so that the model produces results that mirror the experimental results as accurately as possible (Levin and Lieven 1998). Many different model updating methods have been developed and tested over the last 25 years (Mottershead and Friswell 1993, Levin and Lieven 1998). One commonly used approach is to create a unique objective function that expresses the difference between analytically derived and experimental data. This function is then repeatedly executed with varying values of analytical model parameters until the difference between analytical and experimental data is minimized (Levin and Lieven 1998). One of the most common algorithms for determining the global minimum of an objective function is the simulated annealing optimization process. Simulated annealing is modeled after the annealing process of material physics, where a substance is heated until it is molten and then slowly cooled until the substance has assumed the global minimum energy state from an almost infinite number of other stable states. In 1953, Metropolis et al. developed an algorithm that simulates this process based on the Boltzman distribution which declares the probability of a system being in a given state, s, as: π T (s ) =
e − E (s )/ kT ∑ e − E (w )/ kT w∈S
The Metropolis criterion expresses the probability of a new energy state being accepted at a given system temperature, and can be stated as: accept the new state if and only if Enew ≤ Eold − T ln (U )
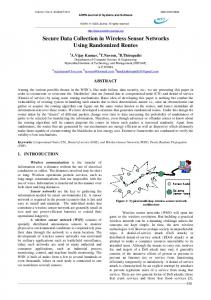
where U is a uniformly distributed random variable between 0 and 1, E is the energy of a given state, and T is the temperature of the system. A standard simulated annealing cooling schedule consists of starting the optimization procedure at
Fig. 2. Simulated annealing model updating algorithm
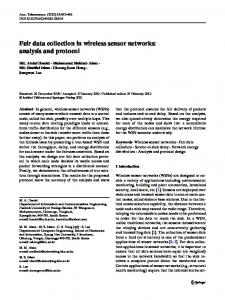
an initial temperature To and letting the Metropolis algorithm run for N iterations. During all iterations, the problem parameters are assigned values in a pseudorandom fashion and the difference between experimental and analytical values is calculated by using the objective function evaluated at those random values. A newly created state is either accepted or rejected as the current minimum based on the Metropolis criterion. After N iterations, the temperature of the system is reduced by a constant factor ρ. This process continues until very few new states are accepted at a given temperature and the system has, in essence, frozen. The simulated annealing algorithm is summarized in Figure 2. EXPERIMENTAL SETUP USING NEES For experimental purposes, a small three-story aluminum structure is constructed and its base is connected to a unidirectional modal shaker. Each floor is instrumented with one Crossbow CXL02LF1Z accelerometer oriented in the direction of the lateral excitation. A wireless sensor proposed for structural health monitoring by Wang, Lynch, and Law (2005) is used to record accelerometer data and to wirelessly transmit this information to a central server. This wireless sensing unit is a compact academic prototype intended to be used as an autonomous data acquisition node to which a variety of structural sensors can easily be interfaced. The wireless sensor is capable of collecting data with a resolution of 16-bits and at high sample rates (100 kHz). In this study, a total of four wireless sensors are employed with one wireless sensor used to record the lateral response of each level of the structure (base, floors 1, 2 and 3). Figure 3a presents a picture of the baseexcited laboratory structure; note that one wireless sensor is mounted to each level. In order to facilitate the automated model updating procedure, three Dell Optiplex GX270 desktop computers are configured as NEES servers. Each of these three workstations serves a distinct purpose, one for actuation (data acquisition server), one for simulation (simulation server), and one for system control (NEES Point-of-Presence (POP) server). The NEES POP server (http://neespop.engin.umich.edu) has the current version of the NEES POP software installed allowing it access to the remainder of the NEES network via the internet. Even though the three computers are all housed in the same laboratory, the architecture proposed is no different than if the three computers were installed in different locations anywhere on the internet. In addition to the standard NEES software modules offered, additional modules are written in the C programming language to tailor the NEES infrastructure to the structural health monitoring system architecture proposed herein. Specifically, two software modules are written for this purpose: a data collection client for the wireless sensors and a simulated annealing model updating software agent. The wireless data collection client is designed to coordinate the data collection activities of the wireless sensor network installed in a structure. In this implementation, the client collects the wireless sensor data at the actuation server. Once collected, the data is passed via internet sockets into Data Turbine (located on the NEES POP server) and readied for uploading to NEES Central (remotely located at https://central.nees.org). The simulated annealing model updating agent is designed to update analytical models formulated in OpenSees using the experimental data collected
(a) (b) Fig. 3. (a) Three-story test structure excited by a modal shaker; (b) overview of the experimental system implemented within the NEES cyberenvironment
from a structure. Even though in this study OpenSees is used to model the test structure, the agent is generalized so that other finite element and structural analysis packages can easily be employed. EXPERIMENTAL METHODOLOGY AND RESULTS The model updating procedure begins when the POP server commands the actuation server to excite the three-story structure with a prerecorded ground motion through the use of an MB Dynamics Modal 110 modal shaker. Using actuation capabilities made possible with MATLAB software, the actuation server begins this excitation of the shaking table and simultaneously commands the wireless sensing network to begin recording acceleration data. Once the requested ground motion has completed, the wireless monitoring system transmits its response data directly to the actuation server (using the data collection client) and returns to a standby state. The central server then receives the response data from the data collection client and converts it into four calibrated acceleration time history plots. Using the simulated annealing model updating procedure described earlier in this paper, the central server automatically begins a systematic search of all possible structural stiffness values for columns present in the test structure by running OpenSees (which is run on the simulation server). Figure 4 details the experimental steps fully automated by the NEES-based structural health monitoring system. Once a set of stiffness parameters have been selected by the model updating procedure for the undamaged structure, damage is induced in one of the base columns by gradually reducing the column section. Reduction increments of 25%, 50%, 75%, and 100% are used, with a full model update being performed between each increment. Section reductions of the column are introduced by cutting the column (which consists of two thin aluminum strips as shown in Figure 5). Once data has been collected for each increment of damage, results are compared and changes in stiffness are looked at as indications of structural damage. In this study, the choice of a proper objective function was of prime importance in terms of creating a link between experimental and analytical (OpenSees) data that could produce ample evidence of sustained structural damage. Following standard procedure for updating analytical models, it was decided to update this model not in the time domain, but rather in the frequency domain. Thus, frequency response functions (FRFs) were created for each of the four sets of acceleration response data. Several methods were tested in an attempt to find the optimal comparison between experimental and analytical frequency response data. Finally, a method was implemented which was modeled after the objective functions proposed by Jaishi and Ren (2005). Their function focused on a direct comparison between experimental and analytical modal frequencies and modal assurance criteria (MAC) values:
Fig. 4. Experimental methodology to identify structural damage based upon model updating
25%
50%
75%
100%
Fig. 5. Reduction in the cross sectional area of one of the four columns at the structure base
⎛ ω − ω ei Diff = α ⋅ ∑ ⎜⎜ ai ω ei i =1 ⎝ m
(
m 1− MAC j ⎞ ⎟⎟ + β ⋅ ∑ MAC j j =1 ⎠ 2
)
2
where ωai and ωei are the ith analytical and experimental modal frequencies, m is the number of modes, MACi is the modal assurance criteria of the ith mode, and α and β are weighting constants determined experimentally to properly account for differences in the magnitudes between the two objective functions. For this paper, α is taken to be 0.4 and β is taken to be 0.6. The MAC is defined by Allemang and Brown (1982) as (where φ i is the ith mode):
φ ei ) T (φ ai φ ai )(φ eiT φ ei ) Table 1 shows the model updating results obtained for varying degrees of column damage. While it is not clear that the model updating procedure was able to detect partial damage of one column, it can be see that when significant damage was induced in a column (as in the 50% and 100% cases), the model updating procedure was able to detect and localize the induced damage. Table 2 displays the excellent correlation that was achieved between the OpenSees analytical models and the progressively damaged experimental data after model updating. MAC i =
(φ
T ai
2
CONCLUSIONS This study represents the first step towards automated, data driven model updating using wireless sensing networks. Because of the increasing prevalence of wireless monitoring systems and the abundance of data they make available to the structural engineer, some sort of automated system is necessary in order to take full advantage of this wealth of information. In the proposed system, a distributed computing network is used to excite a structure, record its dynamic response, and find its current stiffness properties using a simulated annealing model updating approach. As the structure is progressively damaged, these stiffness values change, and damage can be detected and localized within the structure. Future work in this area will include further validation of the damage detection
capabilities of the system, automation of the damage detection algorithm itself, and the embedment of this automated system within the computing system of the wireless sensors.
0% 25% 50% 75% 100%
1st Floor Stiffness 2.88 lb/in 2.89 lb/in 2.31 lb/in 2.30 lb/in 1.59 lb/in
Table 1.
Model updating results
2nd Floor Stiffness 3.45 lb/in 3.48 lb/in 3.47 lb/in 3.46 lb/in 3.70 lb/in
3rd Floor 1st Floor 2nd Floor 3rd Floor Stiffness Change Change Change 4.21 lb/in ---4.18 lb/in 0.4% 0.9% -0.7% 4.18 lb/in -19.8% 0.5% -0.7% 4.27 lb/in -20.1% 0.3% 1.4% 3.93 lb/in -44.7% 7.3% -6.7%
Table 2.
Model updating correlation values
1st Modal 2nd Modal 3rd Modal Freq Error Freq Error Freq Error 0.0% 0.0% 0.0% 0% 2.3% 0.0% 0.0% 25% 50% 0.0% 0.0% -0.5% 0.0% 0.0% 0.0% 75% 100% 0.0% -1.6% -0.5%
1st MAC 1.0000 0.9995 1.0000 0.9999 0.9994
2nd MAC 0.9999 0.9997 0.9998 0.9995 0.9978
3rd MAC 0.9998 0.9998 0.9989 0.9995 0.9982
ACKNOWLEDGEMENTS The authors would like to express their gratitude to the National Science Foundation for sponsoring the research presented (Grant Number 0421180). REFERENCES R.J. Allemang and D.L. Brown, “A correlation coefficient for modal vector analysis,” Proceedings of the 1st International Modal Analysis Conferenece (IMAC I), 1983. M. Celebi, “Seismic Instrumentation of Buildings (With Emphasis on Federal Buildings),” Technical Report No. 0-7460-68170, United States Geological Survey, Menlo Park, CA, 2002. S.W. Doebling, C.R. Farrar and M.B. Prime, “A summary review of vibration-based damage identification methods,” The Shock and Vibration Digest, Vol. 30, No. 2, 1998, pp. 91-105. Bijaya Jaishi and Wei-Xin Ren, “Structural Finite Element Model Updating using Ambient Vibration Test Results,” Journal of Structural Engineering, Vol. 131, No. 4, April 2005, pp. 617-628. R.I. Levin and N.A.J. Lieven, “Dynamic Finite Element Model Updating using Simulated Annealing and Genetic Algorithms,” Mechanical Systems and Signal Processing, Vol. 12, No. 1, January 1998, pp. 91-120. J. P. Lynch and K. J. Loh (2005), "A Summary Review of Wireless Sensors and Sensor Networks for Structural Health Monitoring," Shock and Vibration Digest, Vol. 38, No. 2, 2006, pp. 91-128. Nicholas Metropolis, Arianna W. Rosenbluth, Marshall N. Rosenbluth, Augusta H. Teller, and Edward Teller, "Equation of State Calculations by Fast Computing Machines", Journal of Chemical Physics, Vol. 21, No. 6, June 1953, pp. 1087-1092. J.E. Mottershead and M.I. Friswell, “Model Updating in Structural Dynamics: A Survey,” Journal of Sound and Vibration, Vol. 167, No. 2, October 1993, pp. 347-375. Anne Teughels, Johan Maeck, Guido De Roeck, “Damage Assessment by FE Model Updating using Damage Functions,” Computers and Structures, Vol. 80, No. 25, September 2002, pp. 1869-1879. Anne Teughels, Guido De Roeck, “Structural damage identification of the highway bridge Z24 by FE model updating,” Journal of Sound and Vibration, Vol. 278, No. 3, December 2004, pp. 589-610. Y. Wang, J.P. Lynch, and K.H. Law, “Wireless Structural Sensors Using Reliable Communication Protocols for Data Acquisition and Interrogation,” Proceedings of the 23rd International Modal Analysis Conference (IMAC XXII), 2005.