Data Intensive Computing for Bioinformatics Judy Qiu1, Jaliya Ekanayake1,2, Thilina Gunarathne1,2, Jong Youl Choi1,2, Seung-Hee Bae1,2, Yang Ruan1,2, Saliya Ekanayake1,2, Stephen Wu1,2, Scott Beason1, Geoffrey Fox1,2, Mina Rho2, Haixu Tang2 1
Pervasive Technology Institute, 2School of Informatics and Computing Indiana University Bloomington IN, U.S.A. {xqiu, jekanaya, tgunarat, jychoi, sebae, yangruan, sekanaya, taklwu, smbeason, gcf, mrho,
[email protected]}
1
2
Introduction 1.1
Overview
1.2
Architecture for Data Intensive Biology Sequence Studies
2 3
Innovations in algorithms for data intensive computing 4 2.1
3
2
Visualization analysis by using parallel MDS and GTM 4
2.1.1
Parallel MDS and GTM 5
2.1.2
Experimental Results
2.1.3
Summary
7
9
2.2
Metagenomics Studies with Clustering 9
2.3
Metagenomics Studies with Hierarchical MDS 12
2.4
Summary
14
Innovations in programming models using cloud technologies 3.1
Runtimes and Programming Models
14
3.1.1
Parallel frameworks
3.1.2
Science in clouds ─ dynamic virtual clusters
3.2
14 16
Pairwise sequence alignment using Smith-Waterman-Gotoh
3.2.1
Introduction to Smith-Waterman-Gotoh (SWG) 18
3.2.2
Implementations
3.2.3
Performance comparison
3.3
14
18 20
Sequence assembly using Cap3 23
3.3.1
Introduction to Cap3
23
3.3.2
Implementations
23
3.3.3
Performance
24
18
3.4 4
5
Summary
25
Iterative MapReduce with i-MapReduce 25 4.1
MapReduce Extensions 26
4.2
Performance of i-MapReduce for Iterative Computations 27
4.3
Related Work 29
4.4
Future Work on i-MapReduce
4.5
Summary
Conclusion
30
30
30
Acknowledgements 30 Appendix A: Different Cluster Configurations used in this Analysis
31
1 INTRODUCTION 1.1 Overview Data intensive computing, cloud computing, and multicore computing are converging as frontiers to address massive data problems with hybrid programming models and/or runtimes including MapReduce, MPI, and parallel threading on multicore platforms. A major challenge is to utilize these technologies and large scale computing resources effectively to advance fundamental science discoveries such as those in Life Sciences. The recently developed next-generation sequencers have enabled large-scale genome sequencing in areas such as environmental sample sequencing leading to metagenomic studies of collections of genes. Metagenomic research is just one of the areas that present a significant computational challenge because of the amount and complexity of data to be processed. This chapter builds on research we have performed (Ekanayake, Gunarathne, & Qiu, Cloud Technologies for Bioinformatics Applications, 2010) (Ekanayake J. , et al., 2009) (Ekanayake, Pallickara, & Fox, MapReduce for Data Intensive Scientific Analyses, 2008) (Fox, et al., 2009) (Fox, Bae, Ekanayake, Qiu, & Yuan, 2008) (Qiu, et al., 2009) (Qiu & Fox, Data Mining on Multicore Clusters, 2008) (Qiu X. , Fox, Yuan, Bae, Chrysanthakopoulos, & Nielsen, 2008) (i-MapReduce, 2009) on the use of Dryad (Microsoft’s MapReduce) (Isard, Budiu, Yu, Birrell, & Fetterly, 2007) and Hadoop (open source) (Apache Hadoop, 2009) to address problems in several areas, such as particle physics and biology. The latter often have the striking all pairs (or doubly data parallel) structure highlighted by Thain (Moretti, Bui, Hollingsworth, Rich, Flynn, & Thain, 2009). We discuss here, work on new algorithms in section 2, and new programming models in sections 3 and 4. We have a robust parallel Dimension Reduction and Deterministic Annealing clustering, and a matching visualization package. We also have parallel implementations of two major dimension reduction algorithms – the SMACOF approach to MDS and Generative Topographic Mapping (GTM) described in section 2. MDS is O(N2) and GTM O(N) but, since GTM requires the points to have (high dimensional) vectors associated with them, only MDS can be applied to most sequences. Also, since simultaneous multiple sequence alignment MSA is impractical for interesting biological datasets, MDS is a better approach to dimension reduction for sequence samples, because it only requires sequences to be independently aligned in pairs to calculate their dissimilarities. On the other hand, GTM is attractive for analyzing high dimension data base records, where well defined vectors are associated with each point – in our case each database record. Distance calculations (Smith-Waterman-Gotoh) MDS and clustering are all O(N2), and will not properly scale to multi-million sequence problems and hierarchical operations to
address this are currently not supported for MDS and clustering except in a clumsy manual fashion. In the final part of section 2, we propose a new multiscale (hierarchical) approach to MDS that could reduce complexity from O(N2) to O(NlogN) using ideas related to approaches already well understood in O(N2) particle dynamics problems. In sections 3 and 4, we chose to focus on the MapReduce frameworks, as these stem from the commercial information retrieval field, which is perhaps currently the world’s most demanding data analysis problem. Exploiting commercial approaches offers a good chance that one can achieve highquality, robust environments, and MapReduce has a mixture of commercial and open source implementations. In particular, we have looked at MapReduce and MPI, and shown how to analyze biological samples with modest numbers of sequence on a modern 768 core 32 node cluster. We have learnt that currently MapReduce cannot efficiently perform clustering and MDS (Multidimensional Scaling) steps, even though the corresponding MPI implementation only needs reduction and broadcast operations and so fit architecturally functions supported in MapReduce. In addition, since we need to support iterative operations, we propose the use of a modified MapReduce framework called iMapReduce. An early prototype described in section 4 has been run on kernels but, as of this time, not on complete bioinformatics applications. Research issues include fault tolerance, performance, and support for existing MPI programs with the i-MapReduce run time supporting the subset of MPI calls. We also demonstrate in section 3 how we take “all-pairs” or “doubly data parallel” computations in two important bioinformatics sequencing applications, and use the results to compare two implementations of MapReduce (Dryad and Hadoop) with MPI. We describe an interesting technology developed to support rapid changes of operating environment of our clusters. We focus on the effects of inhomogeneous data and set the scene for discussion of i-MapReduce in section 4. One of the biological applications – sequence assembly by Cap3 – is purely “Map” and has no reduction operation. The other – calculation of Smith-Waterman dissimilarities for sequences – has a significant reduction phase to concentrate data for later MDS and Clustering.
1.2 Architecture for Data Intensive Biology Sequence Studies The data deluge continues throughout science, and practically all scientific areas need analysis pipelines or workflows to propel the data from the instrument through various stages to scientific discovery, often aided by visualization. It is well known that these pipelines typically offer natural data parallelism that can be implemented within many different frameworks.
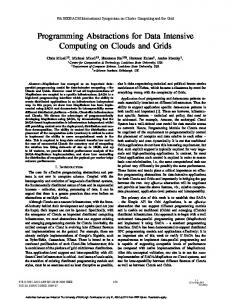
Read Alignment
Internet
Instruments Pairwise clustering
FASTA File N Sequences
Blocking
Form block Pairings
Sequence alignment
Dissimilarity Matrix N(N-1)/2 values
Visualization Plotviz
MDS
Figure 1. Pipeline for analysis of metagenomics Data
Figure 1 shows the data analysis pipeline shared by many gene sequence studies and, in particular, by our early work on metagenomics. Apart from simple data manipulation, there are three major steps – calculation of the pairwise distances between sequences, followed by MDS, and Clustering. We focus on the former here as it can use current MapReduce technologies, and exhibits a doubly data parallel structure, since the dissimilarities 𝛿𝑖𝑗 can be calculated independently for the N distinct labels of sequences i and j. Note that, currently, one cannot reliably use multiple sequence analysis (MSA) on large samples, which means techniques that only use pairwise distances between sequences (that can be reliably calculated) must be used, instead of methods relying on vector representations of the sequences. The lack of vector representation for sequences implies that many approaches to dimension reduction (such as GTM (Bishop & Svensén, GTM: A principled alternative to the self-organizing map, 1997)) and clustering (such as original vector-based Deterministic annealing clustering (Rose K. , Deterministic Annealing for Clustering, Compression, Classification, Regression, and Related Optimization Problems, 1998)) cannot be used. We have published several papers (Fox, et al., 2009) (Fox, Bae, Ekanayake, Qiu, & Yuan, 2008) (Qiu, et al., 2009) describing our earlier work on this pipeline and its related problems. The pairwise distances for metagenomics and other gene family problems are calculated using the algorithm developed by Smith-Waterman (Smith & Waterman, 1981) and Gotoh (Gotoh, 1982) (SW-G), but the process is complicated by the need to exploit the symmetry 𝛿𝑖𝑗 = 𝛿𝑗𝑖 , and to arrange the results in a form suitable for the next steps in the pipeline. We have obtained detailed performance measurements on MPI, Hadoop and Dryad with results summarized in section 3. This section also describes work on CAP3, which only involves the initial doubly data parallel read alignment stage. In section 2, we use data from the NIH database PubChem (Wheeler, et al., 2006) (PubChem project, 2009) that records properties of chemical compounds. Currently there are 26 million compounds, but in our initial studies we use random subsets of up to 100,000 compounds. We then use 166 binary properties to define the 166 dimensional vectors associated with each compound. In a follow up work we are using interpolation and other methods to extend analysis to the entire NIH dataset.
2 INNOVATIONS IN ALGORITHMS FOR DATA INTENSIVE COMPUTING 2.1 Visualization analysis by using parallel MDS and GTM Dimension reduction and follow-up visualization of large and high-dimensional data in low dimensions is a task of growing importance in many fields of data mining and information retrieval to understand data structures, verify the results of data mining approaches, or browse them in a way that distance between points in visualization space (typically 2D or 3D) tracks the one in original high dimensional space. There are several well understood approaches to dimension reduction, but they can be very time and memory intensive for large problems. In this section we discuss parallel algorithms for Scaling by MAjorizing a COmplicated Function (SMACOF) to solve Multidimensional Scaling (MDS) problems, and Generative Topographic Mapping (GTM). The former is particularly time consuming, with complexity that grows as square of data set size. However, it does have the advantage of not requiring explicit vectors for dataset points, but only the measurement of inter-point dissimilarities. We also present a comparison between MDS and GTM by using Canonical Correlation Analysis (CCA). Multidimensional Scaling (MDS): MDS (Kruskal & Wish, 1978), (de Leeuw, Applications of convex analysis to multidimensional scaling, 1977), (de Leeuw, Convergence of the majorization method for multidimensional scaling, 1988), (Borg & Groenen, 2005) is a technique for mapping generally highdimensional data into a target dimension (typically a low dimension L), such that each distance between a pair of points in the mapped configuration is an approximation to the corresponding given pairwise
proximity value as measured by a weighted least squares sum. The given proximity information is represented as an 𝑁 × 𝑁 dissimilarity matrix (Δ = 𝛿𝑖𝑗 , 1 ≤ 𝑖, 𝑗 ≤ 𝑁), where 𝑁 is the number of points (objects), and 𝛿𝑖𝑗 is the dissimilarity between point 𝑖 and 𝑗. The output of MDS algorithms can be represented as an 𝑁 × 𝐿 configuration matrix 𝑋, whose rows represent each data points 𝑥𝑖 (𝑖 = 1, … , 𝑁) in 𝐿-dimensional space. We are able to evaluate how well the given points are configured in the 𝐿dimensional space by using a least squares style objective functions for MDS, called STRESS (Kruskal J. , 1964) or SSTRESS (Takane, Young, & de Leeuw, 1977). Definitions of STRESS (2.1) and SSTRESS (2.2) are given in the following equations: 𝜎 𝑋 =
𝑤𝑖𝑗 𝑑𝑖𝑗 𝑋 − 𝛿𝑖𝑗
2
(2.1)
𝑖