Data Mining in Chemometrics: Sub-structures. Learning via Peak Combinations. Searching in Mass Spectra. Yu Tang1,2, Yi-Zeng Liang3 and Kai-Tai Fang1.
Journal of Data Science 1(2003), 481-496
Data Mining in Chemometrics: Sub-structures Learning via Peak Combinations Searching in Mass Spectra
Yu Tang1,2 , Yi-Zeng Liang3 and Kai-Tai Fang1 1 Hong Kong Baptist University, 2 Suzhou University and 3 Central South University Abstract: In this paper, a new approach of finding sub-structures in chemical compounds by searching peak combinations in mass spectra is given. Based on these peak combinations, further identification and classification methods are also proposed. As an application of these methods, saturated Alcohol and Ether are classified efficiently by using a variable selection method. Key words: Mass spectra, peak combination, sub-structure, variable selection.
1. Introduction Data mining (DM), also named knowledge discovery in databases (KDD) is an extraction of interesting (non-trivial, implicit, previously unknown and potentially useful) information or patterns from data in large databases (Han and Kamber 2001). It has been widely used in computer science, statistics, business management and biology, etc. Chemistry is an experiencedependent science. Most of the rules and disciplines obtained in this field come from chemical experiments and measurement data. With the growth of chemical measurement and modern information technology, more and more huge databases containing a large amount of chemical compounds information are established, such as the spectral databases, chromatographic 481
Y. Tang, Y.-Z. Liang and K.-T. Fang
databases, or databases on molecular structures and their properties. How to discover new information from such huge collections is a new challenge. In this paper, we wish to explore new knowledge from a mass spectral library, especially, we investigate sub-structures in different chemical compounds. By comparing large amount of compounds stored in the mass spectral library, we can define a certain peak combination that represents the character of a certain sub-structure. As long as these connections between peak combinations and sub-structures are established, further investigations can be carried on. As an example, saturated Alcohol and Ether can be classified efficiently by using a variable selection method. All the data used in this paper are taken from the same mass spectral library as in Liang and Gan (2001). It was established by transferring NIST62 mass spectrum library, which is built in the GCMS-QP5000 of Shimadzu. The paper is organized as follows. Section 2 introduces the method for finding sub-structures by searching peak combinations in mass spectra. Three case studies are demonstrated in Section 3. The last section gives some discussion. 2. Method for Sub-structure Discovering 2.1 Concept of peak combination Mass spectrum is one of the most important spectra in Chemometrics. It can identify different chemical compounds by showing different spectral skeleton. But, generally speaking, how to identify efficiently or how to classify different compounds by the analysis of mass spectra is still an open problem as up to now more than 23,400,000 chemical compounds have been found. In the past decades, many authors have used the values of single peaks as variables to identify or classify different chemical compounds, see, for example, Gan et al. (2001). However, different peaks occurring in the mass spectrum should not be regarded as independent with each other. In fact, many series of peak combinations in mass spectrum are always relevant, as it will be seen in the later discussion. In Werther et al. (1994) and Werther et al. (2002), the authors proposed some vari482
Sub-structures Learning in Mass Spectra
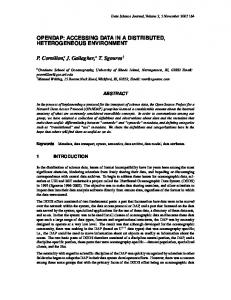
ables representing the character of the compounds based on the peak values of the origin mass spectra. Many features (transformations), such as “Modulo-14-features”, “Autocorrelation features”, “Logarithmic intensity ratios” and “Spectra type features” have appeared in the literature. Especially, the feature “characteristic peak series” presented in Werther et al. (2002) shows some prior information of sub-structure contained in the compounds. They used three peak combinations, that is, peak values of 64-65-66-90, 28-55-82-109 and 45-59-73-87-101 to identify the existence of sub-structures “nitrogen-substituted pyrimidine”, “[(HCN)1−4 + H]+ ” and “[Cn H2n−1 O2 ]+ ”, respectively. How to select more of such characteristic peak combinations is the motivation of the present paper. Mass spectrum is a stick diagram which records the abundances of different ions broken from the vaporized organic molecular after its being bombarded by a stream of electrons. Firstly the organic molecular is to become an energetically unstable molecular ion, and then the molecular ion is subsequently broken into a host of particles. Among them, those fairly larger and unstable particles continue to be broken into smaller ones. During the fragmentation, the charged particles will be accelerated, deflected and detected by the mass spectrometer and finally be recorded in the mass spectrum. Figure 1 is a typical mass spectrum of Heptane.
Figure 1: The Mass Spectrum of Heptane
From the formation of the mass spectra, we see that each charged parti483
Y. Tang, Y.-Z. Liang and K.-T. Fang
cle during the fragmentation may leave a line in the mass spectra and these series of particles are produced step by step. Thus, when two compounds contain a common sub-structure, same particles may have chances to appear during the fragmentation and their “trace” will be recorded in the mass spectra. If we check large amount of known compounds in the library, we can select certain position combinations occurring together most frequently in the mass spectra. Tabulating these position combinations in a file, we browse the database again and compare the performance of different compounds on each fixed position combination. We can select certain position combinations on which some of compounds perform the same behavior, i.e. their mass spectra share similar peak values on the corresponding position combinations. We call such a position combination a peak combination. And those compounds are called models. Then we will draw a conclusion that all models on a peak combination belong to the same class in the sense of their existing a common sub-structure. So roughly speaking, a peak combination in mass spectra corresponds to a sub-structure in compounds. In this way, the spectrum-structure information can be established. Two types of peak combinations are defined as follows. The first type is called “subsequential type”. It refers to such peak combinations that are formed by recording a series of subsequential ions from big to small. In the mass spectrum, it has the character of the following properties: a. different positions in such peak combinations scattering far from each other; b. each position with higher abundance. Another type is called “cluster type” that is typically formed by losing several small particles from a definite ion fragment and has the following properties: 1. the positions of these peak combinations occurring together in an area of mass spectrum, constituting a cluster of a family; 2. at least one of the abundance of different positions should be higher, but some can be fairly low. As showed in Figure 1, 71-57-43-29 can be regarded as the subsequential type, while 26∼29, 39∼44, and 53∼58 can be regarded as the cluster type. 2.2 Data set construction 484
Sub-structures Learning in Mass Spectra
As stated in Subsection 2.1, we establish a data file which records the position combinations frequently occurring in the mass spectral library. It will be used for the later comparison. Corresponding to the two types of peak combinations defined above, we adopt two strategies to search them in the mass spectral library. For the subsequential type, we list all the peak positions with their abundance above a threshold for each selected sample. Then from these positions we select their combinations most frequently occurring in the same mass spectra, say, the frequency ratio of their occurrences together in the total samples is above 10%. For a typical mass spectrum, it always has several scores of peaks, sometimes even more than one hundred. So when the mass spectral library is large enough, it is a hard task to list all these position combinations. In our program, instead of listing all these position combinations, a random selection method is used. That is, we randomly select certain position combinations whose single peak positions occur frequently, then record those position combination whose occurrences in the mass spectra library as a whole are above the threshold value. Though this substitution may leave out many characteristic peak combinations, it might explore some interesting results in our experiment, where the number of selection time is set to be a fairly large number, for example, 100,000 times. For the cluster type, we record all the successive positions with definite length which most frequently occur in the database. Here we admit of at most one zero value among these positions. For example, if we set fixed length five, and many compounds have non-zero values on 41-42-43-45, then we also regard 41∼45 as a position combination. From now on, the data set is constructed by the above method. 2.3 Sub-structure learning It should be emphasized that the position combinations in the data set are not necessary to link to certain sub-structures existed in compound. However, if a certain sub-structure does exist in some compounds, it may leave some information related on these position combinations. Given a compound, whether it is in the library or not, we can compare its 485
Y. Tang, Y.-Z. Liang and K.-T. Fang
values on all the recorded position combinations with those of compounds listed in the library. If there are some compounds in the library share similar values on a certain position combination with the given compound, we can pick out these compounds. As stated in Subsection 2.1, such position combination is now defined as a peak combination and will link to a certain sub-structure, while these compounds are treated as models. In the program, we use two similarity indices for the behavior of two compounds on each of these peak combinations. The first one is the correlation coefficient. Denote A = {a1 , a2 , · · · , an } and B = {b1 , b2 , · · · , bn } the corresponding value vectors on n-peak combination of two compounds, respectively. The correlation coefficient between A and B is defined as follows: n �
(ai − a)(bi − b)
i=1
ρ= � n �
�
(ai − a)
2
i=1
n � (bi − b)2
,
i=1
1� ai where a and b represent the mean of A and B, respectively, i.e., a = n i=1 n 1� and b = bi . The second one is called coefficient of variation (CV ): n i=1 n
� � � CV = �
1 � (Ri − R)2 n − 1 i=1
where Ri =
n
� R,
ai , i = 1, 2, · · · , n, bi
1� and R = Ri represents the mean of Ri . It is obvious that if some bi n i=1 equals zero while the corresponding ai is a non-zero value, then compound A and B must not share the common behavior on this peak combination, so we terminate the process. The two criteria can frequently be seen in the n
486
Sub-structures Learning in Mass Spectra
literature, we use both of them for comparison. The threshold values of the two criteria can be fairly arbitrary. Generally speaking, they don’t affect the result much. In Case Study II in Section 3, they are set to be 0.99 and 0.15 in the program, respectively. However, when the sample size is not so large, as it will be showed in Case Study I, they are set to be 0.99 and 0.25. And when we want to get more peak combinations for later identification and classification, as in Case Study III, they can be set even looser. Before ending this section, we summarize the whole procedure for searching peak combinations from mass spectra into the following steps: Step 1:
Step 2:
Step 3:
Step 4: Step 5:
According to the two types of peak combination, use two corresponding ways of searching methods introduced in Subsection 2.2 to list position combinations. For each position combination found in step 1, select a compound in the library, and calculate two similarity indices between the other samples with the one selected. Record the samples whose correlation coefficient is above the bound and whose coefficient of variation is below the bound. Check these samples whether they share a common sub-structure. If so, then regard the position combination as a peak combination. And these samples with satisfied similarity indices are recorded as models. Iterating step 2 and 3 after all the samples are selected for comparing. Iterating step 2, 3 and 4 after all the position combinations in step 1 are tested.
3. Case Studies In this section, three case studies are investigated and show that the peak combination approach is very useful in data mining. Case Study I. We use 34 saturated Alcohol and Ether with molecule weight 102. Using the searching method in Subsection 2.2 and 2.3, we 487
Y. Tang, Y.-Z. Liang and K.-T. Fang
find several peak combinations in Table 1 which seem to represent the substructure CH3 CH(OH)− existed in compounds (in this paper, the Index means the serial No. in NIST62). Table 1: Peak combinations in the first experiment Index (Model) −− 1769 1773 1777 1792 1794
Value of peaks
Molecular formula
27 29 41 44 45 7.2 7.2 13.6 6.8 100.0 8.8 7.2 18.0 6.8 100.0 11.6 14.0 19.2 11.6 100.0 8.0 7.6 15.6 6.0 100.0 8.0 8.4 15.2 6.8 100.0
CH3 (CH2 )3 CH(OH)CH3 CH3 CH(CH3 )CH2 CH(OH)CH3 CH3 CH2 CH(CH3 )CH(OH)CH3 CH3 (CH2 )3 CH(OH)CH3 CH3 (CH2 )3 CH(OH)CH3
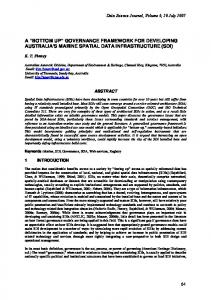
Figure 2: Results selected from 8000 compounds
Here We find that No. 1769, 1792 and 1794 have the same peaks pattern, it is not surprise as they share the same molecular formula CH3 (CH2 )3 CH(OH)CH3. 488
Sub-structures Learning in Mass Spectra
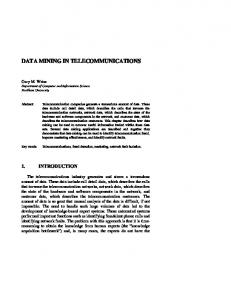
We also check the above rule in the whole library. For each compound in the library, we compared it with the selected models in the rule, that is, calculate the ρ and CV on the position combination 27-29-41-44-45. If the average of ρ and CV are greater than 0.9 and 0.25, respectively, we claim that the compounds contain the sub-structure CH3 CH(OH)−. Figure 2 lists the compounds it finds from serial No. 5501 to 13501. Most of them contain sub-structure CH3 CH(OH)− in deed. What should be pointed out is that the base peak 45 seems much more important. However, in all the 34 samples, there are five types of Ether with base peak 45 listed in Figure 3. Single peak value may mix up all of these substances. We distinguish them by using peak combinations.
Figure 3: Ether in 34 samples with base peak 45
Case Study II. We use all single alkene and cycloparaffinic hydrocarbons in the library and altogether there are 693 compounds. Similar to Case Study I we only list the result peak combinations in Table 2. Case Study III. This is the most interesting one. As we know, it is a difficult task to distinguish whether a compound is Alcohol or Ether due to their similar properties. In this experiment we will present an efficient way to distinguish these two classes by using peak combinations. We select all saturated Alcohol and Ether in the library. Altogether there are 375 samples, with 295 types of Alcohol and 80 types of Ether. We use half of them, i.e. all the even order in the 375 samples sorted by the 489
Y. Tang, Y.-Z. Liang and K.-T. Fang
Table 2: Peak combinations in the second experiment Index (Model) −− 18491 21972 25488 28779 34426 −− 28772 28776 34414 34415 34422 39519 −− 28770 31652 34421 34423 37069 −− 31650 31651 31652 34420 34421 37067 37071 50827 50829 −− 4653 4664 4674 11059 11074 11081
Value of peaks 54 55 57 67 68 111 14.80 81.60 60.00 12.00 12.80 15.20 15.60 80.40 60.40 12.80 13.60 15.60 14.80 84.80 66.00 13.60 14.00 19.20 16.40 91.60 66.00 15.20 14.40 24.40 15.20 88.40 71.60 14.00 14.40 22.40 29 67 82 83 84 111 29.20 20.40 16.80 66.40 32.40 22.40 24.00 14.80 12.00 51.60 24.00 15.20 30.40 19.60 18.80 72.80 31.60 26.80 23.20 14.40 13.20 54.80 21.20 17.20 34.80 20.40 16.40 77.20 28.80 22.40 31.60 21.20 20.00 84.80 30.00 29.20 43 55 82 97 111 73.20 100.00 65.60 58.80 26.00 73.20 90.80 61.60 52.80 21.20 66.00 84.80 61.60 50.80 20.00 67.60 82.80 58.00 51.20 25.20 62.40 74.40 59.60 50.40 19.60 53 54 55 56 57 58 3.60 8.40 97.20 25.20 100.00 3.60 3.60 7.60 87.60 18.00 93.20 3.60 3.60 8.00 90.80 18.00 100.00 3.60 3.20 7.20 85.60 17.20 91.20 4.00 3.20 8.00 84.80 19.60 100.00 3.60 4.00 9.20 87.60 22.40 98.00 3.60 3.20 7.60 77.60 16.40 100.00 3.60 3.60 10.00 96.80 22.00 95.20 4.00 3.60 10.00 98.40 23.20 100.00 4.40 50 51 52 53 54 55 56 2.00 4.40 2.80 14.40 15.60 100.00 56.00 2.00 4.80 2.80 16.00 16.00 100.00 57.60 1.60 4.00 2.40 13.60 13.60 100.00 61.20 1.60 3.60 2.40 14.40 14.80 100.00 60.00 1.60 3.20 2.00 12.00 12.40 62.00 47.20 2.00 4.00 2.80 15.20 14.80 93.60 62.40
Possible Sub-structure
CH2 = CH−
−CH = CH−
K6 − CH