Data Mining on Temporal Data: a Visual Approach and its ... - CiteSeerX
Recommend Documents
The goal is to discover hidden patterns, unexpected trends or other subtle .... containing hand or head gestures are classified according to the actions they represent or the .... When the sequences consist of symbolic data we have to define dissimil
ABSTRACT. Computer Aided Software Engineering (CASE) consists of a set of tools that ..... male (see Table 2) and almost half of all students had one to five years of work ..... He received a Doctor of Science degree in Computer Science from.
Map, Customer Requirements in the HOQ are mapped to application requirements expressed as classes in data mining. Technical Requirements in HOQ are ...
3 VidaMine is an acronym for VIsual DAta MINing Environment. S. Kimani et al. .... The GUI container provides various services to the Data Mining system.
Visual Data Mining from Visualization to Visual Information Mining .... SpectraMiner, an interactive data mining and visualization software for single particle mass.
B ã95%, U10,15ã. r1 expresses that if an event of type A occurs at time t, then, an event of type B will occur between t + 10 and t + 15 with 95% chance. Example ...
Temporal Data Mining is a single step in the process of Knowledge Discovery in Temporal Databases that enumerates structures (temporal patterns or models).
Temporal Data Mining for Educational Applications. Carole R. Beal & Paul R. Cohen. Information Sciences Institute, University of Southern California.
Christine G. Minetou, Sherry Y. Chen, and Xiaohui Liu. School of Information Systems, ...... Orengo, D Jones and J Thornton (eds). p. 229-244. Mavis, B. (2001).
Keywords: Predicting Admission, Medical Studies, Data Mining, Knowl- ... selection process that is for one part determined by the government and for another by ...
rapidminer." 2008 Second International. Conference on. Future. Generation ... [18] A Tutorial on Clustering Algorithms, http://home.dei.polimi.it/matteucc/Clusteri.
transaction flows from (potentially obscure) monitor- ing events produced by ... servers can be done automatically by monitoring tools. ..... We then apply best-first.
servers can be done automatically by monitoring tools. Unfortunately, our ..... in a IBM BladeCenter and run Windows Server 2003. The entire distributed system ...
of solution quality, scale well with the data size, and are robust against noises in ..... mapping is an one-to-one mapp
machine learning can be exploited for data mining purposes and more ... KDD involves, as well as data mining, a previous process of data selection and ...
base of images in a context of Automated Visual Inspection (AVI). AVI is the field .... In particular from a computer vision point of view, a crack can be defined as a ...
Data Mining is the search for valuable information in large volumes of scientific or business data. It combines the fields of Databases and Data Warehousing with.
SGI describes customers for its data visualization software package from ..... A graph layout L is a tuple (G, P) where G = (V, Ec, Ev, Ð, w,A) is a visualiza- tion graph .... ed as a heuristic for Principle Component Analysis, see [42]) and Multi-
Other approaches, such as Treemaps [17] and CHEOPS [7], are well-known 2D techniques which use available screen space very effectively. The visualization ...
In European Project Space on Intelligent Technologies, ..... the significance test in all scores of the method against MRU and SUPRA ..... ranking answers (objects, attributes) instead of documents (sometimes also called entity or .... to build the t
Temporal Data Mining, Temporal Rules, Temporal Patterns,. Spatial Data Mining .... Warehousing and Data Mining, DWDM'98. Y. Kambayashi,. D.K. Lee, E.-P.
forms of interactive data mining, roles, requirements, as well as complex- ities of interactive data mining systems are discussed in this paper. 1 Introduction.
temporal, or spatial data, to the best of our knowledge no data mining query ... application point of view, where the moving object has stayed for a minimal ...
and summary of large amounts of raw data. We suggest the application of temporal data mining mainly to time intervals of temporally abstracted data, instead of ...
Data Mining on Temporal Data: a Visual Approach and its ... - CiteSeerX
a Visual Approach and its Clinical Application to Hemodialysis. Luca Chittaro1, Carlo ... Data mining applications can thus play a crucial role in this context. More.
PREPRINT VERSION The published article appeared in: Journal of Visual Languages and Computing, vol. 14, no. 6, December 2003, pp. 591-620.
Data Mining on Temporal Data: a Visual Approach and its Clinical Application to Hemodialysis Luca Chittaro1, Carlo Combi2, Giampaolo Trapasso1 1
HCI Lab, Dept of Math and Computer Science, University of Udine, via delle Scienze 206, 33100 Udine, Italy [email protected]
2
Department of Computer Science, University of Verona,
The quantity and complexity of data acquired, time-stamped and stored in clinical databases by automated medical devices is rapidly and continuously increasing. As a result, it becomes more and more important to provide clinicians with easy-to-use interactive tools to analyze huge amounts of this data. This paper proposes an approach for visual data mining on temporal data and applies it to a real medical problem, i.e. the management of hemodialysis. The approach is based on the integration of 3D and 2D information visualization techniques and offers a set of interactive functionalities that will be described in detail in the paper. We will also discuss how the system has been evaluated with end users and how the evaluation led to changes in system design.
2
1 Introduction
The quantity and complexity of data acquired, time-stamped and stored in clinical databases by automated medical devices is rapidly and continuously increasing. As a result, it becomes more and more important to provide clinicians with easy-to-use interactive tools to analyze huge amounts of this data [6]. These tools would serve different purposes, such as supporting clinical decision making, evaluating the quality of the provided care, and carrying out medical research.
Some techniques for visual data mining (VDM) of multidimensional clinical databases are illustrated in [10]. They are mainly based on 3D versions of parallel coordinate plots. Graphical connections between points in adjacent planes are drawn in such a way that each patient's case is visually represented by a line connecting individual points referring to it. This allows for VDM of interesting patterns (e.g., a group of patients with the same profile results in parallel lines).
A different approach is presented by [19] and is based on tables displaying records and their attributes in highly compressed format such that they fit onto the screen. Users directly manipulate the table (e.g., performing zoom and filter operations) that dynamically rearranges itself. To compress the tables, the system relies on visualization criteria such as (i) neighboring cells with identical values are combined into a larger cell, or (ii) if there is no space to display a numeric value in its cell, the value is substituted by a small horizontal line whose position indicates relative size.
In our research, we aim at exploring a third possibility based on bar charts, focusing on clinical databases containing time-series data. Bar charts and other standard visualizations of time-series data have the advantage of being very familiar for clinicians and thus they do not need to be learned. However, while they effectively support the analysis of a single time-series or a collection of a few time-series, they are not 3
suited to support more complex task that involve collections of many time-series: among them, we mention here situations where time-series for different patient’s parameters are simultaneously acquired, there is more than one temporal dimension involved, and there is the need for user-defined real-time operations on large amounts of displayed data.
Although novel approaches to time-series visualization have been recently proposed (e.g., drawing the timeline along spiral structures [22]), we preferred to adopt bar charts as the building blocks of our visualizations. Indeed, familiarity emerged as an important requirement in the first attempts we made at proposing a visual data mining tool to clinicians: proposals based on novel visualizations received unfavorable feedback from clinicians, and it was clear that they were extremely unlikely to be adopted in clinical use.
The specific clinical context we are working in is the domain of hemodialysis, where clinicians have to deal with huge amounts of data automatically acquired during the hemodialytic treatment of patients suffering from renal failure (a medium-sized hemodialysis center collects about 228 millions of patients’ parameter values per year). Data mining applications can thus play a crucial role in this context. More specifically, visual data mining applications are of particular interest for three main reasons.
First, clinicians’ abilities in recognizing interesting patterns are used suboptimally or not used at all in the current context. VDM of hemodialytic data would allow clinicians to take decisions related to different important aspects such as: •
Therapy: personalizing the individual treatment of specific patients;
•
Management: assessing and improving the quality of care delivered by the whole hemodialysis center;
•
Medical research: discovering relations and testing hypothesis in nephrology research.
Second, since data mining on the considered database is (at least, at initial stages) intrinsically vague for clinicians, the adoption of VDM techniques can be more promising than fully automatic techniques, because
4
it supports clinicians in discovering structures and finding patterns by freely exploring the datasets as they see fit.
Third, the clinical context is characterized by a need for user interfaces that require minimal technical sophistication and expertise to the users, while supporting a wide variety of information intensive tasks. A proper exploitation of visual aspects and interactive techniques can greatly increase the ease of use of the provided solutions.
In summary, a clinical VDM system has to achieve two possibly conflicting goals: (i) offering powerful data analysis capabilities, while (ii) minimizing the number of concepts and functions to be learned by clinicians. From this point of view, very general VDM systems which offer several hundreds different options (to achieve the first goal) are unlikely to be adopted in a clinical context (because they do not take into account the second goal). In designing our system, we thus worked closely with clinicians to identify a minimal set of functions and options that could allow to easily perform the needed data analysis tasks, and we also had to design an interface that could make the identified set of functions and options very easy to use. Working closely with the clinical end users allowed us to iteratively refine the system and its functionalities (a very preliminary prototype was described in [7]). In the following, we will present the final version of the system.
The paper is organized as follows. Section 2 briefly introduces the real-world clinical context we are working in. Then, Section 3 illustrates the system we have built and its main features. In Section 4, we show some practical examples of how the system is being applied on the considered clinical database. Section 5 describes how we proceeded in the evaluation of our system in a medical setting. Section 6 discusses in detail the most recent improvement to the system, aimed at integrating 3D bar charts with 2D parallel coordinate plots. Finally, Section 7 contains some concluding remarks.
5
2 The Hemodialysis domain
Hemodialysis is the widely used treatment for patients with acute or chronic end-stage renal failure. During an hemodialysis session, patient’s blood is circulated through a machine that eliminates metabolites (e.g., urea), re-establishes the acid-base equilibrium, and removes water in excess. The “cleaned” blood is then returned to the patient’s bloodstream. In general, hemodialysis patients are treated 3 times a week and each session lasts about 4 hours.
Unfortunately, the number of patients that need hemodialysis is constantly increasing [21]. A mediumsize hemodialysis center can manage up to 60 patients per day, i.e. more than 19000 hemodialytic sessions per year. The treatment is very costly and extremely demanding both from an organizational viewpoint [14] and from the point of view of the patient’s quality-of-life. In this scenario, it is very important for clinicians to be able to evaluate the quality of (i) each single hemodialysis session, (ii) all the sessions concerning the same patient, and (iii) sets of patient sessions concerning a specific hemodialyzer device or a specific day, for the early detection of problems in the quality of the hemodialytic treatment.
Modern hemodialyzers are able to acquire up to 50 different parameters from the patient (e.g., heart rate, blood pressure, weight loss due to lost liquids, …) and from the process (e.g., pressures in the extracorporeal circuit, incoming blood flow, …), with a configurable sampling time, whose lower bound is equal to 1 sec. As an average example, considering only 25 parameters with a sampling time of 30 seconds, 12000 values (4*120*25) are collected in each 4-hours session, and a medium-sized center collects more than 228 millions of parameter values per year (considering 19000 provided treatments).
While the daily accumulation of huge amounts of data prompts the need for suitable techniques to detect and understand relevant patterns, current hemodialysis software is more concerned with acquiring and storing data, rather than visualizing and analyzing it.
6
3 The Proposed Approach
The system we have built, called IPBC (Interactive Parallel Bar Charts) connects to the hemodialysis clinical database, produces a visualization that replaces tens of separate screens used in traditional hemodialysis systems, and extends them with a set of interactive tools that will be described in detail in this section.
As previously anticipated, the visualizations we employ are based on bar charts. Historically, bar charts are a widely adopted approach to display time-series [20]. Unfortunately, while a bar chart allows for an easy comparison among the data values of a single time-series, when the considered task requires to compare a collection of time-series (such as a monitored signal from the same patient in different sessions of the same clinical treatment), traditional bar charts (as other historical approaches) become unfeasible.
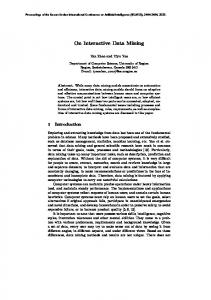
In IPBC, we visually represent each time-series in a bar chart format where the X axis is associated with time and the Y axis with the value (height of a bar) of the series. Then, we layout the obtained bar charts side by side, using a third axis to identify the single time-series, and we draw them in a 3D space, using an orthogonal view. It must be noted that also the additional axis has typically a temporal dimension, e.g. it is important to order the series by date (of the hemodialysis session) to analyze the evolution of the state of a patient. An example is shown in Figure 1, that illustrates a visualization of 45 time-series of about 290 values each, resulting in a total of more than 13000 values (the axis on the right is the time axis, while the axis on the left identifies and orders the different time-series). Hereinafter, we refer to this representation as a parallel bar chart.
While a 3D space can significantly increase both the number of time-series that can be simultaneously analyzed in a convenient way and the number of values associated with each time-series, it poses wellknown problems such as occlusions, 3D navigation, difficulties in comparing heights, proper use of space, and the need for effective interaction techniques to aid the user in the analysis of large datasets (e.g., highlighting interesting patterns, checking trends,…). The limited capabilities of commercial tools that generate 3D bar charts have led well-known researchers [18] to classify the generated visualizations as 7
“chartjunk 3-D”. However, solutions to the problems of 3D bar charts are emerging from research: e.g., Cichlid offers temporal animation capabilities of 3D stacked bar charts [3], while ADVIZOR allows one to interactively link the 3D bar chart representation with related 2D representations, compare heights with a “water level” plane (perpendicular to the bars) and use filtering tools [8,9].
IPBC integrates some of these ideas with novel ones to provide an environment that aims at being easy to use and effective for clinicians. While we use a basic form of 3D bar charts common to several commercial tools, the novelty of IPBC lies in several interface refinements and interaction techniques we propose, as detailed in the following sections.
3.1. The RoundToolbar widget
In designing how the different interactive functions of IPBC should be invoked by the user, we wanted to face two different problems: •
First, one well-known limitation of many 3D visualizations is the possible waste of screen space towards the corners of the screen;
•
Second, an approach based on traditional menus would require lengthy mouse movements from the visualization to the menu bar and vice versa, for the interactive analysis of the data.
For these reasons, we designed a specific round-shaped pop-up menu (see Figure 2), called RoundToolbar (RT), that can appear anywhere the user clicks on the screen with the right mouse button. The RT can be easily positioned in the unused screen corners, thus allowing for a better usage of screen space (e.g., see Figure 1) and a reduction of the distance between the visualization and the menu. Moreover, to further improve the selection time of functions with respect to a traditional menu, the organization of modes in the toolbar is inspired by Pie Menus [4]: in particular, the modes are on the perimeter of the RT, and when a mode is selected, the corresponding tools appear in the center of the RT and are immediately reachable by the user, who can also quickly switch back from the tools to a different mode.
8
In general, pie menus are better than linear menus if we consider the time spent to locate any item in the menu, but they can potentially waste more space: it is worth noting that, in our case, the RT allows one to exploit the available space towards the corners of the screen, while linear menus would be less suited to this purpose.
The RT modes belong to two different categories: the four modes in the upper half of the RT (Hide, Groups, View, 2D/3D) allow the user to choose how bar charts are viewed, while the four modes in the lower half (Query, Match, Animate, Tide) provide different kinds of visual exploration tools. Users can combine a mode in one category with a mode on the other one, by choosing them independently. The system highlights what is the currently selected exploration tool by means of a red line in the contour of the selected mode. For example, in Figure 2 the user has just chosen the View mode in the upper half of the RT (the corresponding controls are available in the center of the RT), and the red line in the contour of the lower half of the RT (i.e., the lightly colored part of the contour in the Figure) indicates that the Query mode is currently selected for exploring data. In the following, we first go through the different visualization tools and then we focus on data exploration tools.
3.2. Changing Viewpoint
It is well-known that free navigation in a 3D space is difficult for the average user, because (s)he has to control 6 different degrees of freedom and can follow any possible trajectory. To make 3D navigation easy in our case, when the View mode is selected in the RT (as in Figure 2), the proposed controls for viewpoint movement (Rotate, Near-Far and High-Low, positioned in the upper part of the central panel of the displayed RT) cause movement along limited pre-defined trajectories which can be useful to examine the visualization: in particular, Figure 3 shows how viewpoint movement is constrained, by illustrating the movement of the virtual camera that determines the viewpoint: Figure 3a shows the trajectory followed by the High-Low control (a position between 0 and 90 degrees); Figure 3b refers to Rotate (a position between
9
0 and 359 degrees); Figure 3c refers to Near-Far (how a zoom-in/zoom-out effect on the visualization is obtained). Other three controls (Slide, Vertical scale, Center) are positioned in the lower part of the central panel of the RT in View mode, as shown in Figure 2. The Slide control simply allows the user to place the entire visualization in a specific screen position: to do so, she has to drag the circle within the widget in the desired direction. The Vertical scale control is used to scale the bars on the Y axis. Vertical scaling has been included in the View mode, because it has been observed that when users scaled the bars, their typical subsequent operation was to change the viewpoint. Finally, the Center button is used to restore the default viewpoint position which points to the middle of the bar chart visualization at a suitable distance (as in Figure 1).
3.3 Temporally Grouping Data
When the time-series are generated from a high frequency sampled signal or, more generally, when the user wants to temporally aggregate data to obtain a more abstract view, she can use the Groups mode of the RT. In this mode, bar charts display the result of an aggregation function applied to raw data. In the current version of IPBC, aggregate functions allow one to visualize the mean of parameter values grouped over intervals of a given duration. Dynamic queries, as well as the other exploration tools (described in Sections 3.6 through 3.9), can obviously be applied also to these abstract data. Figure 4 shows a visualization obtained after applying the mean function over intervals of 30 minutes to the dataset of Figure 1.
Another option (Group by values) allows the user to visually identify groups of consecutive samples with the same value. In this way, the clinician can easily distinguish for any session the parts which are varying from those which are stationary over some time interval (see Figure 5). Although the set of available aggregate functions can be easily extended, it is interesting to note that the mean is the only function that was specifically requested by clinicians during the evaluation of preliminary versions of the system.
10
3.4. Managing Occlusions
As any 3D visualization, IPBC can suffer from occlusion problems. To face them easily, the system offers several possible solutions.
First, by using the 2D/3D mode on the RT, the user can transform the parallel bar chart into a matrix format and vice versa. For example, Figure 6 shows the same data as Figure 1 in the matrix format. The transformation is simply obtained by automatically moving the viewpoint over the 3D visualization (and taking it back to the previous position when the user deselects the matrix format). This can solve any occlusion problem (and all the exploration tools can still be used on the matrix cells), but the detailed information given by the height of the bars is lost, although only partially (some is retained through the color coding mechanism that will be explained in Section 3.6). Transitions to matrix format and back are animated to avoid disorienting the user and allow her to keep her attention on the part of the visualization she was visually focusing on.
Second, the 2D/3D mode offers a Collapse series function to get a partial flattening of the IPBC. When the user clicks on a specific time-series (which can possibly occlude an interesting one), the bar chart for this series and all the possibly occluding ones are collapsed (through a smooth animation) into a flat representation analogous to the matrix one, as illustrated in Figure 7. When the user selects a flat bar chart, all the flattened bar charts between the considered one and the first non-flat bar chart are raised up.
Third, the 2D/3D mode offers a Collapse function to obtain a flattening of every bar that can possibly occlude a chosen bar: this typically results in a flattening of portions of the series, as shown in Figure 8. With this function, users can also collapse the portions of any series before a given time, allowing for an easy comparison of time-series at the same instant of time.
11
3.5. Hiding Options
The Hide mode allows the user to display/hide some auxiliary information for parallel bar charts. As depicted in Figure 9, the user can display/hide: (i) the grid on the plane identified by the time axis and the axis for time-series, (ii) the result of each hemodialysis. This is a logical value which allows one to distinguish between successful and unsuccessful sessions: it is evaluated by considering a combination of parameters, such as the systolic and diastolic blood pressures (measured on the patient) and the blood flow (QB) entering the hemodialyzer. The equations needed to compute the value are available from the medical literature (see, e.g. [2]). Successful sessions are visually identified by a filled green circle displayed at the beginning of the corresponding bar chart, while unsuccessful sessions are identified by a filled red circle (Figures 9 and 10 show where and how the circles are displayed). (iii) the clinical events that (possibly) occurred during each hemodialysis. Clinical events are related either to the intervention of the clinical staff during a session (due, for example, to problems with the patient comfort or health conditions) or to some unexpected patient’s action; they are displayed as blue signs on top of bar charts in the correct position, according to the session and the time instant of the event occurrence. Moreover, the user can hide (and then re-display) some selected time-series of her choice (Hide selected series). Finally, she can display time-series with a variable space between each pair of consecutive timeseries by using the Space between series control (an example is shown in Figure 10).
3.6. Dynamic Queries
IPBC uses color to classify time-series values into different ranges. In particular, at the beginning of a 12
session, the user can define her general range of interest for the values, specifying its lowest and highest value (e.g., 0 and 250 mmHg for a pressure). These will be taken as the lower and upper bounds for an IPBC dynamic query control (shown in Figure 11) that allows the user to interactively partition the specified range into subranges of interest. Different colors are associated to the subranges and when the user moves the slider elements, colors of the affected bars in the IPBC change in real-time. For example, Figure 1 shows a partition that includes the three subranges corresponding to the colors shown by the slider in Figure 11. Possible values outside the specified general range of interest are highlighted with a proper single color and (optionally) the corresponding bars are reduced to a zero height (this feature is tipically used by clinicians to highlight values which are physiologically impossible and are due to measurement errors, e.g. due to patient’s movements or to disconnected or malfunctioning sensors). The entire color coding scheme can be personalized by the user. The dynamic query control allows the user to: •
Move the two slider elements independently (to change the relative size of adjacent subranges). For example, in Figure 11, one has been set to 140 mmHg and the other to 180 mmHg. This can be done both by dragging the edge of the subrange or (more easily) the tooltips which indicate the precise value. Up and down arrow signs in the tooltips also allow for a fine tuning of the value.
•
Move the two slider elements together by clicking and dragging the area between the two bounds. This can be particularly useful (especially when the other areas are associated to the same color), because it will result in a “spotlight” effect on the visualization: as we move the internal area, our attention is immediately focused on its corresponding set of bars highlighted in the visualization.
Although it would not be difficult from a technical point of view to offer a dynamic query control with more than three variable subranges, it is interesting to note that the proposed organization into 4 categories of values (the 3 variable subranges inside the general range, plus the out-of-general-range category) was the one considered most useful by clinicians (introducing more subranges would thus only make the system more complicated and difficult to use for the intended end users).
3.7. Comparing data with (time-varying) thresholds
A frequent need in VDM is to quickly perceive how many and which values are below or above a given threshold. This can be easily done with the previously described dynamic queries when the threshold is 13
constant. However, the required threshold is often time-varying, e.g. one can be interested in knowing how many and which values are not consistent with an increasing or decreasing trend. For this need, IPBC offers a mode based on a tide metaphor. As it can be seen in Figure 12, the Tide mode adds a semitransparent solid to the visualization: the solid metaphorically represents a mass of water that floods the bar chart, highlighting those bars which are above the level of water. The slope of the top side of the solid can be set by moving two tooltips in the RT (that respectively specify the initial and final values for the height of the solid), thus determining the desired linearly increasing or decreasing trend. The height of the solid can be changed without affecting the slope by clicking and dragging the blue area in the RT. An opaque/transparent control allows the user to choose how much the solid should hide what is below the threshold. When the Tide mode is activated, all the bars in the user’s range of interest are turned to a single color to allow the user to more easily perceive which bars are above or below the threshold; if multiple colors were maintained, the task would be more difficult, also because the chromatic interaction between the semitransparent surface and the parts of bars inside it would add new colors to the visualization.
The Tide mode can be also used to help compare sizes of bars by selecting a zero slope and changing the height of the solid (in this special case, Tide becomes analogous to the “water level” function of other systems [8,9]). Figure 12 illustrates this latter case, while Figures 14 and 15 show a positive slope case.
Implementing a non-linear Tide would be relatively straightforward. Our restriction to linear trends is again the result of focusing the design of the system on a specific class of users and applications, avoiding features that would only make the system more difficult to use without increasing its practical usefulness.
14
3.8. Pattern Matching
When the user notices an interesting sequence of values in one of the time-series, IPBC offers her the opportunity to automatically search for and highlight occurrences of a similar pattern in all the visualization (a detailed example will be discussed in Section 4.4).
The user selects her desired sequence of values in a time-series by simply dragging the mouse over it, then she can specify how much precise the search should be, by indicating a tolerance value in the RT: the value specifies how much a pattern can differ in percentage from the given pattern.
Several pattern matching techniques could be exploited to perform this task: in designing the algorithm used in IPBC, we first considered the well-known approach for querying similar time-series [11,16], that is based on the Discrete Fourier Transform (DFT) of time-series and on the estimate of the distance between the DFT of the selected sequence of values and the DFT of subparts of the time-series to be considered. Suitable data structures for time-series data allow for a fast matching [11]. Then, we moved to an approach that is especially suited for short patterns (as that highlighted in Figure 17) to be matched on the time-series: in [17] a SQL-like query language named SQL-TS (Simple Query Language for Time-series) is proposed with specific constructs for defining sequential patterns to match against the time-series database. Efficient algorithms for evaluating these search queries have also been designed and experimented [17]. According to the SQL-TS syntax, the query we use for pattern matching (in situations as the one illustrated by Figure 17 and described in Section 4.4) is expressed by the following statement:
15
SELECT S1.SessionID, S1.SampTime FROM AllSeries CLUSTER BY (PatientID, SessionID) SEQUENCE BY SampTime AS (S1, S2, ..., Sm, Sn) WHERE S1.PatientID = ConsideredPat AND ABS(S1.ParName – U1) ABS(S1.ParName)*TV/100 AND ABS(S2.ParName – U2) ABS(S2.ParName)*TV/100 AND ... ... AND ABS(Sn.ParName – Un) ABS(Sn.ParName)*TV/100 AND SIGN(S1.ParName – S2.ParName) = SIGN(U1 – U2) AND SIGN(S2.ParName – S3.ParName) = SIGN(U2 – U3) AND ... ... AND SIGN(Sm.ParName – Sn.ParName) = SIGN(Um – Un)
where n is the number of values in the pattern; m is equal to n-1; AllSeries is the table containing time-series data for all the patients (each patient is identified by the value of the column PatientID and each session for a given patient is identified by the value of the column SessionID); ParName stands for the column name corresponding to the clinical parameter to which the pattern refers; S1, S2, …, Sm, Sn are variables allowing one to refer to n consecutive tuples of the same patient and of the same hemodialysis session (CLUSTER BY clause), ordered according to the sampling time, stored in the column SampTime (SEQUENCE BY clause); U1, U2, …, Um, Un are variables storing the sequence of n values that describe the pattern (interactively selected by the user with IPBC); TV is the variable storing the tolerance value set by the user in the RT. The condition expressed in the WHERE clause identifies the patient to consider (ConsideredPat) and then specifies when the selected pattern matches a sequence of values in a series. This clause allows for some difference between corresponding samples of the given pattern and the matched one, provided that the absolute value of this difference does not exceed the required tolerance and that trends (i.e., increasing, decreasing, steady) in the given pattern and the matched one correspond.
16
Finally, the session ID and the starting time of each matching subsequence for the considered patient are given in the resulting table (SELECT clause).
A recent proposal of a visual approach to find patterns in time-series data is described in [13]. The approach is based on Timeboxes, i.e. rectangular regions defined directly on a two-dimensional display of many time-series. Each time-series is traditionally displayed as a line with respect to a cartesian plane, where the x-axis represents the timeline (i.e., the time distances of the sampling time from the start of the time-series) and the y-axis represents the possible values of the considered parameter. A timebox represents a query and conjunctive queries are incrementally defined through several timeboxes. Each time a timebox is defined (using the mouse), the display is restricted to show only those time-series satisfying the query. The query represented by each timebox is satisfied by all those time-series that have all the samples inside the timebox, for all the sampling times included in the timebox. In other words, each timebox identifies a range (Vmin,Vmax) for the values of the samples and an interval (sTmin, sTmax) for the sampling time. Assuming that any time-series is represented as a list of pairs , where Vi is the value of the considered parameter at sampling time sTi, the timebox restricts the visualization only to those time-series for which Vmin Vi Vmax for every sTi such that sTmin sTi sTmax. Variable time boxes are then introduced to manage some indeterminacy in the temporal position of timeboxes. This visual approach differs from the one proposed in IPBC for pattern matching both in the visualization to which it is applied and in the features of the specified pattern. From the latter point of view, the Timeboxes approach allows for a iterative (visual) refinement of a query and for conditions on non-consecutive time slices, while it does not allow for a specification of detailed trends within a timebox (only a range condition for sample values is considered within each timebox). The approach we followed in IPBC is, in some sense, complementary to Timeboxes: we proceed with a query-by-example approach, considering a specific pattern in a time-series, and then search for similar patterns within the collection of all the displayed time-series. Thus, while pattern matching in IPBC does not allow one to identify time-series with values in given ranges in disjoint intervals, it is suitable for identifying specific and complex temporal trends in time-series. It is worth noting that the same pattern matching criteria can be applied in IPBC also on aggregate values obtained with the Group mode, allowing the user to work on more abstract data.
17
3.9. Mining Multidimensional Data
If multiple time-series, related to different clinical parameters, are associated to the considered hemodialytic session, IPBC allows the user to display a parallel bar chart for each clinical parameter in a different window and to switch quickly among the windows of the different parallel bar charts. The visualizations in the different windows are linked together, e.g. if one selects a single time-series (or a specific value of a time-series) in one of the windows, that time-series (or that value) is automatically highlighted in every other window. This feature of IPBC will be discussed in more detail in Section 4.3). Another option consists of using parallel bar charts together with parallel coordinate plots to display the values of different parameters at the same time instant, as we will discuss in Section 6.
4. Mining Hemodialytic data
In the following, we will show how IPBC can be used in real clinical tasks to help clinicians in evaluating the quality of care given to single patients, on the basis of the clinical parameters acquired during the hemodialytic sessions. Each hemodialysis session returns a time-series for each parameter; different time-series are displayed side by side in the parallel bar chart according to date (in this case, the axis on the left orders the sessions in chronological increasing order).
4.1. Mining patient signs data
A first task consists in analyzing patient signs, as the systolic and diastolic blood pressures and the heart rate; indeed, these parameters are important both for assessing the health status of the patient and for the management of device settings during the hemodialytic sessions.
Let us consider, for example, the task of analyzing all the systolic pressures of a given patient: Figure 13 shows a parallel bar chart (containing more than 19000 bars), representing systolic pressure measurements (about 240 per session) during more than 80 hemodialytic sessions. In this figure, we can notice the presence of out-of-general-range values related to measurement errors at the beginning of each session: they are highlighted in a suitable color and the corresponding bars are flattened (this is done by the system 18
because the clinician has specified the general range of values that are physiologically possible for the parameter and has chosen the automatic flattening option for out-of-general range values). In the specific case considered in the figure, the presence of several out-of-general-range values at the beginning of each session is due to the fact that nurses do not apply the automatic device for the measurement of patient’s blood pressure at the beginning of a session. In the figure, the user is focusing on a group of sessions, and has flattened the bars for the other sessions (as described in Section 3.4). By using a dynamic query, she is visually distinguishing among low pressures (yellow bars, i.e., the most lightly colored ones in the figure), high pressures (red bars, i.e., the darkest ones), and normal pressures (orange bars, i.e, the relative majority of bars in the figure). By looking at the bars that are not flattened in the figure, one can immediately notice that some sessions are almost entirely red: in those sessions, the patient suffered from hypertension, i.e. a clinically undesired situation. Moreover, the clinician can quickly determine how frequent the problem is, how long does it last in a session, and if the possible therapeutic actions taken over time had the desired effect on the subsequent sessions (e.g., the visualization in the figure clearly shows that the situation has worsened in the most recent sessions).
4.2. Mining blood volume data
Another clinical task is related to observing the percentage of reduction of blood volume (mainly due to the removal of water in excess from the patient’s blood) during hemodialysis. The needed amount and the speed of this reduction depend on the conditions of individual patients (e.g., sometimes the process is slowed down to avoid situations in which the blood pressure of the patient becomes too low).
For this task, the Tide mode in IPBC proves to be useful for clinicians. As an example, Figure 14 shows a visualization with more than 9000 bars, representing 36 hemodialytic sessions, containing about 250 values each. The clinician has set the desired increasing linear trend for the percentage of reduction of the blood volume during a session. The resulting visualization allows her to distinguish those (parts of) sessions characterized by a percentage of reduction above or below the desired trend. For example, the selected 19
session (highlighted in a lighter shade of grey) has a central part emerging from the tide, while the initial part and the final one are mostly below. At the same time, it is possible to observe that one of the last sessions has the percentage of reduction above the tide during almost the entire session.
The Tide mode can be combined with the Group mode to study trends of derived abstract data. As an example, Figure 15 is the result of applying the mean function over 5 minutes intervals to the visualization of Figure 14.
4.3. Mining related clinical parameters
The next task we consider requires the analysis of three related parameters: the systolic and diastolic blood pressures (measured on the patient) and the blood flow (QB) entering the hemodialyzer. QB is initially set by the hemodialyzer, but it can be manually changed by nurses, e.g. it is reduced when the patient’s blood pressures are considered too low by the medical staff. Since quality of care is affected negatively by suboptimal QBs, it is interesting to visually relate QB and blood pressures to check whether suboptimal QBs are justified by low pressures. Otherwise, suboptimal values of QB would be due to human errors during the manual setting of the hemodialyzer.
Figure 16 shows the coordinated visualization of the three clinical parameters for the same patient: the systolic blood pressure, the diastolic blood pressure, and QB. In this figure, the clinician is focusing on a session where QB was below the prescribed value during the first two hours of hemodialysis (yellow color, i.e., the light color at the beginning of most sessions in Figure 16c) and she has selected a specific pattern of 6 consecutive values (the system highlights these values in the QB window and the corresponding values of the other parameters in the other windows with a lighter shade of color; moreover, the end of the selected subpart of the series is marked with a black line, as well as the temporally corresponding subparts of series in the other windows). In this way, it is easy to note that the suboptimal QB at the beginning of the session 20
is justified by low blood pressures (yellow bars in the corresponding time-series): QB was set to the correct value by nurses only after blood pressures reached normal values (orange color in the blood pressures windows). In this case, the clinician can conclude that the suboptimal QB is not due to human error in the treatment, but was correctly set by nurses because of the patient’s hypotension.
4.4. Mining for similar patterns
Finally, let us consider a task concerning the analysis of QB. As in the previous Section, the value of QB can be manually set by nurses and it may happen that this value has to be set suboptimally due to hypotensive episodes. Figure 17 shows a visualization where the clinician noticed a change of QB from a lower value to the correct one in a session: this means that, after a period of suboptimal treatment, the proper setting has been entered. This kind of QB pattern needs further analysis (as the one illustrated in Section 4.3). Therefore, the clinician asks first to identify other similar QB patterns. To do so, she selects the pattern of interest by dragging the mouse over it, and sets the tolerance parameter (described in Section 3.8) on the RT. Figure 17 shows the result of the pattern matching operation: the color of bar charts is set to gray to better highlight search results, the specified pattern is colored in red, while the matching patterns found are colored in blue.
To avoid possible occlusion problems in visually detecting the patterns, the clinician can move the viewpoint or switch to the matrix representation, where each pattern can be easily noticed. Moreover, it is worth noting that, in this case, the Match mode provides some useful options, allowing one to hide all the time-series that have no matching patterns: time-series containing matching patterns are thus easily explorable, as depicted in Figure 18.
21
5. Evaluation of IPBC
We carried out the evaluation of IPBC on the field with the clinical staff of the hemodialysis center at the Hospital of Mede, PV, Italy. The approach we took in designing IPBC was based on iterative prototyping: each prototype was evaluated on the end users with real clinical cases both to determine which of its features were not easy to understand or use by the clinicians and to elicit requirements for new functionalities that became clear as the process progressed. To give the reader an idea of how deeply this iterative user-centered process affected the final results of the project, we briefly summarize its main phases.
Our first prototype was a VRML-based visualizer of the collections of time-series. The visualization was not yet based on 3D bar charts, but on a datascape metaphor where values of the different time-series were mapped into peaks and valleys, as shown in the example of Figure 19. We based the visualization on VRML because it is an accepted standard in some scientific visualization applications; it is possible to distribute and visualize VRML files on the Internet or Intranet by using a standard Web browser equipped with a free plug-in, and the plug-in offers a ready-made interface for examining and navigating the visualization (e.g., zooming, rotating , choosing among predefined views, …). Unfortunately, this first prototype failed to meet the needs of end users. The main reasons for its rejection were: (i) the ready-made interface provided by VRML plug-ins is too difficult to use for inexperienced users and leads often to situations of disorientation and occlusion, making it difficult to correctly interpret the clinical case, (ii) the chosen metaphor was not familiar to clinicians, (iii) the prototype was lacking a number of the functionalities described in this paper (the need for them became clear only after getting feedback from end users). From a more technical point of view, relying on the rendering engine of the VRML plug-in did not allowed us enough control on the produced visualization.
We thus built from scratch the first IPBC prototype (described in [7]), that proposed a preliminary version of the 3D bar chart visualization and a few exploration functionalities. The system was built using an OpenGL library [12] to gain more control on the rendering and interactive features of the visualization. We tested that prototype in the real clinical setting mentioned above, by allowing clinicians to use it on 22
daily routine activities and we collected all the comments they made. One of the major advantages of this version of IPBC that emerged was that the visualization and its interactive features were very quickly learned and remembered by clinicians. This evaluation pointed out also a number of needed usability improvements and new functionalities required by clinicians. The final version of IPBC that has been described in the previous sections is the result of all the changes and additions that we had to apply.
A major disadvantage of IPBC highlighted by clinicians was that the usage of screen space becomes difficult when a user tries to relate different collections of time-series in the same screen. Moreover, in many situations, the clinician that is studying a parallel bar chart illustrating a parameter, needs to know the value of several other parameters, but only for a few selected time instants: showing entire collections of time-series for the other parameters is thus unnecessary and makes the task more complicated. To face these problems and allow for more flexibility in the analysis of several parameters on the same screen, the last extension we included in the system is the possibility of having parallel bar charts integrated with parallel coordinate plots, as we will illustrate in the next Section.
6. Integrating Parallel Bar Charts with Parallel Coordinate Plots
As motivated at the end of the previous Section, we propose an integration of IPBC with the well-known Parallel Coordinate Plots (PCP) in such a way that the clinician can relate the parallel bar chart she is considering with many other parameters in the same screen. These additional parameters are represented by a PCP where each parameter corresponds to one of a number of vertical axes, and a value of the parameter is a point on the corresponding axis (more precisely, each vertical axis is displayed as a box, and each point is represented as a horizontal segment in the box). A line on the PCP links the values of different parameters at the same time instant. Figures 20 and 21 show examples of how a parallel bar chart and the PCP can be used together. The upper part of the screen contains the parallel bar chart and offers all the interaction modes previously described for IPBC; the lower part of the screen contains a PCP to which the clinician can assign different parameters (in the figures, the clinician has selected 6 parameters, one of which is the same displayed by the parallel bar chart). The background of the PCP is colored according to the subranges that identify high, normal, and low values for each parameter (following the approach presented in Section 3.6). 23
The vertical axis for the parameter displayed by the parallel bar chart is visualized with lighter shades of colors in the PCP. If the user selects a single bar in the parallel bar chart, the PCP will show only the line that connects the values of the 6 parameters at the proper time instant. As the user interactively selects/deselects more bars with the mouse, the corresponding lines will appear/disappear in the PCP. Figure 20 shows a situation where the user has selected a set of bars (highlighted in a lighter color on the parallel bar chart) for the QB parameter and can relate their values with those of other parameters in the PCP (the axis for the QB values in the PCP is the first one from the left).
Integrated PCPs can also be useful during pattern matching: the clinician can visually determine whether different hemodialytic sessions, which are similar in some subparts of the bar chart for a given parameter, are similar also in other corresponding parameters. For example, Figure 21 shows the usage of the PCP during pattern matching on a parallel bar chart displaying QB time-series: the clinician can select QB patterns among those found with the parallel bar chart and easily notice in the PCP whether they are similar also from the point of view of other parameters of interest.
The last feature we mention that exploits integrated PCPs is provided by the Animate mode of the RT: the user can select a sequence of values on the parallel bar chart and visualize the evolution over time of all the related parameters through an animation of the lines in the PCP. The functionality exploits a movie metaphor and is based on VCR-like controls in the RT (play, stop, rewind, forward, variable speed), that include the capability of indefinitely repeating the movie (repeat). Figure 22 illustrates a situation in which the clinician is focusing on a part of a specific bar chart for venous pressure (i.e., the pressure of the blood exiting the hemodialyzer). This part is highlighted in the parallel bar chart. The related PCP includes QB, arterial pressure, systolic and diastolic pressure, and hearth rate, besides venous pressure (the second vertical axis from the left, colored in a lighter grey). Two lines in the PCP background highlight the subranges of interest for each considered parameter: for example, Figure 22 shows a PCP with values in the highest subrange both for the venous pressure (second vertical axis from the left) and for the diastolic 24
pressure (second vertical axis from the right). By the Animate mode, the user can watch the movie related to the selected (subpart of a) time-series. As the movie is played, a moving vertical black line on the parallel bar chart visually synchronizes the animation of the PCP with the corresponding samples on the bar chart. The aim of this last exploration tool is to exploit the ability of the clinician to detect anomalies in a (synthetic) movie. This task is typically familiar to clinicians because it is used, for example, in clinical exams such as echographies and angiographies.
7. Conclusions and Future Work
In this paper, we described the main features of IPBC (Interactive Parallel Bar Charts), a VDM system devoted to interactively analyze collections of time-series, and showed its application to the real clinical context of hemodialysis. As the evaluation with end users mentioned in Section 5 progressed, we iteratively refined our system and focused also on integrating the bar chart visualization with other visualizations such as PCPs.
Further interesting research goals deserve exploration. One is the integration of parallel bar charts with visualizations that can provide a synthetic view of data. For example, the medical literature is proposing some computation methods to summarize the quality of an entire hemodialytic session in a few values (see, e.g. [2]), called quality indexes. To deal with quality indexes, we plan to adapt the PCP visualization described in Section 5: a line in a PCP could connect the quality indexes (typically, 5-7 values) of a session selected in a parallel bar chart. The other research gola is to extend IPBC to deal with time-series at different abstraction levels, allowing for both a fine exploration of time-series (e.g., to detect specific unusual values) and their coarse exploration (to focus on more abstract derived information such as trends or temporal patterns), by extending also the expressive power of queries that can be visually specified by means of the pattern matching functionality of the system.
25
Acknowledgements This work has been partially supported by a MURST COFIN 2000 project (“Analysis, Information Visualization, and Visual Query in Databases for Clinical Monitoring”). Special thanks are due to Dr. Roberto Bellazzi and to his team at the Unit of Nephrology and Dialysis of the Hospital of Mede, PV, Italy, for the kind cooperation offered during the field evaluation of the system. We are also grateful to Eric Grange for the useful suggestions about GLScene.
References
1.
C. Ahlberg, C. Williamson, B. Shneiderman, Dynamic queries for information exploration: An implementation and evaluation, in: Proceedings of the CHI ‘92 Conference on Human Factors in Computing Systems, ACM Press, New York, 1992, 619-626.
2.
R. Bellazzi, C. Larizza, P. Magnia, R. Bellazzi, S. Cetta, Intelligent Data Analysis techniques for Quality assessment of hemodialysis services, in: Proceedings of the 6th International Workshop on Intelligent Data Analysis in Medicine and Pharmacology, London, UK 2001, http://magix.fri.unilj.si/idamap2001/papers/bellazzi.pdf
3.
J.A. Brown, A.J. McGregor, H-W. Braun, Network Performance Visualization: Insight Through Animation, in: Proceedings of PAM2000: Passive and Active Measurement Workshop, Hamilton, New Zealand, 2000, 33-41.
4.
J. Callahan, D. Hopkins, M. Weiser, B. Shneiderman, An empirical comparison of pie vs. linear menus, in: Proceedings of the CHI ‘88 Conference on Human Factors in Computing Systems, ACM Press, New York, 1998, 95-100.
5.
L. Chittaro (ed.), Special issue on Information Visualization in Medicine, Artificial Intelligence in Medicine Journal, 22(2) (2001).
6.
L. Chittaro, Information Visualization and its Application to Medicine, in: [5] 81-88.
7.
L. Chittaro, C. Combi, G. Trapasso, Visual Data Mining of Clinical Databases: an Application to the Hemodialytic Treatment based on 3D Interactive Bar Charts, in: Proceedings of VDM 2002: 2nd International Workshop on Visual Data Mining, Helsinki, Finland, 2002, 97-111.
8.
S. G. Eick, Visualizing Multi-Dimensional Data, ACM SIGGRAPH Computer Graphics, 34(1) (2000) 61-67.
9.
S. G. Eick A.F. Karr, Visual Scalability, Journal of Computational & Graphical Statistics, 11(1) (2002) 22-43.
10. G. Falkman, Information Visualization in Clinical Odontology: Multidimensional Analysis and Interactive Data Exploration, in: [5] 133-158.
26
11. C. Faloutsos, M. Ranganathan, Y. Manolopoulos, Fast Subsequence Matching in Time-Series Databases. In: Proceedings of the ACM SIGMOD International Conference on Management of Data, ACM Press, New York, 1994, 419-429. 12. GLScene, OpenGL library for Delphi, http://glscene.org 13. E. Keogh, H. Hochheiser, B. Shneiderman, An Augmented Visual Query Mechanism for Finding Patterns in Time-series Data, in: Proceedings of 5th International Conference on Flexible Query Answering Systems, Lecture Notes in Computer Science 2522, Springer Verlag, Berlin, 2002, 240-250. 14. P.A. McFarlane, D.C. Mendelssohn, A call to arms: economic barriers to optimal hemodialysis care. Perit Dial Int 20, 2000, 7-12. 15. Miner3D Excel, Dimension 5, http://miner3d.com 16. D. Rafiei, A. O. Mendelzon, Querying Time-series Data Based on Similarity, IEEE Transactions on Knowledge and Data Engineering 12(5) (2000) 675-693. 17. R. Sadri, C. Zaniolo, A. Zarkesh, J. Adibi, Optimization of Sequence Queries in Database Systems, In: Proceedings of the 20th ACM SIGACT-SIGMOD-SIGART Symposium on Principles of Database Systems, ACM Press, New York, 2001, 73-83. 18. B. Shneiderman, 3D or Not 3D: When and Why Does it Work?, invited talk at Web3D 2002: 7th International Conference on 3D Web Technology, February 2002, Tempe, AZ, http://www.cs.umd.edu/hcil/pubs/presentations/Web3D-4_files/web3d.ppt 19. M. Spenke, Visualization and Interactive Analysis of Blood Parameters with InfoZoom, in: [5] 159-172. 20. E.R. Tufte, The Visual Display of Quantitative Information, Graphics Press, 1982. 21. USRDS, The United States Renal data system, http://www.usrds.org 22. M. Weber, M. Alexa, W. Mueller, Visualizing Time-Series on Spirals. in: Proceedings of the IEEE Symposium on Information Visualization (InfoVis 2001), IEEE Press, 2001.
27
Figure 1. A Parallel Bar Chart with a pop-up Round Toolbar.