IPTEK, Journal of Proceeding Series, Vol. 1, 2014 (eISSN: 2354-6026)
239
Database Integration Model for Automatic Identification System and Shipping Database In Real Time Traffic Monitoring Akhmad Maulidi1, Trika Pitana1, Ketut Buda Artana1, A.A. Bagus Dinariyana1, Muhammad Badrus Zaman1, Ahmad Agoes Masroeri1, and Ricky Randall Sembiring1 Abstract In recent years, there are so many marine accidents in the world such as ship sinking (37%), grounding (13%), collisions (15%), fire (18%) and other types of accidents (17%). While the causes of the ship accident are 37% of human error, technical error of 23%, 38% due to natural conditions, and 2% to other causes. One of the causes is the weakness of the identification and monitoring the ships passing through the shipping channel in Indonesia. Automatic Identification System (AIS) on the previous research has been carried out with the integration of Geographic Information System (GIS) that allows measuring the use of AIS for fuels monitoring and the development of ship inspection priority system based on the level of risk held by each vessel. Those studies are expected to minimize the level of accidents that occurred in Indonesian waters. However, the result of previous studies showed that the identity of the ship is still conducted separately. It is thus necessary to perform data integration with databases AIS vessel into a database server. This research is focused on the development of the integration between AIS data and shipping database, therefore, It could be used as the backbone of integration system for measuring safety and pollution of the ships, such as basis for monitoring traffic analysis, estimates of air pollution, vessel inspections in real time and direct search vessel identity. Keywords reciprocating compressor, valve seat, vibration, pressure.
I. INTRODUCTION 1
I
n recent years, there are so many marine accidents in the world such as ship sinking (37%), grounding (13%), collisions (15%), fire (18%) and other types of accidents (17%). While the causes of the ship accident are 37% of human error, technical error of 23%, 38% due to natural conditions, and 2% to other causes [1]. One of the causes is the weakness of the identification and monitoring the ships passing through the shipping channel in Indonesia. Several actors who contribute to the safety of maritime transport are: ship owners, ship insurance, cargo owners, classification agency, the State flag or Flag State, Port Authority or Port State Control Officers [2]. Among the actors , who have the most difficult task in maintaining the safety of sea transport is the Port State Control Officers (PCSO) in Indonesia or commonly known as the harbor master. This is mainly due to the flag State cannot do their job well in keeping all ships using the flag to be worthy [3]. As a result, the PCSO must conduct inspections on ships visiting the harbor to be worthy. Automatic Identification System as one of the technologies to detect the position of the existing ships and implemented on ships that are at least 300 GT (Gross Tonnage) for all ships that travel internationally and 500 GT for doing national shipping [4][5]. With this technology, port authorities can know what kind of vessel, vessel size, vessel name, call sign and the maritime mobile service identity (MMSI) is then called the data static . In addition to static data, port authorities can also view dynamic data, such as coordinates of the ship, vessel direction, speed and time. These data will 1
Akhmad Maulidi, Trika Pitana, Ketut Buda Artana, A.A. Bagus Dinariyana, Muhammad Badrus Zaman, Ahmad Agoes Masroeri, and Ricky Randall Sembiring are with Departement of Marine Engineering, Faculty of Marine Technology, Institut Teknologi Sepuluh Nopember, Surabaya, 60111, Indonesia. E-mail:
[email protected].
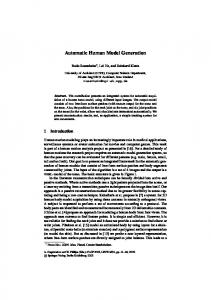
not be easily interpreted if it is not combined with geographic information system (GIS). There are many utilizing AIS data for conducting researches, for instance, the usage of AIS data for estimation marine exhaust emission, development of hazard navigation map, ship evacuation assessment and dangerous score [6][7][8][9][10]. It seems that the previous researches have not been combined as the system for monitoring the marine safety and environment. Therefore, this paper mainly discusses integrating the AIS database and shipping database in the real time as the backbone of marine safety and environment monitoring system. The example of AIS implementation for exhaust emission in the real time are illustrated. This paper consist of four main sections. In the first section, it is described the reason and the originality of the research. The method of research is then illustrated. The collecting data and integrating data procedure are described. Next, the research results are described and the weaknesses of result are illustrated. Finally, the possibilities of the implementation of AIS data for monitoring marine safety and environment are shown. II. DESCRIPTION OF WORK A. Preliminary This methodology is illustrated on flowcharts as seen in Figure 2. B. Problem Identification Identify the problem will be taken place in the Madura Strait, where is one of the congested shipping lanes in Indonesia. There are not only the Indonesian -flagged vessels , but also vessels of foreign flag many activities in the Strait . AIS data could be used to evaluate the ship's position based on the time and coordinates, and also can be known change of pace, it is associated with ship mode changing to estimate emissions produced ships, such as (NOx, SOx, PM , CO and CO2).
240
IPTEK, Journal of Proceeding Series, Vol. 1, 2014 (eISSN: 2354-6026)
C. Study Literature At this stage is a step to collect all forms of information and data that can be used to complete the course of this reaserch. Such literature can be obtained from the paper or international journals, books, theses or other internet related to this reaserch. So that it can be obtained the basic theories, formulas, and other references. Information can also be obtained by discussion with the competent authorities in this field. D. Data Collection 1) AIS Data Data on AIS is dynamic, meaning that the data is subject to change at any time, such as the coordinates and speed of the ship, the AIS data collection using AIS receiver contained on laboratory of Reliability, Avialaability, Maintainability and Safety (RAMS), Marine Engineering ITS. The data from the AIS would be processed to determine the estimated emissions from ships that have been recorded by the AIS after combined with data from the shipping database. 2) Shipping Database Data in this database is static data means the data is not changing, so the data can later be inserted directly to the database server. Shipping database is obtained from Lloyd's register. Data, which are taken from shipping database are the principal dimension of vessel, gross tonnage (GT), national origin, and other types of machinery. All the data are used as the calculate of the estimated emissions. 3) Database Creation Database creation is basically the combination between AIS data and shipping database. The database is used to process and organize data from all over the country. In the database creation, it takes time because they have to move the data from the shipping database and convert the data and then inserted into database editor. 4) PHP Scripting PHP script here is to connect the data to the database from the server. All of the data in the database would be displayed on the internet browser after treatment by using the commands in the form of a PHP script. 5) Ship Display and Tables On the internet browser, it is expected that the result from the PHP script would display a table and display Google Maps. Total emissions released by all ships that have AIS transmitters in Madura stait will be shown on the table. In addition, the ship's location and emission of ship are displayed on Google Maps. III. RESULT AND DISCUSSION A. AIS Data Data needed in this process are the data captured by AIS Receiver residing in FTK ITS RAMS laboratory. Record of AIS data has formats such as *. CSV or comma separated value. AIS data will then be used directly to perform calculations performed with a php script which would be displayed in the web browser. Beside static data, there are dynamic data means that this data is always changing every time, such as the position of the ship ( latitude and longitude ) and SOG (Speed over ground ) . Therefore, it requires a great care
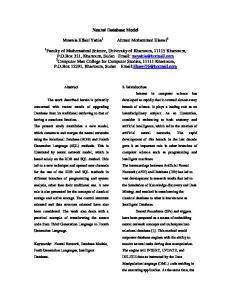
in order to synchronize betwen AIS data and database vessel. B. Shipping Database In order to estimate exhaust emission of ship using USEPA method, it is necessary to combine AIS data and other data obtained from Lloyd's Register ship database. During conducting data collection, it is important to change the format of the data, such as spreadsheet and dbf5 when it is imported from the databank. The reason for importing into a spreadsheet is to be able to see the contents of the data without having to open phpmyadmin. Data, taken from the ship database should be divided into several parts due to the size of the data, the maximum data that can be imported from the database is 2500 lines, so the data will split into 3 parts: a. Data 1 Gross tonnage IMO Number MMSI Engine RPM HFO Consumtion MDO Consumtion Maximum Speed Ship Type LOA Engine Type Engine Kw Total b. Data 2 Gross Tonnage MMSI Beam Class Date Class By Depth Displacement Engine Stroke Flag IMO Chemical Class c. Data 3 Gross Tonnage MMSI Ship Name Draft Ship HP Total Port of Registry Figure. 3. is a display shipping database on local host with phpmyadmin that can be opened through the browser, though not connected internet network. The display can be seen on the number of data bytes in size ship countries. Data can be added to the query function on local host when adding the ship data. A database view in spreadsheet format is shown in Figure 4. The data in this form is used to facilitate if we want to see either the flag of the ship or country origin of ship because the data in this form is still in the preliminary data and has not been corrupted. C. Data Merging In order to merge easily the shipping database and AIS data, it is used data, which could be obtained from both data, such as Gross Tonnage (GT) and MMSI. Both data are used as the keyword for combination data.
IPTEK, Journal of Proceeding Series, Vol. 1, 2014 (eISSN: 2354-6026) The first step, all the data is imported each of the 185 countries in the form of *.DBF into database tools with “import wizard“ that every country has a query respectively . After that, all data is insert into one table United States in the “ship” database for easy retrieval when combined with the *.CSV from AIS receiver. Then performed combined data from all over the country with a total of 185 countries using database tools. The result of merging the data across countries are 1000 ships per page, with a total number of 1000 pages of 1,000,000 record ship data. D. Data Record from AIS Decoder Interpreter/AIS Decoder is used to convert AIS data to be output CSV data every hour. Further results of this AIS data reading device are injected MySQL database. Figure. 7 shows the results of AIS Decoder. E. Display In Web Browser Figure. 8 display all ships using AIS in the Tangjung Perak port and the calculation of the 5 types of emission such as NOx, CO, CO2, PM, SOx. By clicking each ship, amount of emission, corresponding with time deviation and change of position is shown. In addition, amount of emissions of the entire ship’s port area is ilustrated. Figure. 9 shows the different types of vessels that could be seen from the color. The changes and the identity of each ship could be seen by clicking each ship. By using web browser, it could be shown the ship condition, which visited the harbor. The whole ship is summarized in Figure 10 and 11, which describes the vessel data such as vessel name, MMSI, vessel type, engine power, and Speed. On viewing the page, it can also show either the ships safe category or inspection without the need to click around the ship, in other words, it is possible to monitor existing vessels in Madura strait trough that page.
241
IV. CONCLUSION AIS data integration in real-time can be used as a basis for monitoring traffic analysis, estimates of air pollution, and vessel inspections in real time. By using the web-based traffic control, it is more efficient to to monitor the marine traffic, safety and environment in term of air pollution in the specific area. REFERENCES [1]. [2].
[3].
[4].
[5].
[6].
[7].
[8].
[9].
[10].
Laporan analisa trend kecelakaan laut 2003-2008 PT. Trans Asia Consultan. Kristiansen. Svein, 2005 “Maritime Transportation : Safety Management and Risk Analysis”, Elsevier ButterworthHeinemann, London, England. Carriou, P., Mejia, M.Q., Wolff, F.C., 2008. On the effectiveness of port state control inspections. Transportation Research Part E 44, 491-503. http://www.yachtinsure.com/news-auto-identificationsystems.htm, Automatic Identification System (AIS):Complete Guide to AIS International Maritime Organization (IMO), Annex 3, Recommendation On Performance Standards For An Universal Shipborne Automatic Identification Systems (AIS),IMO Resolution MSC.74(69). Pitana, T., Kobayashi, E., Wakabayashi, N., Estimation Of Exhaust Emission Of Marine Traffic Using Automatic Identification System Data (Case Study : Madura Strait Area, Indonesia ) , OCEANS 2010 LEEE Sydney 24-27 May 2010, CFP100CF – CDR 978-1-4244-5222 Library Of Congress : 2009934926, 2010. Pitana. T., Artana, K.B, Dinariyana, A.A, Zaman.M.B, Pirsada,H.(2011) "Development of Hazard Navigation by Using AIS data". Journal of Maritime Researches,Vol.1, No.1 Kobayashi, E., Wakabayashi. N., Makino.H., Ishida.K., Pitana.T., Hwang.S. Installation of an Asian AIS data receiving system network, Proc of Japan Institute of Navigation, Korea, 2010. Pitana.T, Kobayashi.E, Syunichi.K, Onoda.K, Rusmanto(2008) "A large passenger ship evacuation assessment due to Tsunami Attack". Journal of the Japan Society of Naval Architects and Ocean Engineers (JASNAOE),Vol.8, pp.195-207. Mou, J.M., Tak, C.V.T., Ligteringen, H., Study of Collision Avoidance in Busy Waterway by Using AIS data, Journal of Ocean Engineering, 2010.
Figure 1. AIS Installed in Laboratory of RAMS
242
IPTEK, Journal of Proceeding Series, Vol. 1, 2014 (eISSN: 2354-6026) Start
Problem Identification
Study Literature AIS Data, Shipping DB
Text Book, Journal, Internet
Data Collection
MySQL Database
PHP Scripting
Web Server
Display
Browser
Running
Google Map
Ship Record End Figure. 2. Framework of Database Integration Model
Figure. 3. Display ship database in the localhost
Figure. 4. Display of shipping database in the spreadsheet
IPTEK, Journal of Proceeding Series, Vol. 1, 2014 (eISSN: 2354-6026)
Figure. 5. Import data into query
Figure. 6. Merging all data
Figure. 7. The result of the incorporation of the Ship
Figure. 8. Data converted by interpreter / decoder AIS
Figure. 9. Display on web browser
243
244
IPTEK, Journal of Proceeding Series, Vol. 1, 2014 (eISSN: 2354-6026)
Figure. 10. Display ship identity perkapal
Figure. 11. Display all ships in the web browser