Dataset Designing of Software Architectures Styles for Analysis through Data Mining Clustering Algorithms Qadeem Khan
Dr. Usman Qamar
College of Electrical and Mechanical Engineering, National University of Science and Technology Rawalpindi, Pakistan Email:
[email protected]
College of Electrical and Mechanical Engineering, National University of Science and Technology Rawalpindi, Pakistan Email:
[email protected]
Dr. Wasi Haider Butt
Dr. Saad Rehman
College of Electrical and Mechanical Engineering, National University of Science and Technology Rawalpindi, Pakistan Email:
[email protected]
College of Electrical and Mechanical Engineering, National University of Science and Technology Rawalpindi, Pakistan Email:
[email protected]
Abstract—Software Architecture is an important part of the software systems which states that how multiple components of the system interact with each other. There are multiple architecture styles in software engineering such as Object Oriented, Client-Server, CORBA, Repository, Event-based, Interpreter. This research article provides a concept of a novel data set designing which defines the architectures of software systems based on architecture styles. As there is no such a data set available so hence this article will enable researchers and software industrialists to define their own data set of their organizations for analyzing the projects through data mining approaches. The research also performs clustering algorithms on the proposed data set with RapidMiner Studio tool for interesting analysis.
architectural styles which could be processed by the data mining algorithms[8][7]. Such data mining algorithms can be as clustering[7] and classification algorithms [9]. This article is therefore suggests a novel data set of software architectural styles [6] which may be analyzed by software engineering. This data set will help us to perform the quality up-gradation, maintenance and optimization of the software projects to be developed. The data set is update-able and is usable by all researchers for academic and industrial purposes. Section V, VI , VII and VIII are the main sections of the research paper in which we have performed data set designing ,experimental setup in rapid-miner and analysis of the clustering algorithms.
Keywords—Software Architecture Software Clustering Algorithms
There are numerous standard definitions of software architectural styles [6] available in the literature. According to the Shaw and Clements , ”A set of design rules that identify the kinds of components and connectors that may be used to compose a system or subsystem, together with local or global constraints on the way the composition is done”.
I.
Styles;
Data
Mining;
INTRODUCTION
Data [1] is an important part of any software system for defining the functionality. For accurate functionality, data must be correct,formatted and relevant to the purpose. There are many websites from which a data set can be downloaded and used for research purposes. For example UCI website [3] allow us to download the biological data for experimental purposes. We also need a data set [4] of multiple software systems on which multiple data mining algorithms[4] can be applied and useful information can be extracted. Software architecture[5] is important part in software system in which multiple stakeholders are agreed on a common struc-ture of the system. An architectural style [6] is the combination of the architectural design decisions which are applied in the context of software development and are specific to the system. Architectural style defines the general shape of the system to be developed. According to the research there is no such a data set of the software engineering projects so we suggest using the attributes of the software
II.
SOFTWARE ARCHITECTURAL STYLES
L.Bass, P.Clements, R.Kazman defines it as, ”The software architecture of a program or computing system is the structure or structures of the system, which comprise software elements, the externally visible properties of those elements, and the relationships among them”. As the above definitions state, architectural styles elaborate the components and connectors of the software system which can be utilized as a pattern [10], with the set of constraints that how the components of a software system can be merged with each others. These constraints may be such as the programming constraints such as no infinite loops, finite execution time. in software architectural styles, the components are connected with connectors such as calls, pipes, and inheritance, procedure call, data access, event, stream, linkage, distributor, n arbitrator, adaptor, multiple
1|P age
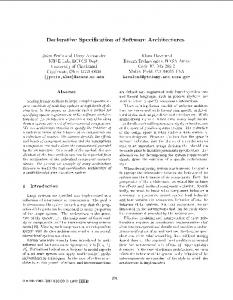
examples of software architectural styles are mentioned in figure 1.
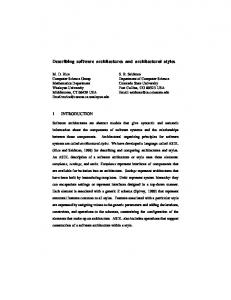
table oriented format. Every column provides a specific attribute of the data. Every row with a given individual forms the data set being referred to an interest. It records values for each of the factors, for example, stature and weight of an element. Each value is called a datum. There are many examples of data sets available in MATLAB [11]. Such as hospital.mat, flu.mat, gas.mat, kmeansdata.mat. These files can be accessible directly into programming via load command. Researchers can use these built-in data sets for research activities in different educational and research centers. Figure 2 provides an example of loading hospital data set and then viewing in MATLAB using load and hospital commands.
Fig. 1. Software Architectural Styles
A. Importance of Architectural Styles The following are some of the reasons which state that why we have planned to design the data sets of software architectural styles to be processed by data mining algorithms and statistical methods.
Architectural styles provide an abstract overview of the system. This abstraction may be used as a guideline that how the system will be developed.
Architectural styles emphasize essential decisions about the design components and encapsulate critical limita-tions on the components and their connections.
Architectural style provide interfaces among the compo-nents.
Knowledge about architectural styles provides the ability of the anticipating the problem and its solution.
Architectural style provide a clean guidelines towards creating and executing the test cases for software quality assurance. III.
DATA SET IN DATA MINING
The data set [4] is actually a data repository which contains the data about the interest of the daily life activities. A data set is an accumulation of related, discrete objects of related information that might be obtained separately or in blend or dealt as a whole element. Data mining [8] procedures are used in creating programming re-usability forecast models for enhancing the quality of the software engineering product. There are many websites from which, we can download and use the data set. A data set is a group of information, often presented in a
Fig. 2. Hospital Data set in MATLAB
IV.
ATTRIBUTES OF THE PROPOSED DATA SET
In TableI, we have provided a standard data set for the analysis of the software architectures through data mining techniques. There are total of 18 attributes in the data set.The proposed data set is in the tabular format. Attributes are the standard architectural styles of multiple projects collected from the academia and industry of computer science. The data set is easily updatable and thus has scalability. New architectural styles can be easily added or existing architectural styles can be deleted from the proposed data set. The file format of the data set depends on the tool to be used for data mining. In this research paper , we have used .CSV file format [12] to be processed by rapid-minor software. The data set is freely distributed and is provided on the personnel email of the requester for the research activities. The data set is also download-able from www.kaggle.com/qadeemkhan/dataset-of-softwarearchitectural-styles on free. please email to the principal author about any refinement and extension required. There are 1000 entries in the data set. Table I shows 46 records only of our proposed data set for software architectural styles.
2|P age
TABLE I.
THE PROPOSED DATA SET OF SOFTWARE ARCHITECTURAL STYLES Software Architectural Styles of the Projects
Function Oriented
Event Driven
Layered
Pipes & Filters
Data Centric
Blackboard
Rule Based
Publish Subscribe
Asynchronous Messaging
96 260 147 195 120 288 203 135 65 145 220 16 242 163 263 121 299 38 94 34 2 224 72 267 116 241 219 97 126 134 259 251 293 38 211 252 190 267 264 267 269 232 154 54 96 84
4 1 7 9 3 9 13 13 10 13 13 12 3 2 14 10 8 12 12 6 9 12 7 2 13 1 4 4 12 4 7 3 1 3 9 12 1 4 4 4 1 10 1 13 1 8
6 5 4 3 10 6 3 5 4 2 9 1 3 2 2 13 7 5 15 8 6 12 15 3 13 15 2 8 15 10 7 1 10 14 4 8 7 13 2 13 10 7 8 8 15 2
53 53 107 150 35 139 9 25 1 63 138 39 136 50 75 54 134 65 7 23 8 115 135 134 90 38 71 35 45 109 36 44 7 35 74 37 63 73 78 73 72 108 144 28 127 96
3 1 10 13 12 12 15 7 15 5 10 16 7 8 1 17 14 15 14 17 1 17 1 3 11 4 9 1 3 13 13 10 14 2 19 4 11 14 7 14 9 7 3 17 15 20
901 627 1025 653 1394 393 1345 358 945 516 1378 1057 1324 1106 425 922 302 762 1114 166 663 1211 167 116 953 866 625 589 1232 5 982 436 557 756 1254 416 1234 1393 241 1393 427 563 218 1143 413 510
160 73 101 93 100 103 14 135 95 11 43 52 25 23 18 79 26 107 130 147 18 150 107 22 65 12 123 14 110 53 43 132 149 15 7 144 84 146 103 146 89 5 28 103 36 160
15 15 14 1 10 7 16 10 18 3 8 19 14 16 14 12 20 14 7 2 18 13 16 16 10 4 19 18 7 1 3 5 3 11 19 9 5 17 12 17 20 17 16 18 19 2
5 1 4 4 2 10 3 2 8 6 5 8 3 9 6 7 1 9 3 8 2 7 6 4 5 10 5 5 4 6 2 5 6 4 9 6 4 3 3 3 3 1 9 6 1 6
V.
EXPERIMENTAL SETUP THROUGH RAPIDMINER
Our proposed data set can be processed by any tool or a package.It may be used in any other formats[13] such as Excel, SPSS, ARFF, XRFF, XML,and Dbase.In our research,
2 9 8 9 6 5 1 9 9 1 10 2 10 1 7 8 2 4 3 7 10 8 10 4 4 7 6 8 4 10 7 8 5 7 6 3 4 2 8 2 4 9 3 2 7 1
11 99 89 55 96 66 63 79 5 2 34 62 80 40 89 96 75 70 87 27 67 54 74 29 95 63 79 9 52 74 73 96 82 3 74 93 21 66 86 66 96 64 72 54 19 54
871 825 90 732 533 854 26 923 865 231 219 576 568 592 819 849 760 150 466 951 626 144 523 371 13 322 264 638 506 722 188 120 867 24 548 619 350 403 204 403 244 321 969 409 711 866
3 5 5 5 2 3 1 1 1 1 1 2 3 5 3 5 5 4 2 3 1 5 4 3 3 5 5 1 5 5 3 1 2 1 3 3 4 1 5 1 1 1 4 4 4 2
Shared Nothing
Object Oriented 836 99 1343 1108 149 173 270 424 547 37 1478 816 686 357 267 1491 57 1007 427 607 1177 213 160 1128 980 576 576 1039 687 304 79 1469 985 158 126 1134 191 1026 61 1026 1469 1469 318 645 1474 1346
Domain Driven Design
Abstract Machine 221 59 236 161 56 47 41 210 93 219 21 37 59 179 57 143 218 240 13 268 233 218 85 129 147 149 134 121 293 6 69 44 122 68 152 201 93 196 234 196 101 165 73 129 31 90
Peer-to-Peer
Client Server 9 3 7 4 2 3 7 2 7 5 8 5 4 8 2 7 6 10 4 3 4 9 2 4 2 5 1 4 6 9 7 1 8 2 9 3 9 8 1 8 5 1 9 10 7 8
Microkernel
Repository 2 2 1 1 4 3 4 2 7 4 8 9 6 1 9 1 4 2 9 10 5 4 2 5 3 3 7 5 10 7 8 5 3 7 8 10 6 10 3 10 2 10 9 8 5 1
Plug-ins
Project No. 1 2 3 4 5 6 7 8 9 10 11 12 13 14 15 16 17 18 19 20 21 22 23 24 25 26 27 28 29 30 31 32 33 34 35 36 37 38 39 40 41 42 43 44 45 46
1 1 4 0 4 3 0 5 5 2 1 1 3 3 5 1 3 0 3 5 3 5 1 2 4 3 0 4 5 3 3 4 0 4 1 4 4 5 0 5 4 5 4 3 5 2
we have used the rapindminer 7.3 [14]. It is a standard tool for data set analysis. It utilizes different sort of dataminig algorithms [15] such as K-Mean clustering, RestartKMean, KMedoid, Agglomeration Hierarchical, EMClustering , SVClustering.
3|P age
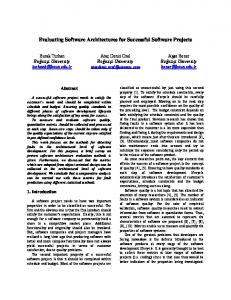
A. Perspectives in RapidMiner There are two perspectives [14] in Rapidminer called design and result perspectives. Design Perspective Result Perspective Design Perspective is used to design the operation of the process. It is done by drag drop the required process , data set and other modules onto the design panel. The result perspective is to view different sort of the results of the analysis through data mining approaches. The results can be viewed in terms of statistics and standard charts options available to the analyst.The perspectives are shown in 3 below.
operator. Information of the Log operator include the applycount, CPU Execution (nanosecond), CPU Time (nanosecond), Execution Time (millisecond), Loop Time (millisecond), and Time (millisecond). The evaluation is performed for a particu-lar benchmark of hardware and software system. The negative values show the huge amount of time taken by the clustering algorithms. The description of parameters is explained in the following list [16]. CPU Execution (Nanosecond: The Time of starting and finishing of the operator execution. CPU Time (Nanosecond): The Time used by CPU to process the operator. Execution Time (Millisecond: The system clock time elapsed when the operator finished execution. Loop Time (Millisecond): The time elapsed since the last time, the operator was called. Time (Millisecond): The time of the call of the operator.It is the start time of the operator.
Fig. 3. Rapidminer Perspectives
B. Designing the Clustering Algorithms Processes for the Proposed Data set In RapidMiner, there are the options to choose three different variants of the K-Means clustering operators [15]. The first is the standard K-Means, in which closeness between items depends on a measure of the distance between them. The K-Means (Kernel) cluster utilizes parts to gauge the distance amongst objects and clusters. The k-Means (Fast) utilizes the Triangle Inequality to quicken the k-Means calculation. There are also another kinds of clustering algorithms such as XMean, KMediods, DBSCAN, Expectation Maximization Clustering, Random Clustering, Agglomerative Clustering and Flatten Clustering. The design of KMean [2] and Flatten Clustering are shown in Figure 4. We have utilized all these algorithms for analysis. VI.
PERFORMANCE EVALUATION OF CLUSTERING ALGORITHMS FOR THE PROPOSED DATASET The data set is evaluated based on different clustering algorithms provided through RapidMiner Studio 7.3. In table II , we have mentioned some useful evaluation parameters. The parameters are obtained from the Log table created by the Log
Comprehensive Analysis is performed in figure 5. Which states that there is a big variability about the values of the analysis parameters among the clustering algorithms. The analysis shows that flatten clustering is a better option if CPU execution is considered. XMean,KMediod, DBSCAN, Expectation Maximization, Random and Agglomerative clustering have equally better performance in case of CPU Time. KMean(Fast) has a better performance for execution time. XMean is very much better for loop time and also in case of over all time of clustering. VII.
OUT-LIER DETECTION AND REMOVAL IN THE PROPOSED DATA SET
Outliers [17] are those data which are effecting the over all results of the operations on the data. These outliers are quite different from the other data in the dataset and are due to some errors in the dataset creation. In most bigger samplings of information, a few information focuses will be further far from the mean than what is regarded sensible. This can be because of orderly mistake or defects in the hypothesis that created an accepted group of likelihood dispersion, or it might be that a few perceptions are a long way from the focal point of the information. Anomaly focuses can in this way show flawed information, incorrect methodology, or territories where a specific hypothesis won’t not be substantial. In any case, in substantial specimens, a little number of anomalies is not out of the ordinary situation. For 10 outliers detection and removal process is shown in Figure 6. The outliers are detected through Detect Outlier (Distance) operator which utilizes the Euclidean distance function, removed through Filter Example and displayed the data without outliers through Select Attribute operator.
4|P age
TABLE II.
CLUSTERING ANALYSIS FOR THE PROPOSED DATA SET Clustering Algorithms Evaluation Parameters
10
Expectation Maximization Clustering
10
Random Clustering
10
Agglomerative Clustering
10
Flatten Clustering
1.0
1.0
1.0
1.0
1.0
1.23078E11
9.22687E11
9.250937E11
7.015625E9
6.25E7
1.48252E12
0.0
256532.0
0.0
225217.0
0.0
1151280.0
0.0
8.400263E7
0.0
314083.0
6.25E7
1827.0
1.0
2.0
3.0
3.0
3.0
2.0
1830.0
System Manufacturer
DBSCAN
1.78125E9
0.0
434.0
Operating System
1000
10
1.0
1.734375E9
432.0
7064.0
Processor
18
1000
KMediods
1.0
3.75E8
7062.0
1196.0
RAM
18
1000
10
XMean
3.75E8
4.96875E9
1193.0
1196.0
3072 MB
Windows 10 Pro 32-bit
ToshibaSatellite C660
7064.0
3072 MB
Intel(R) Core(TM) i5-2410M CPU @ 2.30GHz
Windows 10 Pro 32-bit
ToshibaSatellite C660
434.0
3072 MB
Intel(R) Core(TM) i5-2410M CPU @ 2.30GHz
Windows 10 Pro 32-bit
ToshibaSatellite C660
3072 MB
Intel(R) Core(TM) i5-2410M CPU @ 2.30GHz
Windows 10 Pro 32-bit
ToshibaSatellite C660
2.0
3072 MB
Intel(R) Core(TM) i5-2410M CPU @ 2.30GHz
Windows 10 Pro 32-bit
ToshibaSatellite C660
3.0
3072 MB
Intel(R) Core(TM) i5-2410M CPU @ 2.30GHz
Windows 10 Pro 32-bit
ToshibaSatellite C660
3072 MB
Intel(R) Core(TM) i5-2410M CPU @ 2.30GHz
Windows 10 Pro 32-bit
ToshibaSatellite C660
3.0
3072 MB
Intel(R) Core(TM) i5-2410M CPU @ 2.30GHz
Windows 10 Pro 32-bit
ToshibaSatellite C660
2.0
3072 MB
Intel(R) Core(TM) i5-2410M CPU @ 2.30GHz
Windows 10 Pro 32-bit
ToshibaSatellite C660
1830.0
3072 MB
Intel(R) Core(TM) i5-2410M CPU @ 2.30GHz
Windows 10 Pro 32-bit
ToshibaSatellite C660
Time (Millisecond)
10
18
1000
10
1.0
4.96875E9
1.109375E9
Loop Time (Millisecond)
9
18
1000
10
KMean (Fast)
1.0
1.109375E9
Execution Time (Millisecond)
8
18
1000
10
KMean (Kernal)
1.0
CPU Time (Nanosecond)
7
18
1000
KMean Standard
CPU Execution (Nanosecond)
6
18
1000
10
Apply Count
5
18
1000
Clustering Algorithm
4
18
1000
No, of Clusters
3
18
No, of Records
2
No, of Attributes
SNo. 1
Intel(R) Core(TM) i5-2410M CPU @ 2.30GHz
1.0
3.0
5|P age
Fig. 6. Outlier Detection and Removal Process
Fig. 4. Evaluation Analysis Graphs
For this purposes, we have obtained the data of multiple software systems through academia and industry of Pakistan. The data is capable through multiple clustering and other statistical algorithms. The dataset is denoted and is available for downloading for research purpose. Hope that there must be some useful and encouraging responses from researchers. REFERENCES Neha Patki, Roy Wedge, Kalyan Veeramachaneni, The Synthetic data vault, IEEE International Conference on Data Science and Advanced Analytics,2016. [2] R.P.T.H. GunaSekara and M.C Wijegunasekara, Comparasion of Major Clustering Algorithm Using Weka Tool, 24th International Conference on Advances in ICT for Emerging Regions , 2014. [3] UCI Machine Learning Repository, http://www.ics.uci.edu/ mlearn/MLRepository.html. [4] Rachsuda Jiamthapthaksin, Christoph F. Eick, Vadeerat Rinsurongkawong, An Architecture and Algorithms for Multi-Run Clustering, IEEE , 2009. [5] Hao Xiang, A new multi-core software architecture for improvingCUR in LTE Layer1 DSP/SoC,International Conference on Connected Vehicles and Expo (ICCVE), 2013 [6] Malik.S, Dealing with the Crosscutting Structure of Software Architectural Styles,Computer Software and Applications, COMPSAC ’08. 32nd Annual IEEE International, 2008. [7] Chintan Shah , Anjali Jivani, Comparison of Data Mining Clustering Algorithms,IEEEE, 2016. [8] Karshiev Zaynidin,Ivan Kholod, Block structure of data mining algorithms,IEEEE Nirma University International Conference on Engineering (NUiCONE),2013. [9] Oswaldo Moscoso-Zea,Sergio Lujn-Mora, Educational data mining: An holistic view,11th IEEE Iberian Conference on Information Systems and Technologies (CISTI),2016. [10] Chengjun Wang, Applying Pattern Oriented Software Engineering to Web Service Development, IEEE International Seminar on Future Information Technology and Management,2008. [1]
Fig. 5. Outlier Detection and Removal Process
The figure 7 shows the graph for outlier detection. There are 990 records which are false outliers with blue color and 10 records which true outliers with red color. VIII.
CONCLUSION
Software systems are getting more and more complex day by day and is becoming a great deal of interest for software reusability, testing and maintenance. Software architectural styles play a vital role in defining the type of software system to be developed. There are multiple data sets for many other areas such as artificial intelligence, image processing , data mining. But there are limited data sets available for software systems mostly for bugs processing. So there is needed a data set which defines the software architectures for real systems.
6|P age
[11] MATLAB Documentation, https://www.mathworks.com/products/matlab.html. [12] How to Use CSV Files, https://www.imf.org/external/help/csv.htm [13] Datae Set File Formats, https://docs.openclinica.com/3.1/openclinicauser-guide/export-datasets/formats-dataset-files [14] Rapidminer 7.3, http://docs.rapidminer.com/studio/releases/changes7.0.0.html
[15] Shraddha Dwivedi; Paridhi Kasliwal; Suryakant Soni , Comprehensive study of data analytics tools (RapidMiner, Weka, R tool, Knime), IEEE Symposium on Colossal Data Analysis and Networking (CDAN),2016. [16] Andrew Chishholm , Exploring Data with RapidMineer, Packet Publishing Ltd, Birmingham , UK ,2013. [17] Simson L. Garfinkel, Nicole Beebe; Lishu Liu, Michele Maasberg, Detecting threatening insiders with lightweight media forensics,IEEE International Conference on Technologies for Homeland Security (HST),2013.
7|P age


![[PDF]Review Designing Software Architectures: A ... - Google Sites](https://m.moam.info/img/260x300/pdfreview-designing-software-architectures-a-googl_64788e43097c474b228d5383.jpg)