DC/DC Converter Parametric Models for System level Simulation R. Prieto, L. Laguna, J.A. Oliver and J.A. Cobos Universidad Politécnica de Madrid Centro de Electrónica Industrial (CEI) c/ José Gutiérrez Abascal, 2 28006 Madrid. SPAIN. e-mail:
[email protected]
• Abstract-The objective of this work is to propose a whole solution for simulating power systems based on the use of behavioral DC/DC converter models. The proposed model is a generic model whose parameters can be obtained from datasheets (especially useful to model commercial converters) or equivalent tests. The model has configurable features which can be activated or disabled in order to perform optimal simulations or to generate models with different levels of abstraction to be used in a top-down design methodology. I. INTRODUCTION In the analysis, design and verification of power distribution systems, simulation is a decisive tool in order to assure its overall performance and reliability. Several studies have shown that the earlier knowledge of the system increases the design freedom and reduces the total committed cost [1]. In a top-down design methodology approach, the requirements of the models for simulation of systems are different than the ones needed for simulating a single converter. In order to design a system, models of its subsystems with the adequate level of abstraction are needed. When simulating a single converter, the information that the designer wants to get from its model are more detailed voltage and current stresses waveforms. The fact of knowing all this information costs simulation time. When designing power systems at a higher level of abstraction, the use of detailed models for each component does not provide any advantage. II. PROPOSED MODEL When the power system is designed using commercial converters, the information available to model DC/DC converters is restricted to the datasheet. The topology of the converter is not available, and then it will be assumed that it is no possible to design a custom experiment to carry out the identification process. The characteristics of the proposed models are as follows: •
• • •
Generated based on the information provided by manufacturers in datasheets and in measurements of equivalent test. Generated according to the user requirements for each test. Optimized for speed in simulation. Implemented in VHDL-AMS for exchangeability.
The key element of this modeling approach is the selection of the model structure based on the nature of the DC/DC converter and the available knowledge about its behavior. The model is constructed from its basic power processing behavior (assuming infinite control bandwidth) and then, additional elements are added to include dynamic effects: inrush current, output voltage dynamics, protections and start-up (delays and soft-start). A. Power processing model (static model) As said above this model assumes that the converter reaches the steady-state conditions instantaneously, therefore the voltage of one output can be expressed as: vout = vo + f v ( vin ) − f x ( iout )
Where vo represents the nominal output voltage, fv(vin) is the line regulation effect, and fx(iout) the load regulation voltage drop. The input current of the converter is obtained from the power balance equation: i in =
1 v ⋅i ⋅ out out η ( vin ,iout ) vin
(2)
In equation (2) the efficiency (η(vin,iout))is represented as a function of the input voltage and the output current. These equations can be modeled with the following circuit: The functions fv(vin), fx(iout) and η(vin,iout) can be implemented in a simulator by defining a look-up table that contains the characteristics of the converter. Another approach is to use curve fitting functions to obtain an expression (for example a polynomial) to model the behavior of the converter.
Behavioral models independent of the structure of the actual converter.
978-1-422-2812-0/09/$25.00 ©2009 IEEE
(1)
292
Authorized licensed use limited to: Univ Politecnica de Madrid. Downloaded on May 09,2010 at 18:41:07 UTC from IEEE Xplore. Restrictions apply.
f v ( vin ) − f x ( iout )
iout
vin iin
vo
a) b)
vout
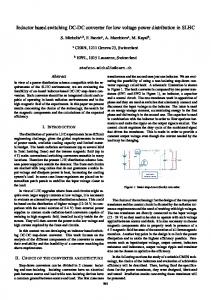
Figure 3. a) Remote control state diagram b) Remote control turn-on and turn off simulation.
Figure 1. Power processing model of DC/DC converters
D. Thermal model
B. Large signal Dynamic model
Excluding the switching frequency and other high order effects, high frequency dynamics can be added to the static model. Typical information that manufacturers provide can be a waveform or data about the inrush current and transient response. In order to capture these data the model proposed is shown in figure 2:
The thermal model is based on the parameters given by the manufacturer like the thermal resistivity and thermal capacity. The thermal model is approximated by a first order equation that simulates the gradual heating of the converter. The circuit used to simulate the thermal model is shown in figure 4.
Rd
Lin Rin
Lout
Cin
Figure 4. Thermal model
Cout
E. Cross regulation Figure 2. Equivalent circuit for input and output dynamic behavior
The dynamic model is based on the Wiener-Hammerstein structure, in this case, the model is defined by three blocks where the first represents the input impedance of the converter, the second is the static model presented in the previous section and the third is the output impedance. The values of the components that compose dynamic model are calculated using numerical techniques to fit the dynamic response of the model to the available data.
C. Event driven behavior
Control signals and protections play an important role in large signal stability of distributed power systems. These events modify the model behavior and must be taken into account. Using the capabilities of mixed-signal simulators, the event driven behavior is implemented as state machines where a different set of equations is used for each state. The features implemented in this model are: Input voltage protection, Output over voltage protection, Over temperature protection and Remote control. The model also takes into account the associated delays in the turn-on and off. The figure 3.a shows the event behavior of the remote control. Figure 3.b shows a simulation of the output voltage and the control signal.
978-1-422-2812-0/09/$25.00 ©2009 IEEE
The model introduces the behavior due the dynamic outputs interactions in multi output converters. In this case the equation (3) is used in the place of equation (1). Vout 1 = Vo1 + f v ( Vin ) − f v ( iout ) − R12 ( iout 2 ) − R11 ( iout 1 ) (3)
In equation (3), the function Rmn represents the influence of the output n over the output m. When the output m is a regulated output, it is expected that the influence of output n vanish after some time due to the feedback loop. This is implemented as shown in figure 5.a, where a dependent current source is added with a gain kmn that is expressed as: k mn =
ΔVomn max Δim ⋅ ΔVomm max Δin
(4)
Where ΔVomnmax is the maximum deviation of output voltage m due to the load step ΔIn in output n. It can be noticed that this influence will vanish in steady state due to the parallel inductor (figure 5.a). In the case of a non regulated output, the model is shown in figure 5.b, where the function Rmn(ioutn) is the voltage drop of the output m as function of the current in output n. The function Rmn(ioutn)can be implemented as a look-up table, or as a constant value.
293
Authorized licensed use limited to: Univ Politecnica de Madrid. Downloaded on May 09,2010 at 18:41:07 UTC from IEEE Xplore. Restrictions apply.
k12 ⋅ iout2
More information about the validation of this model can be found in [2][3].
iout1
IV. LEVELS OF ABSTRACION OF THE MODELS vo 1
Three levels of abstractions for the models are defined in this paper: the static level, dynamic level and the dynamic plus event driven behavior level. The static can be used for any steady-state calculation such as losses, efficiency, temperature and also other calculations that involve dynamic behavior such as average losses. The models built at this level are very fast models because they do not implement any high order effect.
vout1
R12 ( iout2 )
vo1
vout1
Dynamic models can be specially used to analyze the interaction among the components of the power system once it has reached the steady state, for example voltage drop due load steps, and small signal stability.
Figure 5. Dynamic cross-effect modeling: a) regulated output b) unregulated output
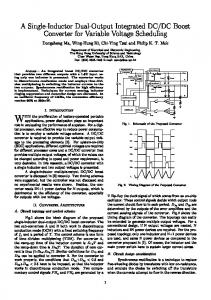
III. MODEL VALIDATION The model has been validated by means of actual measurements on several DC/DC converters. Both static and dynamic test have been performed in order to establish the scope of these models, among them, a Lambda X series DC/DC converter (X15-48S05) has been modeled and measured. Comparisons between the simulated and actual measures of the dynamic behaviors can be seen in figure 6.
a)
The dynamic plus event driven behavior models are specially used for large signal stability because it involves highly nonlinear effects of the converters such as protections. These models are a little bit more complex than the dynamic only models and tent to be slightly slower, but compared with other modeling approaches such as averaged models that are topology dependent, these behavioral models are faster. In the following section will be presented some use cases of the models in tests that require different levels of abstraction. V. CAD TOOL In order to simplify the modeling process, a software tool has been developed that allows the user to easily obtain the behavioral model of a DC/DC converter. This tool simplifies the capture of the parameters and generates a model according to the provided data or the level of abstraction that is suitable for each test. The tool described in this paper eases the development of simulation models of power converters, providing a friendly interface to capture the converter data and quickly generate the necessary models to validate the power system. The model used in the parameterization tool for the DC/DC converter is based on the model presented in [2]. The basic model that is generated is a static DC/DC converter; this model is a simple but fully functional converter. Over this basic model many other features can be added depending on the user requirements as show in figure 7. Some of these features are: • • • • • • •
b)
Figure 6. Dynamic response: a) output voltage transient b) inrush current
978-1-422-2812-0/09/$25.00 ©2009 IEEE
Dynamic behavior Thermal behavior Protections Multiple outputs Cross regulation Current share Remote control
294
Authorized licensed use limited to: Univ Politecnica de Madrid. Downloaded on May 09,2010 at 18:41:07 UTC from IEEE Xplore. Restrictions apply.
The software is designed with a friendly user-interface and each feature can be added or removed in a simple way.
The figure 9 shows a system that consists of one converter that reduces the voltage from 330 to 100 V to feed a 100 V bus in which are connected three converters of 30 V. In this test the total losses for two points are calculated, in the graphic are shown the input power provided by the battery and the total losses in the four converters. In this test, the models of the four converters are static models.
B. Transient response Figure 7. DC/DC converters features.
To evaluate the performance of a power system it is necessary that the models allow the obtaining of the following information when simulating the complete system • • • • •
Dynamic responses can be specified with interactive controls that were designed to quickly capture the data giving the possibility to view graphically and numerically the modeled response, a screen capture is shown in figure 10.
Efficiency Transient response Temperature calculation Fail Tests Stability
A. Efficiency
The efficiency curve of the converter is set with an interactive control that allows specifying a curve by a look-up table. Figure 8 shows a screen capture of the software, it can be seen where the general parameters of the converter like the efficiency curve and thermal model are captured. Figure 10. Dynamic response dialog capture.
Figure 8. Screen capture of general parameters tab.
Figure 11. Dynamic response simulation
In the figure 11 it is shown a two converter system with an intermediate 28 V bus. The inrush current at startup of the 12V converter is presented in the graphic. The transient response of the 12 V converter is show when a load step occurs at 100ms. In this example the model used for all converters are the dynamic models. Figure 9. Calculating the looses in a system for different loads
978-1-422-2812-0/09/$25.00 ©2009 IEEE
295
Authorized licensed use limited to: Univ Politecnica de Madrid. Downloaded on May 09,2010 at 18:41:07 UTC from IEEE Xplore. Restrictions apply.
C. Temperature calculation
The thermal behavior is another point of interest. The temperature of the converter is calculated with the power dissipation of the converter and the thermal resistivity value from datasheets. The heating of the converter can be modeled as static or dynamic. The dynamic model simulates the gradual heating of the converter. In the example of figure 12 it is presented a simulation of both models for the same power dissipation. The dynamic model rises from ambient temperature (35ºC) to 40 ºC in 80 seconds; the static model calculates the steady state temperature for each point.
Figure 13.Paralelized converters failure simulation.
As shown in this example it is not only necessary to detect a failure, but also to verify if the system is able to overcome the failure.
E. Stability
All the examples above represent systems with only a few converters. In real systems there are other components like filters, PFCs, etc. Even when each individual converter is stable, the overall performance of the system may be unstable or can present undesired dynamic response.
Figure 12.Static and dynamic thermal model simulation for the same power dissipation.
D. Fail tests
The model can incorporate the protections of the real DC/DC converter in order to simulate the converter response under real conditions. The simulated protections are: • • • •
Input Under-voltage and Over-voltage turn on and turn off. Output over-voltage Over temperature. Over current
Other kinds of failures can occur as simulation in figure 13 illustrates. In the example there are three parallelized converters (with current share option) and at 80 ms one of them fails; the other two converters provide the necessary current.
978-1-422-2812-0/09/$25.00 ©2009 IEEE
Figure 14. Stability verification, a correct and incorrect filter design.
The example in figure 14 shows a converter with an input filter. In the first graphic the filter is an incorrect design that makes the input current to oscillate for a long time; the second graphic is a correct design.
296
Authorized licensed use limited to: Univ Politecnica de Madrid. Downloaded on May 09,2010 at 18:41:07 UTC from IEEE Xplore. Restrictions apply.
REFERENCES [1] Fabrycky W.J. and Blanchard B.S.“Life-Cycle Cost and Economic Analysis” Prentice Hall, Englewood Cliffs, NJ, 1991. [2] Oliver, J.A.; Prieto, R.; Romero, V.; Cobos, J.A. “Behavioral Modeling of Multi-Output DC-DC Converters for Large-Signal Simulation of Distributed Power Systems” Power Electronics Specialists Conference, 2006. PESC '06. 37th IEEE 18-22 June 2006 Page(s):1 – 6 [3] Oliver, J.A.; Prieto, R.; Romero, V.; Cobos, J.A.; “Behavioral modeling of dc-dc converters for large-signal simulation of distributed power systems” Applied Power Electronics Conference and Exposition, 2006. APEC '06. Twenty-First Annual IEEE 19-23 March 2006 Page(s):6 pp.
Figure 15. A complete aircraft power distribution system.
The last example is a complete system that could be an aircraft distribution scheme (figure 15). This system contains eight converters with different characteristics. This system was simulated using almost all features of the CAD tool that has been developed. The simulation time for this complete system producing load changes, failures and other interactions takes less than 15 seconds for 100ms performing several transient tests. This system was simulated Simplorer, in a Pentium IV computer with 512 MB of RAM.
[4] Peter J. Ashenden, Gregory D. Peterson, Darrell A. Teegarden. “The System Designer's Guide to VHDL-AMS: Analog, Mixed-Signal, and Mixed-Technology Modeling” Publisher:Morgan Kaufmann
V. CONCLUSIONS
[6] Chung-Wen Ho; Ruehli, A.; Brennan, P. “The modified nodal approach to network analysis” Circuits and Systems, IEEE Transactions on, Volume 22, Issue 6, Jun 1975 Page(s):504 – 509
Since the simulation requirements for systems are different than the ones for circuits, a new modeling strategy must be selected in order to obtain useful design information from the simulation. This work presents a whole solution for the simulation of DC/DC converters working in systems. A new DC/DC model based on the behavior of the converter has been presented. The parameters of the model can be obtained from the manufacturer datasheets or from measurements. The model can be implemented in circuit oriented simulators, or using hardware description languages for system simulations. The VHDL-AMS version of the model has been optimized for speed and is especially suitable for simulation of large power distribution systems.
[5] Doboli, A.; Vemuri, R. “Behavioral Modeling for HighLevel Synthesis of Analog and Mixed-Signal Systems From VHDL-AMS”. Computer-Aided Design of Integrated Circuits and Systems, IEEE Transactions on, Volume 22, Issue 11, Nov. 2003 Page(s):1504 – 1520
[7] Sun, J.; Grotstollen, H. “Symbolic analysis of switching power converters based on a general averaging method” Power Electronics Specialists Conference, 1996. PESC '96 Record., 27th Annual IEEE, Volume 1, 23-27 June 1996 Page(s):543 - 549 vol.1 [8] Thottuvelil, V.J.; Chin, D.; Verghese G.C. “Hierarchical approaches to modeling high-power-factor AC-DC converters” Power Electronics IEEE Transactions on, vol. 6, no 2 pp. 179-187, Apr 1991
Depending on the test to be performed, different levels of abstraction can be specified for the models in order to speedup the simulations. The models can be used to validate complete power systems and provide information like efficiency, transient response, thermal behavior, failures and stability in a short simulation time. A CAD tool for the generation of the models has been developed and it is also presented in this work.
978-1-422-2812-0/09/$25.00 ©2009 IEEE
297
Authorized licensed use limited to: Univ Politecnica de Madrid. Downloaded on May 09,2010 at 18:41:07 UTC from IEEE Xplore. Restrictions apply.