Vol 19, No. 10;Oct 2012
Decision Support System Including Fuzzy Logic and Multi-resolution Wavelet Network Modeling For Content-based image retrieval Mourad Zaied, Ikbel Ben Abdennour and Chokri Ben Amar REsearch Group on Intelligent Machines, National Engineering School of Sfax, B.P. W 3038, Sfax, Tunisia Higher Institute of Computer and Multimedia of Gabes, Erriadh City campus, 6075 Zrig Gabes, Tunisia Tel: 216-98-241-151
E-mail:
[email protected] /
[email protected] /
[email protected]
The General Direction of Scientific Research and Technological Renovation (DGRSRT), Tunisia, under the ARUB program 01/UR/11/02. This research is financed by:
Abstract In this paper, we propose a new structure of indexing and images retrieval process based on feature extraction by multi-resolution wavelet network (MRWN) modeling and a Fuzzy Decision Support System (FDSS) for measuring similarity. First, each query image is modeled by a MRWN of hybrid and optimal architecture, then, for the determination of visual characteristics called low levels, this network is used. The moments calculated using detail weights of the MRWN for different levels will form together the shape descriptor while the energies of the approximation weights are computed to determine texture descriptor. The FDSS is used to determine the closest benchmark images to the query image in term of texture and shape. Sorting images is then performed by a proposed algorithm measuring the degree of similarity in color between the query image and the images resulted from the decision by fuzzy logic. Keywords: CBIR, Fuzzy Decision Support System, Multi-resolution Wavelet Network, Features
Extraction, Colored Balls Algorithm. 1. Introduction The development of the computing and the easy use of digital cameras, which does not stop to grow, promoted the spread of digital photography on Internet. It is not rare to have numeric picture archives containing several thousand images. So, users need tools which could help in the effective management and in the fast access to these picture archives. To manage and use effectively these picture archives, a system of indexation and search for images is necessary. There are two main techniques of image retrieval. The first technique is based on the text (Text-based Image Retrieval: TBIR). It suffers from several anomalies and constraints, namely the manual annotation considered very expensive in that time, the diversity of languages and the limitation of terms to express the content of an image in words [1]. In order to overcome thees deficiencies, a second technique is proposed. Indeed, this latter approach is based on the visual content of images (Content-Based Image Retrieval: CBIR) [2]. The general principle of image retrieval by content takes place in two stages. Besides the research
200
[email protected]
Vol 19, No. 10;Oct 2012
phase that takes place online, the preliminary phase of indexing is to calculate and store, offline, the characteristics of the images. Figure 1 shows the two steps for image retrieval by content. QBIC (Query By Image Content) is the most CBIR technique used. Created in 1995, it is based on the research according to information contained in the texture, the shape and the color extracted from the images [3]. The representation of an image in the Fourier space allows only one access to the frequential information while the representation in the continuous base of the distributions of Dirac just gives the temporal information. However, wavelet analysis has an advantage to access simultaneously to both, frequential and temporal informations. The technique of multi-resolution analysis (MRA) allows studying signal in frequency-time space by computing approximation and detail coefficients in various levels. Those coefficients, the wavelets and scaling functions used for decomposition will represent the weights and the activations functions of the MRWN. The idea of creating wavelet networks is back to Zhang and Benveniste [4] and then to Pati [5] in their works for the introduction of wavelets in neural networks. Image modeling with WN promoted the extraction of information representing the content and representation of low-level characteristics as vectors in order to compare them and determine the images having the closest characteristics. The operation of the wavelet approach in the field of image processing is a recent technique and is attracting more and more works due to the qualities of research results obtained and the capacity to improve and optimize approaches already proposed. The tendency of such research is directed mainly towards the use of the wavelet transform for compression [6], denoising [7], texture analysis [8] [9] and full other applications. With the variety of works on image retrieval by content, several approaches have emerged to develop techniques for determination of various descriptors (color, shape, texture) that characterize the possible content of the images. In the search by color, histogram is the color representation used in most systems, image retrieval and tracking systems [10]. In this same sense, the method for calculating dominant color descriptor is passed by several works [11]. Swain and Ballard [12] proposed a method of intersection of histograms for the measurement of the common part between two ones. A study compares six color spaces and proves that the HSV is the most effective image retrieval by content [13] and another showed that the representation of pixels in HSV instead of RGB makes a general improvement accuracy and robustness [14]. For these reasons, the choice of color space for color representation is preferred for several jobs, such as calculation of the similarity between two color images. Concerning the texture, many studies have been proposed to describe it, the main methods were: static methods, spectral methods and structural methods. Among the most commonly used techniques of statistical representation of texture: The technique of co-occurrence matrix [15], proposed by Haralick, characterized by its simplicity of implementation. Smith and Chang used the wavelet analysis [16] to compute statistics parameters (mean and variance) extracted from the wavelet sub-bands characterizing the texture. Despite the large number of techniques for determining the shape descriptors, it was possible to classify them into two categories: One based on the whole shape and the other on the contour. There are several descriptors based on the contour, the most known are the Fourier ones and others based on the region, that is to say, taking into account all pixels forming the shape. The most current used methods are: The theory of moments, the geometrical moment, Zernike, Legendre moments of Hu, etc. In this paper, we are interested, principally, in the development and implementation of a Decision Support System including fuzzy logic for image retrieval by content. Starting from the diagram structure of the application presented in Section 2, we identify the steps that must be validated by each acquired image. Section 3 describes an overview of the wavelet theory and the creative process of WN for modeling an image. The use of a proposed WN filter and its use to compute the shape descriptor are explained in Section 4. Section 5 contains the method for determining texture descriptor. Section 6 presents our approach of comparing descriptors using fuzzy logic decision. In Section 7, we present
201
[email protected]
Vol 19, No. 10;Oct 2012
our new algorithm of comparing image colors. Section 8 contains the experimental results and their interpretations. Finally, this study ends with a conclusion and perspectives.
2. Synoptic diagram of the proposes approach We propose in this paper a new methodology of indexing and images retrieval by the contents of which the structure is descripted in the (figure 1). After the acquiring and normalization of the image's size, format and color coding, a wavelet network model is created in order to extract features of the form and the texture into descriptors. At this stage, there is the opportunity to register these vectors and hence the addition of the acquired image in the database or doing a search of similar images while comparing the texture and shape descriptors using FDSS. The images obtained must be classified in ascending order of color similarity from the query image by applying a proposed comparing color algorithm. Finally, the process ends with displaying the images in the database that are similar to the query image. Our main contribution through this study concerns the establishment of a new structure for indexing and image searching by content, the development of a filter detection of a form based on WN more reliable than usual ones, the proposition of a FDSS and the creation of a new method of measuring degree of similarity between colors of two images.
3. Wavelet analysis and MRWN modeling Wavelets are mainly used for the decomposition of signals by representing them using weighted sums of dilated and translated functions a ,b of one original function of L2(IR) called "mother wavelet" to obtain continuous or discrete wavelet transforms allowing access to time-frequency information of the analyzed signals.
a , b (t )
1 a
(
t b ) with a 0, b IR a
(1)
The MRA analysis is a technique of wavelet theory mostly used in the field of image processing. It uses the wavelet transform in different levels of resolution providing space-time analysis with accuracy on the frequency or time that depend on the nature of the signal studied [6,16]. The decomposition of an original signal by the MRA method allows determining all analyzing wavelets and scaling functions φ and also all the details and approximation coefficients ν and ω. This technique allows the hierarchical decomposition of an image at each level into four sub-images with size reduction to half while taking on each level the matrix approximation obtained to be the image matrix to decompose (Figure 3). The reconstruction of a decomposed signal is done by the combination of all the details found in each stage of decomposition and the last approximation to the final reconstruction of its original shape
202
[email protected]
Vol 19, No. 10;Oct 2012
(Figure 4). There is another simpler and faster method called fast wavelet transform (FWT) that allows the decomposition of a signal by using a pair of complementary filters (in quadrature): Low pass filter H(f) for estimating the general shape of the signal Ak and another orthogonal high pass filter G(f) providing the estimation of details Dk characterizing the rapid variations of the signal. The wavelet coefficients are the output samples of each filter [6] (Figure 5). Similarly, reconstitution of the signal can be done by filter method using a simpler and faster algorithm using inverse filters H and G respectively denoted HI (z) and GI (z). WN used in this paper are multi-resolution ones (MRWN) [17], they are formed mainly by weights, wavelets and scaling functions corresponding to the MRA of images. To learn those networks, it is necessary to prepare a library containing those values determined for different levels of MRA decompositions of images. The weights of different levels of decomposition are obtained by the FWT algorithm. The candidate functions to join the hidden layer of the network are wavelets and scaling functions of the inverse wavelet transform. The application of an incremental algorithm [17, 18, 19,20] allows the determination of the contribution of each function in the library and chooses that having the most important contribution, making possible to recruit for each time a neuron in the hybrid WN at the hidden layer with the most relevant function selected. This algorithm allows an optimization of network while reducing its size by the limitation of the number of neurons on the hidden layer and the reduction in the time of training (Figure 6). In our application, we limited the number of levels of MRA to five by taking into account the size of images used and the small contribution of information representing images of more than five iterations. Therefore, images must be represented by hybrid and optimal WN, each containing five stages and a number of weight, wavelets and scaling functions vary from one image to another.
4. Shape descriptor The shape descriptor characterizing the content of an image is obtained after validation of the following steps: firstly an application of an improved filter shape on the image is applied and a binary image is created. Secondly, using this resulted image, moments are computed to form the shape descriptor. 4.1. Improved filter for shape detection We used a technique of pattern detection based on MRWN while making the sum of the detail weights in horizontal, vertical and diagonal found in the first level of decomposition of an image. Our addition is based on the elimination of disturbing elements coexisting with the principal object or objects to be detected. First, we count the number of colors in the border of the image, if this number is higher than a prefixed threshold, that is to say, it is probable that exist other disruptive patterns, therefore, we delete these colors from the image. The image is then modeled by MRWN and then the matrix sum of the three matrices of vertical, horizontal and diagonal details containing all weights of details extracted from the first stage of WN model representing the query image is determined. Finally, we apply a
203
[email protected]
Vol 19, No. 10;Oct 2012
thresholding to the result matrix to produce a binary image. The application of proposed WN filter on the "Lena Soderberg" image which contains an interesting mix of details, textures and uniform regions, gives a very interesting result comparing to the Sobel one. Also, this filter generates good results for a great number of images containing different objects (Figure 7). 4.2. Calculation of the moments The application of our proposed filter allows the transformation of the query image into a binary image with the ones representing the features of the main object. In order to accumulate more information about the content characterizing the shape, we compute the moments on four small images obtained after subdividing the image into four equal parts. The formula for moments is the following [12]:
M p , q x p y q I ( x, y ) x
(2)
y
p and q correspond to the level of the moment and I (x, y) represents the value of pixel at position (x,y). The moments calculated for different wavelet level analysis of each sub-images will form together the shape descriptor.
5. Texture dexcriptor The method of computing texture descriptor is based mainly on measuring the energies of the approximation weights for each level of MRWN decomposition. First, we calculate the total energy of the image. Then, we determine the energies of weight approximation at each level of decomposition. In our case, we calculate the energies of the 5 stages of optimal MRWN. Finally, we form the texture descriptor by the energy values sorted in ascending order. The formula for calculating energy is as follows [15]:
Ek
1 MN
M
N
A(i, j )
(3)
i 1 j 1
With: M and N represent the dimensions of the matrix A containing the approximations and A(i,j) corresponds to the value at row i and column j.
6. Research Phase using FDSS The research phase is the most important phase in this work. After indexing the image and determining characteristics of the image in the form of vectors (descriptor shape and texture descriptor), it remains to find similar images from a query image. The Functional diagram of the research phase is given in Figure 8. The distances of similarity (shape and texture) of an image i are computed as follows:
204
[email protected]
Vol 19, No. 10;Oct 2012
m
d sfi
(D
d sti
(D
fr
( j ) D fi ( j ))2
(4)
tr
( j ) Dti ( j )) 2
(5)
j 1
n
j 1
With m : Number of element in vector of shape descriptor n : Number of element in vector of texture descriptor For example and by consideration the minimum and maximum distances of similarity shape of the database images Mindsf and Maxdsf the normalized value d sfni is calculated as follows:
d sfni
d sfi ( Mindsf ) ( Maxdsf ) ( Mindsf )
(6)
The internal configuration of the Fuzzy Decision Support System considers three stages: the Fuzzifucation, the Fuzzy inference and the Defuzzifucation [21]. 6.1. Fuzzifucation It’s a symbolic digital conversion. This step is to define, essentially, the membership functions for different variables (passage from real variables to the linguistic ones). The triangular membership functions are reserved in the present case and three sets for each normalized similarity distance are retained [22]. 6.2. Fuzzy Inference This step expresses the relationship that exists between inputs and the output variable by linguistic rules. The Fuzzy inference rules that manage the Fuzzy Decision Support System (FDSS) are summarized in the table given in (Figure 9). For example, the ith rule can be formulated as follows: If dsfni is LOW And If dstni is LOW, Then, The global similarity of image i ”Di” is VERY LARGE.
The Membership functions for two normalized distances (shape dsfni, texture dstni) and the Decision Di are given in the (Figure 10).
205
[email protected]
Vol 19, No. 10;Oct 2012
The MIN-MAX inference method is retained for the evaluation of the fuzzy rules contribution [22, 23]. This method assigns to the logical operation ”And” a minimum and to the logical operation ”Or” a maximum. 6.3. Defuzzifucation The defuzzication operation includes the numerical value of the Fuzzy Decision Support System output Di. The center of gravity method is used in this present case [22] in order to determine the normalized global degree of similarity. Sorting images is then performed by an algorithm measuring the degree of similarity in color between the query image and images resulted from the decision by fuzzy logic. 7. Sorting images by color pertinence To measure similarity between two color images, we create a new algorithm whose the idea is inspired from a simple game of drawing colored balls. Indeed, we modulate the two images to be manipulated by two baskets each one contains balls of different colors such that each basketball corresponds to a pixel of the image with its own color. As a first step, we make a draw of a ball for a basket 1 and compare its color to those balls of baskets 2. When we found one ball which resembles the color, we subtract the two. This operation must be repeated until the complete course of all the balls of basket 1 to make, in the final step, the sum of all the remaining balls in the two baskets. The resulting value corresponds to the color difference. We conclude that a color resembles another when it belongs to its “interval”. The interval of a color is obtained by transforming the value of the color di into an interval with lower and upper bounds obtained respectively by the subtraction and the addition of a value equal to (1/s) of the associated component, with s: is a non-zero integer prefixed in advance. (Figure 11) shows how to transform a colors di of an image i to intervals and test of the color of a query image to these intervals. 8. Simulation results In order to evaluate the decision performances of the proposed FDSS, a comparative study with the Classical Decision Support System (CDSS) [24] is performed. We evaluate the proposed method with various collections of images of two databases, the Wang database [25], and the OT database [26]. The first database contains 1000 images extracted from the well-known commercial COREL database. We divided the set into 500 trainings and 500 test images. The database contains ten clusters and 100 images per cluster representing semantic generalized meaningful categories such as “dinosaurs”, “horses”, “food”, “beaches”, “African people”, “buildings”, “buses”, “elephants”, “flowers”, and “mountains”. To give an impression of the data, some example images are depicted in (Figure 12). The second database consists of a total of 2688 images from 8 different categories: “mountain”,
206
[email protected]
Vol 19, No. 10;Oct 2012
“forest”, “inside city”, “highways”, “open country”, “coast”, “tall buildings” and “street” as shown on (Figure 13). We divide images into 800 trainings and 1888 test images. The evaluation performances retained in this case are the rate of good classification or the accuracy of a class P(Ci), Recall or sensitivity Se(Ci) of a class and specificity of a class Sp (Ci). - The accuracy of a class: it is the rate representing each reference which corresponds to the theoretical percentage chance of having a good classification.
p(Ci )
Ni ,i n
N
i, j
j 1
(7)
- The ratio (R) or sensitivity (Se): This index is obtained by dividing the number of images classified correctly by the number of images of the class available.
Se(Ci )
N i ,i n
N j 1
j ,i
(8)
- The specificity (Sp): It allows the measurement of how the test is effective when used on images of other classes that Ci. It is calculated by the following formula: n
Sp (Ci )
n
k 1, k i j 1, j i n n
k 1 j 1, j i
Nk, j
Nk, j
(9)
The evaluation of fuzzy system for decision support applied to the two database classes image retention is achieved through the confusion matrix, contains information about the actual decision and predicted the decision made by the system of decision support. This is a table comparing the predicted classes (columns) and the desired classes (lines) for examples of image-based test and the classification rate and partial way. The images of the classes ”Flowers”, ” Beaches”, ” Dinosaurs”, and ” Buses” of the Wang base, are classified
with
a
classification
rate
classes ”Buildings”, ”Elephants”, ”Horses”
(P(Ci))
of
100%.
The
images
of
the
and “Mountains” have a satisfactory classification rate.
The average classification rate for this base is 93.66%. We have also reached good results with the OT base. The classes “Street” and “Forest” are categorized without any error. The other classes have acceptable classification rates except “Open country” one.
207
[email protected]
Vol 19, No. 10;Oct 2012
However, the classification rates on the classes ”Food” (76.47%) and “Open country” (80.65%) are considered poor. This may be due to the intervention of the algorithm in color despite the precision offered by the fuzzy system for decision support providing a compromise between the distances of similarity shape-texture. According to Table 1 and Table 2, the results are very satisfactory in terms of classification. This shows the effectiveness of indexing by the WN input and the notable performance system decision support at the proposed image retrieval by content. A comparison of fuzzy system for decision support to a proposed system based on classical logic is performed. Table 3 and Table 4 give the sensitivity, the specificity and the accuracy in both cases (classical and fuzzy), reveal that the results recorded in the case of fuzzy system is far better than those recorded in the classic case. We compareed also our approach with pLSA-Based Image Models [25] and Boosting k-NN [28] approaches on the OT database (Table 5). The Results of global classification rate seem to be very promising and our approach provides better performance. The experimental results reported here prove the performance of our method in categorization images belonging to the two databases used and the proposed approach outperforms the other methods. This allows concluding once again that the decision based on the mode of human reasoning leads to good results in terms of image search by content. 9. Conclusion and perspectives In the present work, we developed and implemented a Fuzzy Decision Support System. This system evaluates the degrees of conformity (shape-texture) between a query image and a set of images in a database. Very satisfactory results are obtained relatively to the case where a classical Decision Support System is adopted. Indeed, practically, all recorded performance indexes (Accuracy, Sensitivity, Specificity...) of the retrieval are relatively good. Meanwhile, an improvement of the proposed technique is possible. Development and implementation of a Fuzzy Decision Support System including the color descriptor can be subject of future works in order to achieve further improvement and to reach enhanced performance. References [1] J. Manuel Barrios, D. Daz-Espinoza, and B. Bustos “Text-Based and Content-Based Image Retrieval on Flickr: DEMO”, Second International Workshop on Similarity Search and Applications, 2009. [2] T. Kato , ”Database architecture for contentbased image retrieval,” in Image Storage and Retrieval Systems, San Jose, California, 1992.
208
[email protected]
Vol 19, No. 10;Oct 2012
[3] S. Tollari, “Indexation et recherche d’images par fusion d’informations textuelles et visuelles”, Thèse de doctorat, Université du Sud Toulon-Var, 24 Octobre, 2006. [4] Q. Zhang, A. Benveniste, "Wavelet networks", IEEE Transactions on Neural Networks , vol.3, no.6, pp.889-898, Nov 1992 DOI: 10.1109/72.165591. [5] Y.C. Pati, P.S. Krishnaprasad. Analysis and synthesis of feedforward neural networks using discrete affine wavelet transformations. IEEE Transactions on Neural Networks, 4(1): 73–85, 1993. [6] C. Ben Amar, M. Zaied, and A. M. Alimi, “Beta wavelets. synthesis and application to lossy image compression”, Advances in Engineering Software, Vol. 36, No. 7, pp. 459–474, 2005. [7] S. Chang, B. Yu, and M. Vetterli, “Adaptive wavelet thresholding for image denoising and compression”, Image Processing, IEEE Transactions on, Vol. 9, No. 9, pp. 1532 –1546, Sep. 2000. [8] J. Liu and B. Zuo, “The recognition of fabric defects using wavelet tex- ture analysis and lvq neural network,” in Image and Signal Processing, 2009. CISP ’09. 2nd International Congress on, 2009, pp. 1 –5. [9] M. Gross, R. Koch, L. Lippert, and A. Dreger, “Multiscale image texture analysis in wavelet spaces,” in Image Processing, 1994. Proceedings. ICIP-94., IEEE International Conference, vol. 3, Nov. 1994, pp. 412 –416 vol.3. [10] M. Mikram, “Monitoring of objects in a sequence of images by appearance models: design and evaluation”, Ph.D. dissertation, University of Bordeaux, December 2008. [11] A. Znaidia, T. Zaharia and F. Preteux. “Une évaluation des descripteurs visuels MPEG-7 pour la recherche d’images par le contenu,” Hammamet, Tunisia, May 2009. [12] M. J. Swain et D. H. Ballard. “Color indexing”, International Journal of Computer Vision, Vol. 7, No. 1, pp. 11–32, 1991. [13] S. Lim & G. Lu. “Effectiveness and efficiency of six color space for content based image retrieval”, Proceeding of international workshop on content-based Multimedia Indexing CBMI, 2003. [14] R. Marée. “Classification automatique d’images par arbre de décision”. Thèse de Doctorat. Université de Liège. Février 2005. [15] T. Iftene and A. Safia, “Comparison between co-occurrence matrix and wavelet transform for the textural classification of the spot’s HRV (XS) images”, Télédétection, Vol. 4, No. 1, pp. 39–49, 2004. [16] I. Daubechies, Ten Lectures on Wavelets (CBMS-NSF Regional Conference Series in Applied Mathematics), 1st ed. SIAM: Society for Industrial and Applied Mathematics, June 1992. [17] O. Jemai, M. Zaied, C. Ben Amar and A. M. Alimi, “FBWN: an architecture of Fast Beta Wavelet
209
[email protected]
Vol 19, No. 10;Oct 2012
Networks for Image Classification,” 2010 IEEE World Congress on Computational Intelligence, WCCI 2010, the 2010 International Joint Conference on Neural Networks (IJCNN 2010), pp. 1953-1960, CCIB, Barcelona, Spain, july, 18-23, 2010. [18] R. Ejbali, M. Zaied, and C. Ben Amar, “Wavelet network for recognition system of arabic word”, International Journal of Speech Technology, Vol. 13,
No. 3, pp. 163–174, 2010.
[19] M. Zaied, O. Jemai, and C. Ben Amar, “Training of the beta wavelet networks by the frames theory: Application to face recognition”, in First Workshops on Image Processing Theory, Tools and Applications, 2008 IPTA 2008, pp. 1–6, 2008. [20] O. Jemai, M. Zaied, C. Ben Amar and A.M. Alimi, “Pyramidal Hybrid Approach: Wavelet Network with OLS Algorithm Based-Image Classification”, International Journal of Wavelets, Mutiresolution and Information Processing, Vol. 9, No. 1, pp. 1-20, 2011. [21] H. Bühler, ”Réglage par logique floue”, Presses polytechniques et universitaires romandes, Lausanne, 1993. [22] R. Ben Abdennour, P. Borne, M. Ksouri, and F. M’sahli, “Identification et commande numérique des procédés industriels”, Editions Technip, Paris, 2001. [23] E. H. Mamdani and S. Assilian, “An experiment in linguistic synthesis with a fuzzy logic controller”, Int. J.Man-Machine Studies 7 (1975), 1-13. [24] B. Guedri, M. Zaied and C. Ben amar, “Indexing and images retrieval by content”, IEEE 2011, International Conference on High Performance Computing & Simulation (HPCS’2011), Istanbul Turkey, pp. 369-375, July 4-8, 2011. [25] J .Z. Wang, J. Li, and G. Wiederhold, “Simplicity : semantics-sensitive integrated matching for picture libraries”. IEEE Trans. on Pattern Analysis and Machine Intelligence, 23(9) :947–963, 2001. [26] A. Oliva and A. Torralba. “Modeling the shape of the scene : a holistic representation of the spatial envelope”. International Journal of Computer Vision, pages 145–175, 2001. [27] E. Horster, T. Greif, R. Lienhart, and M. Slaney (2008). Comparing local feature descriptors in plsa-based image models. In DAGM-Symposium, pages 446–455. [28] P. Piro , R.Nock, F. Nielsen and M. Barlaud (2010). Boosting k-nn for categorization of natural scenes. [29] M. Zaied, C. Ben Amar, A. M. Alimi, “Award a new wavelet based Beta function. International conference on signal, system and design, SSD03, Tunisia 1, 185-91 2003. [30] M. Zaied, C. Ben Amar, A. M. Alimi, “Beta wavelet networks for face recognition”. Journal of decision systems 14 (1-2), 109-122 2005. [31] S. Said, B. Ben Amor, M. Zaied, C. Ben Amar, M. Daoudi, “Fast and efficient 3D face recognition
210
[email protected]
Vol 19, No. 10;Oct 2012
using wavelet networks”. Image Processing (ICIP), 2009 16th IEEE International Conference on, 4153-4156 2009. [32] S. Heni, R. Ejbali, M. Zaied, C. Ben Amar, “A Neural Principal Component Analysis for text based documents keywords extraction”. Next Generation Networks and Services (NGNS), 2011 3rd International 2011. [33] M. Zaied, S. Said, O. Jemai, C. Ben Amar, “A novel approach for face recognition based on fast learning algorithm and wavelet network theory”. International Journal of Wavelets Multiresolution and Information Processing 2011. [34] O. Jemai, M. Zaied, C. Ben Amar and M. A. Alimi, Faster Learning Algorithm of Wavelet Network Based on Fast Wavelet Transform, International Journal of Pattern Recognition and Artificial Intelligence, IJPRAI, Vol. 25, N° 8, pp. 1279-1319, 2011. [35] A. El Adel, M. Zaied, C. Ben Amar, “Learning wavelet networks based on Multiresolution analysis: Application to images copy detection” 2011 International Conference on Communications, Computing and Control Applications (CCCA’2011), Hammamet-Tunisia, March 3-5, 2011. [38] R. Ejbali, M. zaied and C. Ben amar, “Multi-input multi-output Beta wavelet network: modeling of acoustic units for speech recognition”, International Journal of Advanced Computer Science and Applications (IJACSA), Vol.4, N°4, April 2012. [37] O. Jemai, M. zaied, C. Ben amar and M. A. Alimi, “Faster Learning Algorithm of Wavelet Network Based on Fast Wavelet Transform”, International Journal of Pattern Recognition and Artificial Intelligence, IJPRAI, Vol. 25, N° 8, pp. 1279-1319, 2011. [38] N. Jaouadi, R. Ejbali, M. zaied and C. Ben amar, “The Impact of the Speaker's State on Speech Recognition”, accepted to be published in The Second IEEE International Conference on Communications and Information Technology ICCIT 2012, 18-20 December 2011, Hammamet, Tunisia. [39] M. Sakkari, M. zaied and C. Ben amar, “Hands tracking for Augmented Reality Applications”, the IEEE International Conference on Information Technology and e-Services (ICITeS'2012) , March 24-26 2012 Sousse, Tunisia. [40] N. Cherif, R. Ejbali, M. zaied and C. Ben amar, “Identification de thème dans une vidéo en se basant sur un système de reconnaissance de la parole”, 7ème Ateliers de Traitement et Analyse de l’Information : Méthodes et Applications (TAIMA'2011), Hammamet Tunisie, 3-8 Octobre, 2011. [41] R. Ejbali, M. zaied and C. Ben amar, “Intelligent approach to train wavelet networks for Recognition System of Arabic Words”, KDIR 2010, International Conference on Knowledge Discovery and Information Retrieval, Valencia Spain, pp. 518-522, October 25-28, 2010.
211
[email protected]
Vol 19, No. 10;Oct 2012
Tables Table 1. Confusion Matrix of several categories of Wang base Predicted categories
Real Categories
C1
C2
C3
C4
C5
C6
C7
C8
C9
C10
P(Ci)
Dinosaurs (C1)
50
0
0
0
0
0
0
0
0
0
100 %
Food (C2)
0
39
2
6
0
0
1
0
0
2
76.47 %
African people (C3)
0
0
44
0
3
0
3
0
0
0
88 %
Buildings (C4)
0
2
0
45
0
0
1
0
0
2
91.84 %
Buses (C5)
0
0
0
0
50
0
0
0
0
0
100 %
Elephants (C6)
0
2
0
1
0
47
0
0
0
0
92.16 %
Horses (C7)
1
0
0
0
0
0
48
1
0
0
94.12 %
0
0
0
0
0
0
0
50
0
Beaches (C9)
0
0
0
0
0
0
0
0
50
0
100 %
Mountains (C10)
0
1
0
1
0
0
1
0
0
47
94 %
Flowers (C8)
0
100 %
Table 2. Confusion Matrix of several categories of OT base Predicted categories
Real Categories
C1
C2
C3
C4
C5
C6
C7
C8
P(Ci)
Street (C1)
192
0
0
0
0
0
0
0
100 %
Coast (C2)
0
252
1
0
1
5
1
0
96.92 %
Mountain (C3)
1
0
260
0
0
4
0
9
94.89 %
tall building (C4)
1
0
1
253
0
0
0
1
98.83 %
Highway (C5)
0
2
0
1
155
1
1
0
96.88 %
Open country (C6)
3
33
15
0
3
250
4
2
80.65 %
Inside city (C7)
0
0
2
8
2
0
195
0
94.20 %
Forest (C8)
0
0
0
0
0
0
0
228
100 %
Table 3. The sensitivity, specificity and accuracy in the classical and fuzzy case of each Image Category of Wang base Category
212
Sensitivity
Specificity
Accuracy
Classical
Fuzzy
Classical
Fuzzy
Classical
Fuzzy
Dinosaurs
96.15%
98.04%
100%
100.00%
100%
100 %
Food
82.29%
88.64%
97.57%
97.38%
78%
76.47 %
African people
78%
95.65%
91.33%
98.68%
78%
88 %
Buildings
76.47%
84.91%
91.13%
99.11%
78%
91.84 %
Buses
92.59%
94.34%
88.78%
100.00%
100%
100 %
Elephants
90%
100.00%
90%
99.12%
90%
92.16 %
Horses
85.71%
88.89%
90.68%
99.33%
84%
94.12 %
[email protected]
Vol 19, No. 10;Oct 2012
Flowers
96.15%
96.15%
100%
100.00%
100%
100 %
Beaches
97.82%
98.04%
90.08%
100.00%
90%
100 %
Mountains
86.66%
92.16%
91.42%
99.33%
78%
94 %
Table 4. The sensitivity, specificity and accuracy in the classical and fuzzy case of each Image Category of OT base Category
Sensitivity Classical
Specificity
Accuracy
Fuzzy
Classical
Fuzzy
Classical
Fuzzy
Street
84.09%
97.46%
99.58%
100.00%
96.35%
100 %
Coast
84.04%
87.80%
98.5%
99.50%
91.15%
96.92 %
Mountain
85.91%
93.19%
98.49%
99.13%
91.24%
94.89 %
tall building
95.66%
96.56%
99.20%
99.88%
94.92%
98.83 %
Highway
92.85%
96.27%
99.01%
99.71%
89.37%
96.88 %
Open country
87.6%
96.15%
94.44%
96.31%
70.64%
80.65 %
Inside city
91.87%
97.01%
98.40%
99.29%
87.01%
94.20 %
Forest
90.94%
95.00%
98.97%
100,00%
92.54%
100 %
Table 5: Comparison with other methods (OT dataset) Classification Model
Global classification rate
pLSA-Based Image Models [23]
78.93%
Boosting k-NN [24]
75.7%
Our approach
95,30%
Figures
Figure 1. The architecture of a system of indexing and search images by content.
213
[email protected]
Vol 19, No. 10;Oct 2012
Figure 2. Functional Diagram Of The Proposed CBIR system
Figure 3. A Single Level MRA of an Image
214
[email protected]
Vol 19, No. 10;Oct 2012
A is the approximation image and H, V and D are its horizontal, vertical and diagonal details.
Figure 4. Reconstitution Of Bidirectional Signal φ is the scaling function and ψH, ψV and ψD represent horizontal, vertical and diagonal wavelet functions.
Figure 5. Decomposition of a 2D Signal by Filter Banks
Figure 6. 2D Multiresolution Wavelet Networks
215
[email protected]
Vol 19, No. 10;Oct 2012
Figure 7. Application Of The Improved MRWN Filter And Sobel On The Image “Lena”
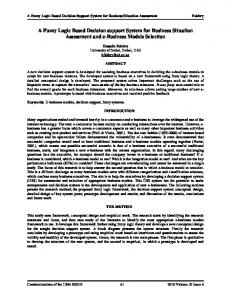
Figure 8. Functional diagram of phase search. In the figure 8, the following notations are adopted :
• Dfr : Vector of shape descriptor of the query image • Dtr : Vector of texture descriptor of the query image • Dfi : Vector of shape descriptor of image i.
216
[email protected]
Vol 19, No. 10;Oct 2012
• Dti : Vector of texture descriptor of image i. • dsfi : Distance of shape similarity of image i. • dsti : Distance of texture similarity of image i. • dsfni : Normalized Distance of shape similarity of image i. • dstni : Normalized Distance of texture similarity normalized of image i.
Figure 9. Fuzzy Inference table relative to the Decision D i.
Figure 10. Membership functions relative to the FDSS inputs and output.
217
[email protected]
Vol 19, No. 10;Oct 2012
Figure 11. Operation of transfer of value colors to intervals and test of belonging
African People
Elephants
Beach
Flowers
Building
Buses
Horses
Mountains
Dinosaurs
Food
Figure 12. Images from the Wang Database
Figure 13. Images from the OT Database
218
[email protected]