Ramesh Srinivasan, Samuel Thorpe, Siyi Deng, Tom Lappas & Michael D'Zmura. Department of Cognitive Sciences, UC Irvine, SSPA 3151, Irvine, CA 92697 ...
Decoding attentional orientation from EEG spectra 1
Decoding attentional orientation from EEG spectra
Ramesh Srinivasan, Samuel Thorpe, Siyi Deng, Tom Lappas & Michael D'Zmura Department of Cognitive Sciences, UC Irvine, SSPA 3151, Irvine, CA 926975100 {r.srinivasan,sthorpe,sdeng,tlappas,mdzmura}@uci.edu
Abstract. We have carried out preliminary experiments to determine if EEG spectra can be used to decode the attentional orientation of an observer in three dimensional space. Our task cued the subject to direct attention to speech in one location and ignore simultaneous speech originating from another location. We found that during the period where the subject directs attention to one location in anticipation of the speech signal, EEG spectral features can be used to predict the orientation of attention. We propose to refine this method by training subjects using feedback to improve classification performance. Keywords: EEG, attention, orienting, classification.
1 Introduction This report summarizes our preliminary studies towards developing a BCI to decode intended direction, i.e., the attentional orientation of an individual, from EEG recordings alone. This effort is part of a larger project (ARO 54228LSMUR, Silent Communication Among Dispersed Forces) to develop a BCI to decode intended speech and intended direction from EEG signals. The most obvious indicators of attentional orientation are head and eye orientation. However, even when head and eyes are oriented in one direction, an observer can attend to other directions. In experimental psychology, this is referred to as covert attention[13]. Covert attention involves all the senses including visual, somatosensory, and auditory information processing [45]. Auditory information processing is particularly relevant to covert attention, because the auditory system can identify sources which lie outside the visual scene, including to the side of and behind the observer. Mechanisms which monitor and detect sources throughout the environment selectively are essential to guide head and eye movements. The close relationship between attention and orienting eye and head movements is supported by experimental studies and theoretical models which suggest a motor programming role for attention [67]. Most previous EEG and fMRI studies focused on the effects of orienting attention on the response to a sensory stimulus [89]. Across all of these studies, the main effect is that larger responses are recorded to attended stimuli. More recently, a more
2 Ramesh Srinivasan, Samuel Thorpe, Siyi Deng, Tom Lappas, & Michael D'Zmura
nuanced view has emerged which suggests that distinct brain networks respond to attended and unattended stimuli [1011]. Our goal is to identify the neural signature of orienting attention in one direction even when there is no stimulus at that location. Thus, we are interested in the top down instruction to orient attention in one direction (or to one location) rather than the orienting elicited by a salient stimulus (bottomup). Recently, a number of EEG and fMRI studies have been directed at this question and have demonstrated preparatory neural activity when attention is directed by instruction (cued) to one location on a computer screen [1215]. The fMRI studies examined retinotopically mapped areas of the visual system and demonstrated preparatory increases in neuronal activity as indexed by the BOLD signal. EEG studies showed increased alpha rhythm in the parietal cortex ipsilateral to the attended visual field. Although these studies have elucidated some of the mechanisms of topdown attentional orienting, they are limited in their usefulness towards developing a BCI that can decode attentional orientation. In general, orienting attention takes place in a larger sensory field, not just a limited sector of visual space within 1012 degrees of fixation on a computer monitor. In audition, perception of sources takes place in all directions, even behind the subject. Thus, in our experiment observers selectively attend to auditory rather than visual stimuli in order to investigate attentional orientation in a wider span of sensory space. We have carried out experiments directing attention to one of two directions and identify the attended direction by classification of the EEG spectra. Our results suggest that attentional orientation can potentially be decoded from the EEG but that further work is needed to train the observers and improve classification methods.
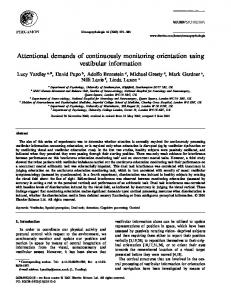
2 Methods Procedure. Six subjects participated in a speech perception experiment (see Figure 1). The subject was seated in a dimly lit room between two speakers (each at 1 m distance) and instructed to fixate on a point. There were two experimental conditions – attend left or attend right. The subject is given the instruction through both speakers. After a variable ISI (500, 700, 900, 1100, or 1300 ms), two different speech stimuli were presented one through each speaker. The speech stimuli were synthesized (http://cepstral.com) in two distinct male voices, one played through each speaker. The assignment of voices to speakers was independently randomized on each trial. The stimuli were a simplified version of the Coordinate Response Measure corpus [16]. These sentences were structured as “(Arrow, Baron, Eagle or Tiger) go to (Blue, Green, Red, or White) now”. The subjects’ task was to identify the two words played through the attended speaker with a response on a keypad. In the example shown in the figure the correct response is “Baron” and “Blue”. The experiment was designed in this manner to demand that the subject direct attention to
Decoding attentional orientation from EEG spectra 3
the correct speaker before the speech was played; otherwise the subject would miss the first code word. The variable ISI and randomized voice ensured that the observer quickly deployed and maintained attention to the appropriate speaker. In addition an adaptive staircase procedure was used to control subject performance. When the subject responded correctly to the first word, the volume was reduced by 5 % on the attended speaker and increased by 5% on the unattended speaker on the next trial. When the subject responded incorrectly to the first word, the volume was increased by 10% on the attended speaker and decreased by 10% on the unattended speaker. This procedure resulted in subjects performing the task correctly about 70% of the
Fig. 1. The experimental setup. A. The physical layout of the experiment. Note that each speaker was 45 degrees away from fixation and could not be seen by observer without moving the eyes. B. The time course of each trial in the experiment. In the example shown, the instruction is to attend to the right and after a variable ISI, two distinct sentences are played through each speaker. In the example shown, the subject responds “Baron” and “Blue”, and received feedback indicating a correct response.
4 Ramesh Srinivasan, Samuel Thorpe, Siyi Deng, Tom Lappas, & Michael D'Zmura time. At this threshold, the amplitude of the attended speaker was typically 30 dB
below the unattended speaker. A single experimental session comprised 200 trials, presented in two 100 trial blocks with a break. Each subject participated in three such sessions, each lasting around an hour. EEG recording. EEG was recorded using a 128 Channel Geodesic Sensor Net (Electrical Geodesics, Inc., Eugene, OR, USA) in combination with an amplifier and acquisition software (Advanced Neuro Technology, Inc, Enschede, NL). The EEG was sampled at 1024 Hz and online average referenced. Artifact editing was performed through a combination of automatic editing using an amplitude threshold and a manual editing to check the results. Trials with excessive bad channels (> 15 %) were first discarded and then channels with bad trials were discarded. This typically yielded 80100 usable EEG channels (out of 128) and 500550 usable trials. Data Analysis. We focused on three intervals within the ISI – 0500, 200700, and 400900 ms. For the later intervals, we discarded trials where the target stimulus had already started, resulting in different numbers of trials for the three intervals – 600, 480, and 360. The data were Fourier transformed using an FFT (Matlab) for each 500 ms interval (f = 2 Hz) and the power spectrum calculated as the squared magnitude of the Fourier coefficients. We limited further analyses to the interval from 422 Hz. This was motivated by the goals of this study to identify robust spectral features that can predict attentional orientation. Below 4 Hz EEG is often contaminated with movement and eye blink artifacts. Above 20 Hz the EEG is often contaminated with EMG artifacts. EEG power at each frequency was log transformed and normalized against the total power from 422 Hz. Classification. Classification was performed using a naïve Bayes classifier (Matlab) which assumes independent variables, i.e., a diagonal covariance matrix. The data were divided into three conditions based on instruction and performance: Correct Left, Correct Right, and Incorrect. There were roughly equal numbers of Correct Left and Correct Right trials, and 1020% fewer Incorrect trials. To facilitate comparisons in classification performance between the analysis intervals, we used a fixed number (determined by the 400900ms interval) of randomly selected “training” trials (typically 150) to calculate a linear classifier, which was applied to classify another 150 “test” trials. The classification proceeded in two steps. First we evaluated the performance of each individual variable (80100 channels x 10 frequencies) in classification of the “test” data, using 30 random samples of “training” and “test” trials. Then we evaluated the performance of the best 10, 20, 50, 75, and 100 variables using 50 random samples of “training” and “test trials”.
Decoding attentional orientation from EEG spectra 5
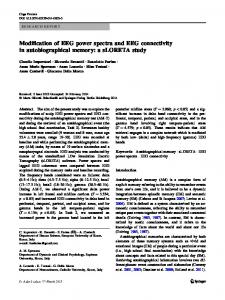
Fig. 2 Examples of classification performance versus the number of variables for the three classification intervals. Overall S0 had the best classification performance and S5 had the worst performance. The other subjects showed intermediate levels of classification performance.
6 Ramesh Srinivasan, Samuel Thorpe, Siyi Deng, Tom Lappas, & Michael D'Zmura
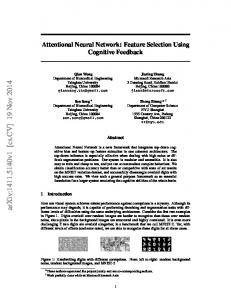
Fig 3. Power spectra from the channel that provided the best threeway classification for each subject. For 3 subjects (S0, S3, and S7) the channel shown is located over parietal cortex. For the other subjects (S2, S4 and S5) the channel shown is located over the frontal lobes. Note that spectral differences are present at most frequencies.
Decoding attentional orientation from EEG spectra 7
Fig 4. Topographic distribution of channel sensitivity to attentional orientation. Each channel classification ability was scored and averaged across frequencies. The results were plotted as a topographic map, where white shows the highest predictive power and black indicates no predictive power.
8 Ramesh Srinivasan, Samuel Thorpe, Siyi Deng, Tom Lappas, & Michael D'Zmura
Discussion
In a simple cued spatial attention experiment we were able to demonstrate preliminary results indicating that the EEG contains information that can be used to decode the orientation of attention in space. Our approach here has been very direct and overly simplistic. We have made use of spectral features of the EEG and a naïve Bayes classification scheme. Both approaches can be significantly improved. Despite the limitation of these methods, we were able to achieve as high as 75% classification performance in 2way classification and 60% classification performance in 3way classification. This indicates that EEG signals clearly contain information about attentional orientation that can be used to decode attentional orientation for BCI applications. The data also suggest that the signatures of attentional orientation can be more robustly decoded at a longer interval following the cue. In our comparisons, 400900 ms after the cue provided the best classification in each subject. This is consistent with theoretical and experimental studies of the episodic nature of attention, which suggested that following the cue the attention window will take at least 300 ms to open [17]. How long this window remains open and whether more robust classification can be obtained remains to be tested. Estimating the duration for which the neural signatures of attentional orientation are sustained will require a larger amount of data. Our results suggest that electrodes over frontal and parietal cortex have the greatest sensitivity to attentional orientation. This finding is consistent with a large body of experimental research with EEG and fMRI that indicate that largescale networks spanning parietal and frontal cortex mediate selective attention [1820]. More surprising was the lack of frequency specificity in our classification results. Previous reports had suggested occipital/parietal alpha rhythms would be sensitive to attentional orientation [15, 21]. However, those studies used visual displays where attention was directed to one of two regions within 46 degrees of fixation. Thus, those results were specifically related to attentional orienting within the narrowly defined retinotopically mapped visual space. Our results relate to orienting to two regions of auditory space separated by 90 degrees and out of the field of view while fixating. The results of this paper are preliminary and indicate the potential for obtaining an attentional orientation BCI. An important factor we have not yet considered is training subjects to optimize the BCI. Our current work extends this study through a consideration of the full 360 degrees of auditory space surrounding the subject.
Acknowledgements This work was supported by ARO 54228LSMUR.
References
Decoding attentional orientation from EEG spectra 9
1. Desimone, R., Duncan, J. (1995). Neural mechanisms of selective visual attention. Annu Rev Neurosci 18:193222 2. Egeth HE and Yantis S Visual attention: control, representation, and time course. Annual Reviews in Psychology, 48:269297. 3. Kastner S and Ungerleider LG (2000) Mechanisms of visual attention in the human cortex. Annual Review of Neuroscience, 23:315341. 4. Spence C, Pavani F, Driver J (2000) Crossmodal links between vision and touch in covert endogeneous spatial attention. Journal of Experimental Psychology: Human Perception and Peformance. 26:12981319 5. Spence C, Driver J (1998) Crossmodal attention. Current Opinion in Neurobiology, 8:245 253. 6. Moore T, Armstrong KM, Fallah. Visuomotor origins of covert spatial attention. Neuron, 40:67183. 7. Sheliga BM, Riggio L, Rizzolatti G (1994) Orienting of attention and eye movements. Experimental Brain Research. 98:507522. 8. Hillyard, S. A., AnlloVento, L. (1998) Eventrelated brain potentials in the study of visual selective attention. PNAS. 95:781787. 9. Kastner, S., Pinsk, M., De Weerd. P., Desimone. R., Ungerleider. L. (1999) Increased activity in human visual cortex during directed attention in the absence of visual stimulation. Neuron 22:751761 10. Corbetta M,Shulman GL (2002) Control of goal and stimulusdriven attention in the brain. Nature Reviews Neuroscience. 31:201215. 11. Ding, J., Sperling, G., and Srinivasan, R. (2006) SSVEP power modulation by attention depends on the network tagged by the flicker frequency, Cerebral Cortex, 16:10161029. 12. Sylvester, C., Jack, A., Corbetta, M., and Shulman, G. (2008). Anticipatory Suppression of Nonattended Locations in Visual Cortex Marks Target Location and Predicts Perception. Journal of Neuroscience. 28(26): 6549 – 6556. 13. Shulman, G., Ollinger, J., Akbudak, E., Conturo, T., Snyder, A., Petersen, S., and Corbetta, M. (1999) Areas Involved in Encoding and Applying Directional Expectations to Moving Objects. The Journal of Neuroscience. 19(21):9480–9496. 14. Fu, K., Foxe, J., Murray, M., Higgins, B., Javitt, D., and Schroeder, C. ( 2001). Attention dependent suppression of distracter visual input can be crossmodally cued as indexed by anticipatory parieto –occipital alphaband oscillations. Cognitive Brain Research 12, 145 – 152. 15. Worden, M., Foxe, J., Wang, N., and Simpson G. (2000), Anticipatory Biasing of Visuospatial Attention Indexed by Retinotopically Specific alpha band Electroencephalography Increases over Occipital Cortex. The Journal of Neuroscience. Vol, 20. 16. Moore. T., J. (1981). Voice communication jamming research, in AGARD Conference Proceedings 331: Aural Communication in Aviation. 2,16. 17. Weichselgartner, E., & Sperling, G. (1987). Dynamics of automatic and controlled visual attention. Science, 238, 778780. 18. Gitelman, D., Nobre, A., Parrish, T., LaBar, K., Kim, Y., Meyer, M., Mesulam, M. (1999). A largescale distributed network for covert spatial attention, Further anatomical delineation based on stringent behavioural and cognitive controls. Brain, Vol. 122, No. 6, 10931106. 19. Posner, M., Petersen, S. (1990). The attention system of the human brain. Annual Review Neuroscience. 13:2542.
10 Ramesh Srinivasan, Samuel Thorpe, Siyi Deng, Tom Lappas, & Michael D'Zmura 20. Coull, JT. (1998). Neural correlates of attention and arousal: insights from electrophysiology, functional neuroimaging and psychopharmacology. Progress in Neurobiology, 55(4), 343361. 21. Foxe, J., Simpson, G., and Ahlfors, S. (1998). Parietooccipital ~10 Hz activity reflects anticipatory state of visual attention mechanisms. NeuroReport 9, 3929–3933.