2Department of CS & IT, Dr. Babasaheb Ambedkar Marathwada University, Aurangabad, Maharashtra, India. ABSTRACT. Identification of land covers like ...
International Journal of Scientific Research in Computer Science, Engineering and Information Technology © 2018 IJSRCSEIT | Volume 3 | Issue 3 | ISSN : 2456-3307
Deep Convolutional Neural Network Models for Land Use and Land Cover Identification Using Dataset Created From LISS-IV Satellite Images Parminder Kaur Birdi*1, Karbhari Kale2 MGM‟s Jawaharlal Nehru Engineering College, N-6, CIDCO, Aurangabad, Maharashtra, India
1
Department of CS & IT, Dr. Babasaheb Ambedkar Marathwada University, Aurangabad, Maharashtra, India
2
ABSTRACT Identification of land covers like crop-land, settlement, water-body and others from remote sensing images are useful for applications in the area of rural development, urban sprawl etc. In this paper we are addressing the task of identification of different land covers using remote sensed images which is further useful for image classification. Deep learning methods using Convolutional Neural Networks (CNN) for remote sensed or satellite image classification is gaining a strong foothold due to promising results. The most important characteristic of CNN-based methods is that prior feature extraction is not required which leads to good generalization capabilities. In this paper firstly we are presenting dataset prepared using multispectral, highresolution images from LISS-IV sensor and another dataset of PAN images created using coarse-resolution images from Landsat-8 sensor. LISS-IV dataset is prepared for six commonly found land covers i.e. crop-land, water-body, bare-farm, road and settlement. Secondly we are proposing two patch-based Deep Convolutional Neural Networks (DCNN) models for prediction/identification of the land covers present in the image. Experiments conducted using the LISS-IV dataset has shown promising accuracies on both the DCNN models. Implementation of network is made efficient by harnessing graphics processing unit (GPU) power which reduces computation time. And finally, DCNN models are also evaluated for their performance using two similar publicly available benchmarked datasets, indicating that construction of models using described size of filters, number of filters and number of layers is suitable for multi-class remote sensing image patch prediction or identification. Keywords: LISS-IV dataset, Patch-based learning, Convolutional neural networks, Test accuracy, land-use, land covers.
I. INTRODUCTION
key motivation behind deep learning, a branch of Machine Learning where neural networks are
A large number of satellites capturing huge amount
constructed with more than one hidden layer called
of images can be used for wide range of applications
as Deep learning Networks. For image classification,
for land-use analysis, agriculture planning and rural
deep learning methods using Convolutional Neural
& urban development. Visual world can be
Networks (CNN) can be applied to develop
recognized better by using proper representation of
generalized algorithms which can be used for solving
objects. From an image, primitive features can be extracted followed by different parts of the object
problems of different domains. The most important
which leads to identification of the object. This is the
feature extraction is not required which leads to good
characteristic of CNN-based methods is that prior
CSEIT18356 | Received : 02 April 2018 | Accepted : 20 April 2018 | March-April-2018 [ (3)3 : 2123-2134 ]
2123
Parminder Kaur et al. Int J S Res CSE & IT. 2018 Mar-Apr;3(3) : 2123-2134
generalization capabilities. CNNs have shown good
Further paper is arranged as follows. Section II is
performance in object recognition, object detection
discussing related work carried out in the similar
and remote image classification [1, 2, 3].
domain. Section III describes the methodology
CNNs are inspired by the working of visual system of
covering architecture of proposed DCNN models,
human beings where we do visual perception of
study area and experimental setup. Section IV
things present around us using a layered architecture
describes results and discussions
of neurons [4]. Hand-crafted feature extraction was the main method used for image classification, as
conclusions with future scope in section V.
reflected
in
most
of
the
traditional
followed
by
II. RELATED WORK
image
classification. CNN can learn suitable internal representations of the images. By using CNNs,
Deep neural networks can learn effective feature
learning models are able to obtain conceptual
representations from a big training dataset and these
sensitivities by each layer. CNNs work as feature
features can be used for classification purposes. This
extractors and classifiers which are trainable as
area of remote sensing area is progressing at slow
compared to traditional classifiers which makes use
pace because of less availability of labelled ground
of hand-crafted features.
truth datasets. Yang and Newsam presented an intensively
researched
remote
sensing
image
The key contributions of this paper: 1. Creation of new dataset using satellite images
classification dataset known as UC Merced Land Use Dataset (UCM) [5, 22]. The dataset consists of twenty
from high resolution Linear Imaging Self-
one land use and land cover classes. Each class has
Scanner (LISS-IV), consists of 2500 image scenes
100 images and the images are present in size of
which is increased to 18000 images using data
256x256 pixels with a spatial resolution of about 30
augmentation, labelled for six different classes.
cm per pixel. All images are in the RGB colour space
This dataset can be used for training of CNNs for
and were extracted from the USGS National Map
land use and land cover classification tasks.
Urban Area Imagery collection. Helber et al.,
Another dataset is created using PAN band of
recently proposed a novel satellite image dataset for
Landsat8 Images. Ten images acquired over a
land use and land cover classification, EuroSAT [6].
period of one year have been used to create the
This dataset consists of 27,000 labelled images and is
dataset. This dataset is small with only 1000
created from Sentinel-2 satellite images. There are
image scenes and could be created only for three
ten different classes present in the dataset namely,
classes i.e. water, crop-area and settlement, due
industrial, residential, annual crop, permanent crop,
to small size of pixel. The PAN band of Landsat8
river, salt lake, highway, vegetation, pasture and
has spatial resolution of 15m.
forest. Image dataset is provided in two formats, one
2. Proposed a patch-based learning framework to design deep CNN (DCNN) models which can
covering 3 bands and other one having 13 spectral bands.
identify various land use and land covers present in a satellite image. Our study also
A remote sensing image classification benchmark
shows that training process can be speed up by
(RSI-CB) based on massive, scalable, and diverse
utilizing GPU power which will make it
crowd-source data has been presented [7]. Dataset
possible to scale up such models for larger inputs
has been labelled using Open Street Map (OSM) data,
and train them on large datasets.
ground objects by points of interest and vector data from OSM leading to a large-scale benchmark for remote sensing image classification. This benchmark
Volume 3, Issue 3, March-April-2018
2124
Parminder Kaur et al. Int J S Res CSE & IT. 2018 Mar-Apr;3(3) : 2123-2134
has two sub-datasets with 256 × 256 and 128 × 128
Network for classification. Authors observed that for
sizes, as requirements of designed DCNNs, for image
SAT-4 dataset, on their best network produced a
sizes. The first dataset has six categories with 35
classification accuracy of 97.95% and for SAT-6, it
subclasses of more than 24,000 images and the
produced a classification accuracy of 93.9%. Yang
second one has also six categories with 45 subclasses
and
of more than 36,000 images. The main categories are
(BOVW) methods for land-use classification for
agricultural land, construction land, transportation, water, woodland, and other lands, along with their
high-resolution imagery [22]. Authors have proposed a novel method, termed as the spatial co-
several subclasses. Others publicly available datasets
occurrence kernel which takes into account the
are: WHU-RS19, having 1005 images for 19
relative arrangement. Methods are evaluated using a
categories with image patch size of 600x600, SIRI-
large ground truth image dataset, UC Mercedes
WHU having 2400 images for 12 classes with image
consisting of 21 land-use classes. Authors concluded
patch size of 200x200, RSSCN7 with 2800 images,
that even though BOVW methods do not always
patch size of 400x400 for 7 classes, RSC11 having
perform better than the standard approaches, but
1232 images, patch size of 512x512 for 11 classes,
they can be used as a robust alternative which is
Brazilian coffee scene with 2876 images, patch size of
more effective for certain land-use classes.
Newsam
investigated
bag-of-visual-words
64x64 for 2 classes i.e. coffee and non-coffee [8, 9, 10, 21, 22, 23, 24]. Interested authors can read comprehensive review of these datasets [11]. They
Supervised data mining methods like neural networks, support vector machines and random
have also proposed, NWPU-RESISC45, which can be
forests majorly use spectral information. This
used for remote sensing image classification. It has
information change due to impact of weather
31500 images, for 45 classes [11]. Images of this
conditions,
dataset has large number of image scenes with
extraction process can be mechanized to overcome
variations in translation, spatial resolution, viewpoint,
drawbacks
object pose, illumination etc.
classification accuracies are obtained for very high
sensor of
geometry
hand-crafted
etc.
Information
methods.
High
spatial resolution images and mostly for the cases A convolutional neural network (CNN) has been
where training images are completely hand-labelled
applied to multispectral orthoimagery with spatial
i.e. per-pixel. This kind of 100% labelled data is not
resolution of 0.5m and a digital surface model (DSM)
available easily so we have taken the approach of
of a small city producing fast and accurate per-pixel
patch-based dataset creation. In this approach, label
classification [12]. Authors evaluated and analysed
is assigned to the entire patch as compared to
various design choices of the CNN architecture.
labelling every pixel. We are addressing the
Finally it was concluded that CNNs are a feasible tool
challenge of less availability of labelled dataset to
for solving both the segmentation and object
train a CNN by creating a new dataset built from
recognition task. Two new satellite datasets called
multispectral sensor with spatial resolution of 5.8 m
SAT-4 and SAT-6 have been prepared from images
(which is much lower than the resolution of images
taken from the National Agriculture Imagery
used by majority of researchers) and also PAN band
Program (NAIP) dataset [13]. Images are acquired in
dataset from coarse-level resolution sensor, Landsat-8
patch size of 28x28 and consists of four bands- red,
having spatial resolution of 15m. We have also
green, blue and Near Infrared. They have also
attempted to propose two new DCNN architectures
proposed a classification framework which extracts features from the normalized input image and these
with few number of convolutional layers which can be efficiently trained and tested using the new
feature vectors are given as input to a Deep Belief Volume 3, Issue 3, March-April-2018
2125
Parminder Kaur et al. Int J S Res CSE & IT. 2018 Mar-Apr;3(3) : 2123-2134
proposed
datasets
and
also
compared
their
performance with standard benchmark dataset.
patch. Selection of proper size of the filters is very important step to identify the significant features. Therefore it‟s very important to find the appropriate
III. METHODOLOGY
size of the kernel/filter. In our design of DCNN, kernel size used are 5x5, 3x3 and 1x1 depending
A. Deep convolutional neural networks (DCNN) architecture
upon the input size of patch for that convolution
Deep convolutional neural networks have shown
layer. The keys points in designing a DCNN model are setting local connections and pooling. The main
very good performance in experiments conducted on
goal of pooling layer is to reduce the dimensionality
remote sensing images for classification or object
of input data, also called as down-sampling. If
detection purposes. Constructing a DCNN requires
pooling is removed, the dimensionality of the
major steps: creating the convolutional neural
problem increases drastically leading to large training
network architecture, preparing training and test
time. While deciding stride factor for pooling, care
data and initializing parameters for training process.
must be taken that it doesn‟t result in loss of
In CNNs/DCNNs, the properties related to the
information.
structure of layers, number of neurons, number & size of filter, receptive field (R), padding (P), the
Any raw image of any size can be given as input to
input volume dimensions (Width x Height x Depth, or N x N x B) and stride length (S) are called hyper-
the algorithm designed which is first resized to the desired image patch size of 32x32. Resized image
parameters [14, 15]. Connecting all the neurons with
patch (multispectral image) is fed as input to DCNN.
all possible areas of the input volume is a difficult
Image patch is represented as a 3D tensor of
task and leads to large number of weights to train.
dimensions N x N x B, where N represents length &
This results in a very high computational complexity.
width
So, instead of connecting each neuron to all possible
bands/channels. Therefore, all the factors discussed
pixels, a 2- dimensional region, say of size 5×5 pixels
above play a significant role in making deep
is defined and it extends to the depth of the input,
networks get trained. Architectural building blocks
making receptive field size to be 5x5x3 (for 3 band
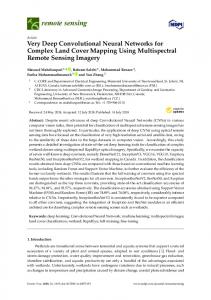
of DCNN models are shown in Figure 1. In the
input image). Computations are carried out for these
models designed by us, for pooling layer, a stride
receptive fields producing the activation map.
factor of 2 is used. This layer is usually placed after
of
the
image
and
B
is
number
of
convolution layer. Even though pooling results in First step is to choose filter/ kernel of appropriate size
some amount of information loss, it still is found
to convolve over the input image. The main goal of
beneficial for the network as reduction in size leads
this step is to identify key features in the image. This
to less computational overhead for the upcoming
convolution operations produces activation maps.
layers of the network and it also work against over-
Activation maps represent „activated‟ neurons/ regions, i.e. area where features specific to the kernel
fitting.
have been found in the input patch. Initialization of
An important role in the training process is the
weight values to filter is done randomly here and
choice of activation function, the way weights are
then these values are updated with each learning
initialized, and how learning is implemented.
iteration over the training set, as part of back
Activation functions are identity or linear function,
propagation. Convolution operations find significant features like edges, lines and intensity, when
sigmoid or logistic function, hyperbolic tangent and Rectified Liner Unit (ReLU). Major role is played by
appropriate filters are convolved over the image
the choice of activation function, most widely used is
Volume 3, Issue 3, March-April-2018
2126
Parminder Kaur et al. Int J S Res CSE & IT. 2018 Mar-Apr;3(3) : 2123-2134
ReLU [16]. The output layer is the softmax layer
learning and higher overall accuracy. It is performed
which
activations
on the mini-batch size specified in the parameters.
representing predicted probabilities which always
For normalization purposes, we divide the calculated
sum to 1.
value of the activation matrix by the sum of values in
produces
a
set
of
output
the filter matrix. Since there is a very large number The function of the Softmax layer is to convert any
of patches in our dataset we use stochastic gradient
vector of real numbers into a vector of probabilities, thus corresponding to the likelihoods that an input
descent with mini batches for optimizing learning.
image is a member of a particular class. Batch normalization potentially helps in two ways: faster
Figure 1. Architectural building blocks of DCNN models
Volume 3, Issue 3, March-April-2018
2127
Parminder Kaur et al. Int J S Res CSE & IT. 2018 Mar-Apr;3(3) : 2123-2134
Figure 2. Deep Convolutional Neural Network Model 1(a) and Model 2 (b) B. Creation of training and test labelled dataset
between 19° 10' 1.6" to 21° 16' 29.75" North Latitude
CNNs require large number of images for training for
and 74° 43' 44.83" to 76° 53' 42.79" East Longitude. It
learning task. The image resolutions, size and scale of objects impacts the training process, as task-relevant
has mixture of land covers i.e. road, water body, buildings, bare farms and largest area has sugarcane
information varies with spatial resolution. How an
crop. This region has majorly agricultural land and a
object is recorded in image depends on object‟s
large number of fields have sugarcane crop at various
location, angle of capture and its size. This is to be
growth stages. So, the focus of this study is to
considered for data augmentation. CNNs can deal
identify
with change in location as weights are shared in
harvest/senescence stage along with other land
convolutional layers. Majority of the researchers
covers. The study area has sugarcane crop at various
have used hand-labelled dataset created for both
growth stages. Fields of the study area are irregular in
training and testing and since labelling images is a
shape and size. Fields vary from one acre to twenty
very time consuming process, the datasets have been
acres and even larger. The satellite data from LISS-IV,
small in both aerial image applications and general image labelling work [12, 17, 18]. For this paper, the
considering size of the crop fields. As the spatial resolution is 5.8m for the bands green, red and near
study site is Navin Kaigaon village of Maharashtra,
infrared (NIR). These bands are most commonly used
India. The study area as shown in figure 3 lies
for identification of crops.
Volume 3, Issue 3, March-April-2018
sugarcane
at
ripening/
growing
2128
and
Parminder Kaur et al. Int J S Res CSE & IT. 2018 Mar-Apr;3(3) : 2123-2134
like image rotation, flipping, Gaussian filtering for improving accuracy and reducing over-fitting. Data augmentation is transforming an image that doesn‟t change the image label. There are many ways to do it like rotation, scaling, flipping, cropping (random), color jittering etc. Also RGB intensities can be altered. Total images used are 3000x6 = 18,000, out of which 80% are used for training and 20% for testing purpose. Figure 4 shows sample image patches of the Figure 3. The study area is in the center of Maharashtra, Navin Kaigaon, India. Left hand-side is map of the Maharashtra state and right-hand side is image subset obtained from LISS-IV. To
construct
the
labelled
dataset
dataset created. The mean spectral reflectance curve of all six classes which is used to consider image patches for inclusion into the dataset is recorded while image patches were prepared to be added to final dataset. Those image patches whose mean
for
image
classification, satellite image of IRS LISS-IV sensor, high resolution imagery from commercial satellite
reflectance values deviated outside the desired range were removed from the dataset, as they contained large number of mixed pixels.
was acquired for the study region. It has pixel size of 5.8m and spectral range from 0.52 µm to 0.86 µm. The image is color- Infrared image i.e. bands are
a. Sugarcane Crop- Full Growth stage
combined as NIR, Red and Green (CI Image). Then training/ test dataset is created as image patches where regions of interest for every class are created
b. Sugarcane Crop- Harvest stage
separately. These image patches are further resized to desired patch size of 32x32, which is given as input
c. Road
to CNN‟s first layer. Dataset for six land covers (classes) have been prepared and manually checked as per the given number of image patches for every
d. Settlement
class: 1. Sugarcane Crop- Full Growth stage (6 to 8 months old) : 550 image patches
e. Bare-Farm
2. Sugarcane Crop- Harvest stage (12 to 14 months old) : 550 image patches
f. Water-body
3. Water-body : 400 image patches
Figure 4(a-f): Sample image patches created for
4. Settlement : 500 image patches
training and testing dataset, representing all six
5. Road : 200 image patches 6. Bare-farm :300 image patches
classes: Sugarcane Crop- Full Growth stage, Sugarcane Crop- Harvest stage, Road, Settlement, Bare-Farm and Water-body
Number of image patches are varying due to
Another labelled dataset consisting of image patches
percentage of presence of land covers present in the
from Landsat8, using only PAN Band for image
study scene. Image patches are resized to 32x32
classification. Ten images are acquired for a period of
pixels size. This dataset is further increased to 3000
one year, 19th April, 2016 to 24th May 2017 downloaded from the USGS Earth Explorer database
images per class using data augmentation methods Volume 3, Issue 3, March-April-2018
2129
Parminder Kaur et al. Int J S Res CSE & IT. 2018 Mar-Apr;3(3) : 2123-2134
(United
States
Geological
Survey)
After creating DCNN models, they are trained by
Images
providing the created labelled datasets separately
considered for study have cloud cover less than 10%.
with LISSIV for five/six classes and Landsat-8, PAN
Landsat-8 has 16 days repeat cycle, providing data at
dataset for three classes. The base learning rate is
swath of 185kms. Images are Level 1T (terrain
0.0001, parameters to compute increments are:
corrected) scene of the OLI/TIRS sensor, of path /
momentum = 0.9, and weight decay = 0.0005. The
row: 146 / 46. Landsat-8 provide images in 11 bands with spatial resolution of 30 m for seven
number of epochs are varied from 100 to 500 to check accuracy. DCNN models are trained with
multispectral bands, 15m for PAN band and 2
different batch sizes of 64, 128 and 256 where 128 is
thermal bands acquired at 100m, resampled to 30m.
found to give best performance. Batch sizes is
Spectral resolution of PAN band is 0.50 µm to 0.68
number of samples loaded into memory for the
µm. Then training/ test dataset is created as image
training phase of the DCNN. Models processes the
patches where regions of interest for every class are
complete training dataset, by making increments
created separately. These image patches are further
defined as batch size. Batch size is used for efficient
resized to desired patch size of 32x32, which is given
computations and is also dependent on the hardware
as input to CNN‟s first layer. Dataset for three land
where CNN is trained. During training the DCNN,
covers (classes) have been prepared and manually
data used from the training set will minimize the
checked as per the given number of image patches for every class: Crop-farms: 350 image patches,
error. The validation data is used to check the response of the CNN model on new and similar
Water-body: 350 image patches and Settlement: 300
images, which network hasn‟t seen before i.e. it is
image patches. This dataset is further increased to
not trained on. Validation or test data passes only in
1000 images per class using data augmentation
forward pass, as no error is calculated in this pass. As
methods, creating a total of 3000 image patches.
the training and testing process is completed, CNN
(http://earthexplorer.usgs.gov)
[20].
model is saved and used to compute confusion C. Experimental setup with parameters set for training network
matrix. Setting the value of learning rate is an important step as this values takes the network
We have implemented DCNNs using MatConvNet
towards convergence, and selecting the appropriate
[19]. It is a MATLAB toolbox implementing
value is an empirical process. Throughout the
Convolutional Neural Networks (CNN). CNNs need a
training phase of the CNN, the network generates
lot of training data for learning process and also
three plots showing, Top1 error, Top 5 error, and
requires efficient implementations. MatConvNet
objective for every successful epoch. The top1 error
provides this as it has methods for optimizations and
depicts that, the class with the highest probability is
supporting computations on GPUs. Building blocks
the true correct target, i.e. network found the target
of CNNs, convolution, normalisation and pooling can
class. The top 5 error depicts that, the true target is
be easily combined and extended build DCNN
one of the five top probabilities. The last layer, i.e.
models. MatConvNet is open-source released under a
softmax is attached for final classification and it is
BSD-like license, simple to install and easy to use.
fully connected. It has a filter depth of C i.e. number
Our model is implemented in MATLAB R2017a on
of classes of the remote sensed scene database. In our
Intel i7 -7500U CPU @ 2.70 GHz, NVIDIA GeForce
CNN model, filters of size 3x3xC, 5x5xC have been
940MX graphic device with 8G byte graphic memory
used with random weight initialization, where C is
having Windows 10 operating system installed.
number of bands. To improve accuracy of our designed model, we incorporated data augmentation in the dataset preparation process.
Volume 3, Issue 3, March-April-2018
2130
Parminder Kaur et al. Int J S Res CSE & IT. 2018 Mar-Apr;3(3) : 2123-2134
increasing means the model has started to over-fit
IV. RESULTS AND DISCUSSIONS
and further training the model is of no use. The other measures
used
to
compute
performance
of
To evaluate classification accuracy of the DCNN
classification done by DCNN is precision, recall and
models, confusion matrix is generated after training
kappa statistic. The precision is the fraction of
process is completed. The impact of change in
predicted C instances which are true C instances.
number of epochs on the classification accuracy is recorded. It has been observed that training time
And the recall of a set of predictions is the fraction of true C instances that were correctly detected. These
increases as the number of filters increase. Impact of
indexes are calculated from the confusion matrix C.
different activation functions, ReLU and sigmoid is
The
also computed and found that ReLU achieves higher
Accuracy with Expected Accuracy. It is a measure of
classification accuracy. It is recommended to do
how closely the instances classified by the classifier
extensive searching by applying a range of values to
model matched with the labeled data. Kappa value
hyper-parameters to reach the best performance of
can also be used to compare performance of two
the CNN models. This process requires a large
classifiers performing the same classification work. It
amount of computations and is done using trial and
is recommended to use kappa value for classifiers
error. We considered different size of filters in the
made and evaluated on data sets with varying class
range 1x1, 3x3, 5x5, 7x7 and also number of filters from 10 to 100, before making the final architecture.
distributions. Average Speed of the DCNN models were 4231 Hz means it could process 4231 images per
Kappa
statistic
compares
the
Observed
second. We have evaluated performance of DCNNs model by considering “Loss”, “Overall Accuracy”, “precision”
DCNN models 1 and 2 were trained and tested using
and “recall”. The term “Loss” is used during the
LISSIV dataset for all six classes and it was observed
training process to find the appropriate hyper-
from confusion matrix that class bare-farm shows
parameter values for the model i.e. weight values.
least number of correct predicted instances. It is
This value is continually optimized in the training
observed from image patches given as input, that
process by updating weights. Overall accuracy is
bare-farms couldn‟t be marked correctly due to
calculated after the loss value has been optimized. It
mixed pixels with leftovers of last crop. So models
measures the extent of how accurate is the model's
were again trained using LISSIV dataset for five
prediction as compared to the labelled or target class.
classes i.e. Sugarcane Crop- Full Growth stage,
MatConvNet generates training and validation log
Sugarcane Crop- Harvest stage, Road, Water-body
likelihoods after every epoch during training cycle.
and Settlement. The classification accuracy of
Initially the curve of the validation log likelihood
model1 for six classes is 92.92% and for five classes
shows higher correct prediction values as the dataset
(leaving bare-farm) is 97.56%. It was also observed
of validation/ test is relatively 20% of the total dataset. Also, the distance between training and
that predicted labels for Sugarcane Crop- Full
validation curves remains moderately constant as the
both experiments with six and five classes is observed
training cycle proceeds depicting that there is very
to be 100% correct by Model 1. This indicates that
less over-fitting.
DCNN models are able to accurately identify crop
Growth stage and Sugarcane Crop- Harvest stage in
present at different growth stages. Table 1 shows the The performance of model is good as long as the cost curve for training and validation is reducing. It can
various measures computed from confusion matrix for both the models trained and evaluated on five
be checked after every epoch. In case if it starts
classes for different number of epochs. The batch-
Volume 3, Issue 3, March-April-2018
2131
Parminder Kaur et al. Int J S Res CSE & IT. 2018 Mar-Apr;3(3) : 2123-2134
size is kept to be 128 for all the experiments recorded
bands for 10 classes. Every class has 3000
in this table.
images. We have used 3 band dataset for evaluating our models [6].
DCNN models were also trained by changing
2. UC Mercedes consists of 21 class land use
activation function to sigmoid and it was observed
image dataset, having 100 images for each
test accuracy of model 2 goes down drastically to 44%
class. Each image is provided as 256x256
whereas for model1 is 92.75%. Since, we created a PAN dataset using images from Landsat8 sensor to
patch [22].
check how our DCNN models perform on PAN data,
As depicted by table 2, our proposed DCNN models
it was observed that test accuracy is 66%. Fu et al.,
1& 2 have overall accuracy of 98.1% & 96.28% on
have used fully convolutional network for classifying
the LISS-IV dataset created. This classification
high spatial resolution remote sensing imagery with
accuracy is at par with accuracy attained on the two
12 classes [17]. Accuracies of our models is recorded
benchmarked dataset used. We have also compared
to be better than their approach. Authors have
the accuracy attained by Helber et al., on EuroSAT
explained their results are less accurate due to
dataset for CIR image, since our dataset is in CIR
confusing classes present in the images used and in
band combination. DCNN model 1 has also attained
their study they have used 12 classes and many of
same accuracy on the same dataset [6]. Performance
these classes (building, cement ground, road, and parking lot) potentially contains mixed pixels. In our
is more efficient on our model since number of convolutional layers used is 3 & 4 and they have used
study we have classified six classes and are found to
fine-tuned ResNet-50 having 8 convolutional layers.
be separable except for bare-farm. We have also
PAN dataset trained on the same models doesn‟t have
evaluated performance of proposed models for two
required accuracy.
benchmarked datasets: 1. EuroSAT, a dataset created using Sentinel-2 satellite images, provided in 3 bands and 13 Table 1. Overall Accuracy (OA), Kappa value, precision and recall measures for model 1 and 2. Epochs
OA %
Kappa
Precision (Producers Accuracy) %
Recall (Users Accuracy) %
G H R S W G H R S W Model 1 400 98.10 0.97 100.00 100.00 97.22 98.33 91.67 97.56 91.60 99.72 99.72 99.40 300 97.28 0.97 100.00 100.00 98.33 96.67 91.39 98.09 92.07 98.33 99.15 99.40 Model 2 400 96.28 0.95 98.61 98.33 96.94 95.83 91.67 93.92 93.40 96.87 98.29 97.35 300 96.83 0.96 98.89 96.39 98.61 98.06 92.22 97.80 93.03 98.61 97.78 97.08 (G: Sugarcane crop- Full Growth stage, H: Sugarcane crop- Harvest stage, R: Road, S: Settlement, W: Water) Table 2. Validation/test accuracy results for four datasets. DCNN Model
No. of Conv. layers Dataset Type Spatial Resolution DCNN model 3 1 DCNN model 4 2 ResNet-50 (22) 8 Volume 3, Issue 3, March-April-2018
EuroSAT
UC Mercedes
LISSIV
Landsat8 PAN
Multi-Spectral 10m 97.00%
Multi-Spectral 30cm 95.40%
Multi-Spectral 5.8m 98.10%
PAN 15m 66.10%
95.20%
94.60%
96.28%
50.03%
98.32%
96.42%
--
--
2132
Parminder Kaur et al. Int J S Res CSE & IT. 2018 Mar-Apr;3(3) : 2123-2134
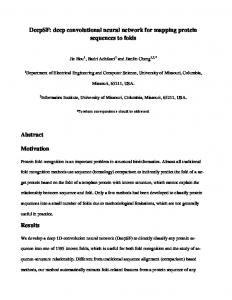
DCNN Model1 error curve for different batch size
ERROR
0.15
Size64 Size128 Size256
0.1
DCNN
models
are
also
evaluated
for
their
performance using two similar publicly available benchmarked datasets, indicating that construction of models using described size of filters, number of
0.05
filters and number of layers is suitable for prediction of land cover. The approach used in our models is
0 0
100
200
300
400
500
EPOCHS DCNN Model 2 error curve for different batch size
patch-based and size of input patches taken as 32x32 is also justified, considering spatial resolution of LISS-IV and Landsat-8. Using only a specific set of features like spectral reflectance values or manually
1.5
ERROR
water-body, bare-farm, road and settlement. As
1
Size64
derived
Size128
classification results. The proposed models are taking
Size256
0.5
features,
cannot
help
achieve
good
input as 3-D image tensor i.e. it considers the spectral features (3 bands) as well as spatial neighbourhood also (32x32). The models presented are working with
0 0
100
200
300
400
500
EPOCHS
98% accuracy to identify or predict unknown image patches. This work can be further extended by using the trained DCNN models for large size satellite
Figure 5. Error curve for DCNN Model 1 and 2 for
image classification.This LISS-IV dataset can be
batch size of 64, 128 and 256.
augmented using LISS-III images as it has same spectral resolution and different spatial resolution
Impact of different size of batch provided (64, 128
(23.5m). LISS-III images can be up-sampled (putting
and 256) on the performance of the DCNN Model 1
more pixels) to the resolution of LISS-IV (5.8m)
and 2 is as shown in figure 5, for LISS-IV dataset.
before creating the image patches for dataset. Also
Error reduces smoothly when batch size is 128 as
more classes like other crops grown can be added by
compared to 64 even though the accuracy attained is
collecting images from different parts of the country.
same. For batch size of 256, there is slow convergence and better accuracy is obtained using
VI. REFERENCES
either 128 or 64 batch size.
V. CONCLUSIONS WITH FUTURE SCOPE
[1].
classification
with
deep
convolutional
neural
networks. Neural Information Processing Systems.
This paper has presented dataset consisting of multispectral, high-resolution images from LISS-IV
Krizhevsky A., Sutskever I., Hinton G.E. ImageNet
2012 pp. 1097–1105. [2].
Castelluccio M., Poggi G., Sansone C., Verdoliva L.
sensor and another dataset of PAN band created
Land Use Classification in Remote Sensing Images
using coarse-resolution images from Landsat8 sensor.
by Convolutional Neural Networks. 2016 Accessed
The dataset created using LISS-IV has shown
online: http://arxiv.org/abs/1508.00092.
promising accuracies on the two DCNNs models proposed here. The results show that DCNN models designed can identify crop land present in a satellite image along with commonly found land cover classes, Volume 3, Issue 3, March-April-2018
[3].
Hu F., Xia G.S, Hu J., Zhang L. Transferring deep convolutional neural networks for the scene classification of high-resolution remote sensing imagery. 2015. Remote Sensing. 7, pp. 14680–14707.
2133
Parminder Kaur et al. Int J S Res CSE & IT. 2018 Mar-Apr;3(3) : 2123-2134
[4].
[5].
Hubel, David H., Torsten N. Wiesel. Receptive
learning.
cortex. 1968. The Journal of physiology 195.1 pp.
neuralnetworksanddeeplearning.com on 30th Nov
215-243.
2017)
http://
learning. 2017. MIT press book. Accessed online:
Proceedings of the 18th SIGSPATIAL international
http://www.deeplearningbook.org. [16]. Nair V., Hinton G.E. 2010. Rectified linear units
systems, pages 270-279. ACM.
improve
Dataset] Helber P., Bischke B., Dengel A., Borth D.
International Conference on Machine Learning.
for
Classification.
Land 2017.
Use
and
Land
restricted
boltzmann
machines.
[17]. Fu G., Liu G., Zhou R., Sun T., Zhang Q. 2017.
Cover
Classification for High Resolution Remote Sensing
http://arXiv:1709.00029v1
Imagery Using a Fully Convolutional Network.
cs.CV]. (Accessed on 31 Oct 2017). (http:// http://madm.dfki.de/downloads).
Remote Sensing 9, 498, doi:10.3390/rs9050498. [18]. Nguyen T., Han J., Park. 2013. D.C. Satellite image
Li H., Chao T., Zhixiang Wu, Jie Chen, Jianya Gong,
classification
Min Deng. RSI-CB: A Large-Scale Remote Sensing
Proceedings of the AIP Conference, Albuquerque,
Image Classification Benchmark via Crowdsource
NM, USA, pp. 2237–2240.
Data.
2017.
https://arxiv.org/abs/1705.10450
[19]. Vedaldi
A.,
using
Lenc
convolutional
K.
2016.
learning.
MatConvNet
(Accessed on 7th Dec 2017).
Convolutional Neural Networks for MATLAB.
Sheng G., Yang W., Xu T., Sun H. 2012. High-
http://arXiv: 1412.4564v3 cs.CV] 5 May 2016.
resolution satellite scene classification using a sparse
[20]. [Dataset], Landsat8. http://earthexplorer.usgs.gov.
coding
based
multiple
feature
combination.
International Journal of Remote Sensing. Vol. 33, [9].
online:
spatial extensions for land-use classification. 2010.
Benchmark
[8].
(Accessed
[15]. Goodfellow I., Bengio Y., Courville A. Deep
EuroSAT: A Novel Dataset and Deep Learning
[7].
2017
Yang Y. and Newsam S. Bag-of-visual-words and
conference on advances in geographic information [6].
[14]. Michael A. Nielsen. Neural networks and deep
fields and functional architecture of monkey striate
(Accessed on 30th May 2017). [21]. [Dataset]
WHU-RS
Dataset.
no. 8, pp. 2395–2412.
(http://www.tsi.enst.fr/~xia/satellite_image_project.
Zhao L., Tang P., Huo L. 2016. Feature significance-
html) (Accessed on 15th Oct 2017).
based multibag-of-visual-words model for remote
[22]. [Dataset] Yang Y. and Newsam S. 2010. Bag-Of-
sensing image scene classification. Journal of
Visual-Words and Spatial Extensions for Land-Use
Applied Remote Sensing. Vol. 10, no. 3, p. 035004.
Classification. ACM SIGSPATIAL International
[10]. Zou Q., Ni L., Zhang T., Wang Q. 2015. Deep
Conference on Advances in Geographic Information
learning based feature selection for remote sensing
Systems
scene classification. IEEE Geoscience & Remote
(http://vision.ucmerced.edu/datasets/landuse.html)
Sensing Letters., vol. 12, no. 11, pp. 2321–2325,
(Accessed on 15th Oct 2017).
Nov. 2015.
[23]. [Dataset]
[11]. Cheng G., Han J., Lu X. 2017. Remote Sensing Image Scene Classification: Benchmark and State of [12]. Langkvist, M., Kiselev, A., Alirezaie, M. & Loutfi, A. 2016. Classification and Segmentation of Satellite Orthoimagery Networks.
Using Remote
Convolutional Sensing,
Vol
Brazilian
GIS),
Coffee
2010.
Scenes
Dataset.
(www.patreo.dcc.ufmg.br/downloads/braziliancoffee-dataset) (Accessed on 17th Oct 2017).
[24]. [Dataset]
the Art. doi: 10.1109/JPROC.2017.2675998.
(ACM
NWPU-RESISC45.
(http://www.escience.cn/people/JunweiHan/NWPU -RESISC45.html.). (Accessed on 19th Oct 2017).
Neural 8(329);
doi:10.3390/rs8040329. [13]. Basu S., Ganguly S., Mukhopadhyay S., DiBiano R., Karki M., Nemani R. 2015. Deepsat: a learning framework for satellite imagery. Proceedings of the 23rd SIGSPATIAL International Conference on Advances in Geographic Information Systems, p. 37. ACM. Volume 3, Issue 3, March-April-2018
2134