Draft version January 3, 2017 Preprint typeset using LATEX style AASTeX6 v. 1.0
DEEP-HITS: ROTATION INVARIANT CONVOLUTIONAL NEURAL NETWORK FOR TRANSIENT DETECTION
arXiv:1701.00458v1 [astro-ph.IM] 2 Jan 2017
¨ rster2,1 , Pablo A. Est´ Guillermo Cabrera-Vives1,2,3,5, Ignacio Reyes4,1,5 , Francisco Fo evez4,1 and Juan-Carlos 2 Maureira Email:
[email protected] 1
Millennium Institute of Astrophysics, Chile
2
Center for Mathematical Modeling, Universidad de Chile, Chile
3
AURA Observatory in Chile
4
Department of Electrical Engineering, Universidad de Chile, Chile
5
These authors contributed equally to this work
ABSTRACT We introduce Deep-HiTS, a rotation invariant convolutional neural network (CNN) model for classifying images of transients candidates into artifacts or real sources for the High cadence Transient Survey (HiTS). CNNs have the advantage of learning the features automatically from the data while achieving high performance. We compare our CNN model against a feature engineering approach using random forests (RF). We show that our CNN significantly outperforms the RF model reducing the error by almost half. Furthermore, for a fixed number of approximately 2,000 allowed false transient candidates per night we are able to reduce the miss-classified real transients by approximately 1/5. To the best of our knowledge, this is the first time CNNs have been used to detect astronomical transient events. Our approach will be very useful when processing images from next generation instruments such as the Large Synoptic Survey Telescope (LSST). We have made all our code and data available to the community for the sake of allowing further developments and comparisons at https://github.com/guille-c/Deep-HiTSa. Keywords: methods: data analysis — methods: statistical — techniques: image processing — supernovae: general — surveys 1. INTRODUCTION
As in many other fields, large scale survey telescopes are already generating more data than humans are able to process, posing the need for new data-processing tools. Some examples are the Sloan Digital Sky Survey (SDSS, York et al. 2000), the Panoramic Survey Telescope and Rapid Response System (Pan-STARRS, Hodapp et al. 2004), the AllSky Automated Survey for Supernovae (ASAS-SN, Shappee et al. 2014), and the Dark Energy Survey (DES, Dark Energy Survey Collaboration 2016) among others. Furthermore, in the near future we expect to have the Large Synoptic Survey Telescope (LSST, LSST Science Collaboration 2009) operative, which will scan the whole southern sky every couple of days producing terabytes of data per night. These instruments allow us to explore not only the space domain,
a
Deep-HiTS is licensed under the terms of the GNU General Public License v3.0.
but also the time domain opening new opportunities for understanding our universe. The High cadence Transient Survey (HiTS, F¨orster et al. 2016), is aimed at detecting and following up optical transients with characteristic timescales from hours to days. The primary goal of HiTS is to detect supernovae (SNe) during their earliest hours of explosion. HiTS uses the Dark Energy Camera (DECam, Flauguer et al. 2015) mounted at the prime focus of the Victor M. Blanco 4 m telescope on Cerro Tololo near La Serena, Chile. The HiTS pipeline detects transients using difference images: a template image is subtracted from the science image taken at the time of observation and point sources are located within this difference image. A custom made pipeline does the astrometry, PSF matching, candidate extraction, and candidate classification into real or fake transients. Our previous approach uses random forests (RF, Breiman 2001) over a set of handmade features for candidate classification. Similar approaches have been used in the past by different groups including Romano et al.
2 (2006), Bloom et al. (2012), Brink et al. (2013), and Goldstein et al. (2015). The feature engineering approach usually requires an important amount of work done by the scientist in order to create representative features for the problem at hand. An alternative approach is to learn the features from the data itself. Convolutional neural networks (CNNs, Fukushima 1980) are a type of artificial neural network (ANN, McCulloch & Pitts 1943) that have recently gained interest in the machine learning community. CNNs have achieved remarkable results in image processing challenges, outperforming previous approaches (e.g. Krizhevsky et al. 2012; Razavian et al. 2014; Szegedy et al. 2014). Though CNNs have been applied to a variety of image processing problems, they have only recently caught the attention of the Astronomy community mainly thanks to the Galaxy Zoo Challenge. Dieleman et al. (2015) won the contest using a rotation invariant CNN approach. This approach was latter extended to data from the Hubble Space Telescope in Huertas-Company et al. (2015). In this paper we introduce Deep-HiTS, a framework for transient detection based on rotational invariant deep convolutional neural networks, and present the advantages and improved results obtained using this framework. We start by explaining the HiTS difference image data in Section 2. In Section 3 we explain the basics of ANN and CNN, as well as describing our model architecture. We then describe our experiments and show how the proposed CNN model significantly outperforms the feature engineering + RF approach in Section 4. We finally summarise this work and conclude in Section 5. 2. DATA
The HiTS pipeline finds candidates by using the difference of a science and a template image and it produces image stamps of 21 × 21 pixels for each candidate. In this paper we use data from the 2013 run, in which we observed 40 fields in the u band every approximately 2 hours during 4 consecutive nights. For the classification model we use four stamps: template image, science image, difference image, and signal-to-noise ratio (SNR) difference image (the difference image divided by the estimated local noise). For the purpose of training the classification model, we created a data-set of real non-transients (negatives hereafter) and simulated transients (positives hereafter). Negatives were produced by running the first steps of the HiTS pipeline including the astrometry, PSF matching, and candidate extraction over observed images. We evaluate the proposed model on the next step, which is candidate classification into non-transient or transient. Negatives are artifacts caused mostly by statistical fluc-
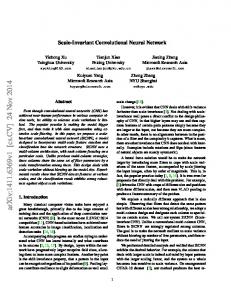
tuations of the background, inaccurate astrometry, and bad CCD columns. This produced 802,087 candidates which we labeled as negatives1 . Notice these negatives were produced by running the pipeline over real data, hence no simulation process is used for obtaining them. Positives were generated by selecting stamps of real PSF-like sources and placing them at a different location at the same epoch and in the same CCD they were observed. By doing this we simulated positives using real point like sources, hence reproducing how transients would look like. Point sources are obtained by first selecting sextractor (Bertin & Arnouts 1996) isolated sources which are present in both frames with a consistent position and flux, and whose: size is within 2 median absolute deviations from the median size of the sources of the image, total flux is positive, and minimum pixel value including sky emission is greater than zero. We also filtered out those sources that show a sextractor flux inconsistent with its optimal photometry flux (Naylor 1998), which we found to be a good discriminator between stars and galaxies. Positives are then added scaled to mimic the SNR distribution of the candidates found in the image (fitted power law distribution). Images with these simulated transients are run through the first steps of the HiTS pipeline (astrometry, PSF matching and candidate extraction) in order to get stamps of positives. As explained above, non-simulated detected candidates are taken as negatives. In order to keep a balanced data-set, we used the same number of positives as negatives. Figure 1 shows examples of negative and positive candidates and their respective stamps. 3. CONVOLUTIONAL NEURAL NETWORK
MODEL 3.1. Artificial neural networks CNNs are a type of artificial neural network (ANN, see Zhang 2000, and references therein). The basic unit of an ANN is called neuron. Each neuron receives a vector as input and performs a dot product operation between that vector and a set of parameters called weights. The resulting value plus a bias goes into a non-linear activation function, usually a sigmoid. Neurons are grouped in layers, each one with its own weights. In a multilayer perceptron, layers are stacked one after the other. The output of layer n, xn , depends on the output of layer n − 1, xn−1 , and is given by xn = f (Wn · xn−1 + bn ),
(1)
1 We are aware this data-set contains some point like transients not present in the reference image, but we conservatively estimate they will be less than a 0.2%.
3 NEGATIVES science difference
SNR image
template
science
difference
SNR image
template
science
difference
SNR image
template
POSITIVES science difference
SNR image
template
science
difference
SNR image
template
science
difference
SNR image
SNR = 50.05
SNR = 43.02
SNR = 9.27
SNR = 12.73
SNR = 5.55
SNR = 5.92
template
Figure 1. Examples of artifacts (negatives) and simulated transients (positives) at different signal-to-noise ratios. From top to
bottom artifacts are caused by statistical fluctuations of the background, inaccurate astrometry, and bad CCD column.
where Wn is the weight matrix, bn is the bias, and f is the activation function. These layers are called fullyconnected layers. ANNs are usually trained using an algorithm called error backpropagation, which adjust the weights of the network in an iterative way proportional to the gradient descent of the error with respect to the weights. In this work neural networks are trained using stochastic gradient descent (SGD, LeCun et al. 1998), where the gradient of the error with respect to the weights is estimated at each iteration using a small part of the data-set called mini-batch. That means that for every iteration the gradient is estimated as the average instantaneous gradients for a small group of samples (usually between 10 and 500), which provides a good trade-off in terms of gradient estimation stability and computing time. The learning rule for SGD is given by θt+1 = θt − η∇θ L,
(2)
where θ represents a parameter of the ANN (such as weights or biases), L is the loss function (e.g. mean squared error) and η is the learning rate. The learning rate controls the size of the steps that SGD makes in each iteration. Reducing the learning rate during training allows having a good compromise between exploration at the beginning and exploitation (local fine tuning) in the final part of the process. 3.2. Convolutional neural networks Convolutional neural networks (CNNs) usually contain two types of layers: convolutional and pooling layers. Convolutional layers perform a convolution operation between the input of the layer and a set of weights called kernel or filter. We extend Equation 1 by considering the input of the n convolutional layer to be a
stack of K arrays xk,n−1 (k = 1, . . . , K), the outputs as L arrays xl,n (l = 1, . . . , L) and the filters as matrices Wk,l,n . The output of layer n is then obtained as ! K X (3) xn,l = f Wk,l,n ∗ xk,n−1 + bl,n , k=1
where ∗ is the convolution operator, and bl,n are the biases of layer n. In order to add some flexibility on the output size of a layer, zeros can be appended in the input layer’s borders. This is called zero-padding. Pooling layers return a subsampled version of the input data. In the pooling layer the data is divided into small windows and a single representative value is chosen for each window, e.g. the maximum (max-pooling) or the average (mean-pooling). A common design for CNNs consist on a mix of convolutional and pooling layers at a first stage followed by dense fully-connected layers. Though sigmoids are usually chosen as activation functions, they are not the only choice. Rectified linear units (ReLU, Nair & Hinton 2010) are activation functions that have gained popularity in the last years because they can achieve fast training and good performance. The output of a ReLU is the maximum between the input and zero f (x) = max(0, x).
(4)
Leaky ReLUs are variants where the negative inputs are not set to zero but instead they are multiplied by a small number (e.g. 0.01) to preserve gradient propagation, x if x > 0, f (x) = (5) 0.01x otherwise. In order to reduce overfitting, a usual technique is
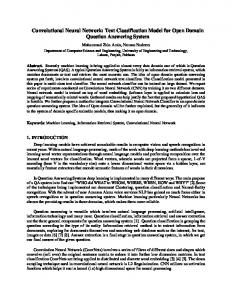
4 dropout (Srivastava et al. 2014), which consists in turning off random neurons during training time with a probability p, usually chosen as 0.5. The goal of dropout is to prevent coadaptation of the outputs, hence neurons do not depend on other neurons being present in the network. In order to preserve the scale of the total input, the remaining neurons need to be rescaled by 1/(1 − p). Dropout is activated only during training time. When evaluating models, all neurons become active. 3.3. Deep-HiTS architecture Preliminary results were presented in a conference paper by Cabrera et al. (2016) where a very basic CNN model was proposed achieving a performance comparable to the RF model. Here we extend these results by using a much deeper architecture and introducing rotational invariance as well as leaky ReLUs and dropout, significantly outperforming the RF model. Following Dieleman et al. (2015) we introduce rotation invariance by applying the convolutional filters to various rotated versions of the image, thus exploiting rotational symmetry present in transients images. Figure 2 shows the proposed rotation invariant convolutional neural network architecture. The template, science, difference, and SNR difference stamps are presented to the network as a stacked array of size 21 × 21 × 4. The convolutional architecture composed by the convolutional and pooling layers yields 2,304 features. Rotation invariance is incorporated by presenting every stamp to the convolutional architecture rotated four times, hence producing 2, 304 × 4 features. These 9,216 features are fed to three fully connected layers that return the probabilities of being an artefact and a real transient. After trying more than 50 different architectures and training strategies2 the best performance was obtained by the architecture shown in Figure 2. Our convolutional architecture is composed of two convolutional layers with filters of size 4 × 4 and 3 × 3 respectively, a 2 × 2 max-pooling layer, three 3×3 convolutional layers and a 2 × 2 max-pooling layer. Zero-padding was used in order to set the sizes of each layer to the ones shown in Figure 2 (24 × 24 for the first two and 12 × 12 for the last four). All convolutional layers use ReLUs. The concatenated output of all rotations are fed to three stacked fully connected layers: two ReLU layers of 64 units each, and a final logistic regression layer that outputs two probabilities: fake and real transient. 4. EXPERIMENTS
2 Most important improvements were achieved by adding more layers, number of parameters per layer, different activation functions, different training strategies (learning rates, dropout), and adding rotation invariance.
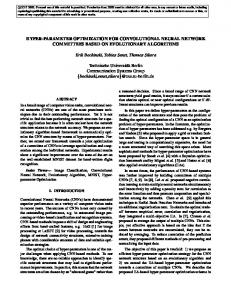
We used the candidates data-set described in Section 2 to assess the performance of the proposed CNN model and compare it against our previous random forest model. We split the data into 1,220,000 candidates for training, 100,000 candidates for validation, and 100,000 for testing. The CNN model is trained using SGD with mini-batches of 50 examples from the training set and 0.5 dropout. Learning rate was reduced to half every 100,000 iterations, starting with an initial value of 0.04. The validation data-set was used for measuring the performance of the model at training time and decide when to stop training. We assumed the model converged when after feeding 100,000 candidates the zero-one loss (fraction of misclassifications) does not go lower than a 99% of the previous loss. Once the model is trained, we use the test set (data unseen by the model) to calculate performance metrics. Figure 3 shows the zero-one loss of the model as a function of the number of iterations for the training and validation sets, and for the test set after training. Due to insufficient memory to store the whole training set, the training set curve is calculated over the last 10,000 candidates used for training at each iteration, while the validation curve shows the loss for the whole 100,000 candidates in the validation set. We programmed our code using Theano (Theano Development Team 2016) and trained our model on a tesla K20 graphics processor unit (GPU). The model converged after 455,000 iterations and took roughly 37 hours to train achieving an error of 0.525% over the validation data-set and 0.531% over the test set for this particular experiment. We compare the performance of the proposed CNN model against our previous RF model (implemented using scikit-learn Pedregosa et al. 2011). As stated above, we consider transients to be positives (P ) and non-transients to be negatives (N ). We use the following metrics to assess the performance of our models: TP + TN , (6) TP + FN + TN + FP TP precision = , (7) TP + FP TP recall = , (8) TP + FN precision · recall 2T P f1-score =2 = , precision + recall 2T P + F P + F N (9) accuracy =
where T P stands for true positives (number of positives correctly classified), T N stands for true negatives (number of negatives correctly classified), F P stands for false positives (number of negatives incorrectly classified as positives by the model), and F N stands for false negatives (number of positives incorrectly classified as negatives by the model). In order to make a fair com-
5
Figure 2. Architecture of the proposed rotational invariant CNN model. Blue boxes represent convolutional layers and red
boxes represent max-pooling layers. The stacked images of each candidate are presented to the network rotated four times in order to exploit rotational symmetry. The calculated feature maps of each rotation are flattened and stacked creating a 2, 304×4 vector that is fed to a fully connected network whose outputs are the probabilities of being an artefact and a real transient.
0.05
Training set Validation set Test set
0.04
error
0.03
0.02
0.01
0.00
0
100000
200000 300000 iteration
400000
Figure 3. Learning curve (evolution of the error during the
training process). The training set error is calculated over the last 10,000 candidates that were used for training. The test set error is calculated at the end of training. Validation error does not raise at the end of training, indicating that the model is not overfitted.
parison, we trained and tested the RF model with the same number of candidates (1,220,000 for training and 100,000 for testing). For both CNN and RF models, six train-validation-test splits were done using stratified shuffle split (i.e. maintaining positives and negatives balanced for all sets). Table 3 shows the mean accuracy, precision, recall, and f1-score obtained with the RF and CNN models and their respective standard deviations. All metrics show that the CNN model outperforms the RF model. To assess the statistical significance of these results, we performed a Welch’s hypothesis test (Welch 1947) obtaining a probability of less than a 10−7 that these results were obtained by chance.
6 Table 1. Comparison of RF and CNN models. CNN shows consistent better results than RF in terms of accuracy, precision, recall and f1-score. Results are statistically significant based on the calculated Welch’s T-test p-values, being all of them lower than 10−7 . Accuracy results show that the error of CNN model is almost half the error obtained with the RF model. model
accuracy
precision
recall
f1-score
RF
98.96 ± 0.03 %
98.74 ± 0.06 %
99.18 ± 0.02 %
98.96 ± 0.03 %
CNN
99.45 ± 0.03 %
99.30 ± 0.07 %
99.59 ± 0.07 %
99.45 ± 0.03 %
Welch’s T-test p-value
4.7 × 10⁻¹¹
2.8 × 10−08
9.7 × 10−08
4.5 × 10⁻¹¹
Figure 4 shows the detection error tradeoff (DET) curves of the RF and CNN models. The DET curve plots the false negative rate (FNR) versus the false positive rate (FPR) as we vary the probability threshold used to determine positives and negatives, where FPR =
FP , N
FNR =
FN . P
(10)
Figure 4a shows the overall DET curves for the RF and CNN models, while Figure 4b shows the DET curves for different SNR ranges. A better model would obtain smaller FPR and FNR, hence moving the curve to the bottom left of the plot. It can be seen again that the proposed CNN model achieves better performance than our previous RF model. The DET curve is also useful for evaluating the trade-off between false positives and false negatives. In practice, when observing in real time, most candidates will be negatives. All negatives on our dataset are real candidates taken from the HiTS pipeline: 802,087 obtained during 4 consecutive nights, i.e. approximately 200,000 negatives per night. The number of estimated real transients is considerably smaller than that. As an example, consider as user-defined operation point getting 2,000 false positives per night (FPR ∼ 10−2 ). Figure 4 tells us that by using the proposed CNN we will get a FNR ∼ 2 × 10⁻³ which is much better in comparison to a FNR ∼ 10−2 when using the RF model. This means 5 times less real transients would be missed by using the CNN model. On Figure 4b we can see that this improvement is mostly achieved by the proposed CNN being able to correctly classify low SNR sources. In Figure 5 we explore the performance of the RF and CNN models in terms of the size of the training set. For this purpose we saved 100,000 candidates for validation and trained each model with training sets of different sizes. It can be seen that the CNN model outperforms the RF model independently of the size of the training set used. Furthermore, by using a RF model trained over 106 candidates we obtain similar performance as
using a CNN model trained over 3 × 10⁴ . In order to test our framework over real data, we applied the RF and CNN models over SNe found in the 2014 and 2015 campaigns. For our 2013 campaign we observed in the u band filter, while in the 2014 and 2015 campaigns we observed in the g band filter. We used stamps from SNe at all epochs with a SNR over 5. During observation time HiTS found 47 SNe in the 2014 campaign and 110 in the 2015 campaign, giving a total of 1166 candidates (each SN has candidates at different epochs). Using the user-defined FPR of 10−2 described above, the RF model correctly classified 866 of these positive candidates (FNR = 0.257), while Deep-HiTS correctly classified 921 of them (FNR = 0.210). Notice that though we trained our models on u band images, we are still able to classify candidates in the g band filter. Figure 6 shows the number of positive candidates incorrectly classified for the SNe present in the 2014 and 2015 campaigns for the RF and CNN models in terms of the SNR. It can be seen that for a SNR below 8 the CNN model outperforms the RF model. These are the most important candidates when detecting transients in real time, as we hope to detect them at an early stage. For a SNR over 8 the RF model better recovers the true positives, which suggests the use of a hybrid model between RF and CNN. We will expand on this idea in future work. As we tested our model on real data from a different HiTS campaign, and also using a band filter different from the one used for training, we did not achieve the low FNR shown in Figure 4. However our CNN model is able to recover more true positives from images in the g-band filter than the RF-based model given the userdefined operation point described above. We currently do not have a robust way of measuring the false positives automatically in the 2014 and 2015 data-sets as the new observational setup yields a significantly larger population of unknown asteroids which would need to be removed from the set of negatives. Further research is needed in order to assess the best way of transferring
7
10 -1
10 -1
10 -2
10 -2 FNR
10 0
FNR
10 0
10 -3 10 -4 10 -5 -5 10
10 -3 10 -4
RF CNN 10 -4
10 -3 FPR
10 -2
10 -1
10 -5 -5 10
RF, SNR < 7, N = 16917 CNN, SNR < 7, N = 16917 RF, 7 ≤ SNR < 15, N = 55772 CNN, 7 ≤ SNR < 15, N = 55772 RF, SNR ≥ 15, N = 27311 CNN, SNR ≥ 15, N = 27311 10 -4
(a)
10 -3 FPR
10 -2
10 -1
(b)
Figure 4. Detection error tradeoff (DET) curve comparing a Random Forest model against the proposed CNN. DET curve plots False Negative Rate (FNR) versus False Positive Rate (FPR). A curve closer to the lower bottom indicates better performance. (a) Overall DET curves. (b) DET curves for subsets of candidates binned according to their signal-to-noise ratio (SNR), where N indicates the number of candidates per bin. The proposed CNN model achieves a better performance than the RF model for a FPR between 10−4 and 10−1 , where the HiTS pipeline operates. The biggest improvement occurs for the lowest SNR candidates.
0.07
Random Forest CNN
0.06 0.05
120
0.04
Error
SNe in the 2014 and 2015 campaigns CNN false negatives 160 RF false negatives 140 all positives 180
100
0.03
80
0.02
60
0.01
40
0.00
102
103
104 105 Training set size
106
20 0 0
10
20
SNR
30
40
50
Figure 5. Error over a validation data-set of 100,000 candi-
Figure 6. Comparison of RF and CNN models over real SNe
dates in terms of the size of the training set for the Random Forest and Convolutional Neural Network models.
from the 2014 and 2015 campaigns.
our CNN model between different data-sets in terms of recovering positives and negatives. 5. CONCLUSIONS
We introduced Deep-HiTS, a rotation invariant deep convolutional neural network (CNN) for detecting transients in survey images. Deep-HiTS discriminates between real and fake transients in images from the High cadence Transient Survey (HiTS), a survey that aims to find transients with characteristic timescales from hours to days using the Dark Energy Camera (DECam). We compared the proposed CNN model against our previous approach based on a random forest (RF) classifier trained over features designed by hand. Deep-HiTS not only outperforms the RF approach, but it also has the
advantage of learning suitable features for the problem automatically from the data. The proposed classification model was able to improve the overall accuracy of the HiTS pipeline from 98.96 ± 0.03 % to 99.45 ± 0.03 %. In practice, by using Deep-HiTS we can reduce the number of missed transients to approximately 1/5 when accepting around 2,000 transients per night. The use of deep learning models over next generation surveys, such as the LSST may have a great impact on detecting and classifying the unknown unknowns of our universe. Deep-HiTS is open source and available at GitHub (https://github.com/guille-c/Deep-HiTS), and the version used in this paper is archived on Zenodo (https://doi.org/10.5281/zenodo.190760). We gratefully acknowledge financial support from
8 CONICYT-Chile through its FONDECYT postdoctoral grant number 3160747; CONICYT-PCHA through its national M.Sc. scholarship 2016 number 22162464; CONICYT through the Fondecyt Initiation into Research project No. 11130228; CONICYT-Chile through grant Fondecyt 1140816; CONICYT-Chile and NSF through the Programme of International Cooperation project DPI201400090; CONICYT through the infrastructure Quimal project No. 140003; Basal Project PFB–03; the Ministry of Economy, Development, and Tourism’s Millennium Science Initiative through grant IC120009, awarded to The Millennium Institute of Astrophysics (MAS). Powered@NLHPC: this research was partially supported by the supercomputing infrastructure of the NLHPC (ECM-02). We acknowledge the usage of the Belka GPU cluster (Fondequip EQM 140101). This project used data obtained with the Dark Energy Camera (DECam), which was constructed by the Dark Energy Survey (DES) collaboration. Funding for the DES Projects has been provided by the U.S. Department of Energy, the U.S. National Science Foundation, the Ministry of Science and Education of Spain, the Science and Technology Facilities Council of the United Kingdom, the Higher Education Funding Council for England, the National Center for Supercomputing Applications at the University of Illinois at UrbanaChampaign, the Kavli Institute of Cosmological Physics at the University of Chicago, Center for Cosmology and Astro-Particle Physics at the Ohio State University, the
Mitchell Institute for Fundamental Physics and Astronomy at Texas A&M University, Financiadora de Estudos e Projetos, Fundao Carlos Chagas Filho de Amparo, Financiadora de Estudos e Projetos, Fundao Carlos Chagas Filho de Amparo Pesquisa do Estado do Rio de Janeiro, Conselho Nacional de Desenvolvimento Cientfico e Tecnolgico and the Ministrio da Cincia, Tecnologia e Inovao, the Deutsche Forschungsgemeinschaft and the Collaborating Institutions in the Dark Energy Survey. The Collaborating Institutions are Argonne National Laboratory, the University of California at Santa Cruz, the University of Cambridge, Centro de Investigaciones Enrgeticas, Medioambientales y TecnolgicasMadrid, the University of Chicago, University College London, the DES-Brazil Consortium, the University of Edinburgh, the Eidgenssische Technische Hochschule (ETH) Zrich, Fermi National Accelerator Laboratory, the University of Illinois at Urbana-Champaign, the Institut de Cincies de l’Espai (IEEC/CSIC), the Institut de Fsica d’Altes Energies, Lawrence Berkeley National Laboratory, the Ludwig-Maximilians Universitt Mnchen and the associated Excellence Cluster Universe, the University of Michigan, the National Optical Astronomy Observatory, the University of Nottingham, the Ohio State University, the University of Pennsylvania, the University of Portsmouth, SLAC National Accelerator Laboratory, Stanford University, the University of Sussex, and Texas A&M University. All plots were created using matplotlib (Hunter 2007).
REFERENCES Bertin, E., & Arnouts, S. 1996, A&AS, 117, 393 Bloom, J. S., Richards, J. W., Nugent, P. E. et al. 2012, PASP, 124, 921, 1175 Breiman, L. 2001, Machine Learning, 45, 1, 532 Brink, H., Richards, J. W., Poznanski, D. 2013, MNRAS, 432, 2, 1047 Cabrera-Vives, G., Reyes, I., F¨ orster, F. et al. 2016, in Proceedings of the 2016 International Joint Conference on Neural Networks (IJCNN 2016), Supernovae Detection by Using Convolutional Neural Networks (Vancouver, Canada), 251 Dark Energy Survey Collaboration, Abbott, T., Abdalla, F. B., et al. 2016, MNRAS, 460, 1270 Dieleman, S., Willett, K. W., & Dambre, J. 2015, MNRAS, 450, 1441 Flaugher, B., Diehl, H. T., Honscheid, K., et al. 2015, AJ, 150, 150 F¨ orster, F., Maureira, J. C., San Mart´ın, J. et al. 2016, ApJ, 832, 155 Fukushima, K. 1980, Biological Cybernetics, 36, 4, 193 ´ Goldstein, D. A., DAndrea, C. B., Fischer, J. A. et al. 2015, AJ, 150, 82 Hodapp, K. W., Kaiser, N., Aussel, H., et al. 2004, Astronomische Nachrichten, 325, 636 Huertas-Company, M., Gravet, R., Cabrera-Vives, G. et al. 2015, ApJS, 221, 1, 8 Hunter, J. D. 2007, Computing In Science & Engineering, 9, 3, 90
LeCun, Y., Bottou, L., Orr, G., Mller, K. 1998, in Neural Networks: Tricks of the Trade, ed: Montavon, G., Orr, G.,, Mller, K. (Springer), 9 LSST Science Collaboration, Abell, P. A., Allison, J., et al. 2009, arXiv:0912.0201 Krizhevsky, A., Sutskever, I. & Hinton, G. E. 2012, in Proceedings of the Neural Information Processing Systems Conference, Imagenet classification with deep convolutional neural networks (Lake Tahoe, NV, USA), 1097 McCulloch, W. & Pitts, W. 1943, The Bulletin of Mathematical Biophysics, 5, 4, 115 Nair V., Hinton G. E., 2010, in Proceedings of the 27th International Conference on Machine Learning (ICML-10), Rectified linear units improve restricted boltzmann machines (Haifa, Israel), 807 Naylor, T. 1998, MNRAS, 296, 339 Pedregosa, F., Varoquaux, G., Gramfort, et al. 2011, Journal of Machine Learning Research, 12, 2825 Razavian, A. S., Azizpour, H., Sullivan, J. et al. 2014, in Proceedings of the IEEE Conference on Computer Vision and Pattern Recognition Workshops (CVPRW), CNN features off-the-shelf: an astounding baseline for recognition (Columbus, OH, USA), 512 R. Romano, C. R. Aragon, and C. Ding, 2006, in Proceedings of the 5th International Conference on Machine Learning and Applications, Supernova recognition using support vector machines (Orlando, FL, USA), 77
9 Shappee B. J. et al., 2014, ApJ, 788, 48 Srivastava N., Hinton G., Krizhevsky A., Sutskever I., Salakhutdinov R., 2014, Journal of Machine Learning Research, 15, 1929 Szegedy, C. Liu, W., Jia, Y. et al. 2014, arXiv::1409.4842 Theano Development Team, 2016, arXiv:1605.02688
Welch, B. L. 1947, Biometrika, 34, 1/2, 28 D. G. York and SDSS Collaboration, 2000, AJ, 120, 1579 1587 Zhang, G. P. 2000, Systems, Man, and Cybernetics, Part C: Applications and Reviews, IEEE Transactions on, 30, 4, 451462