optimum amount of degrader material was determined by adjusting the amount of Be in such a way that the number of ...... M.A.B.Beg; Ann. of Phys. 13(1961) 110 ...... gevaar voor de volksgczondheid" haar betekenis geheel verloren hebben.
> = |cD> + G T n A I O >
,
(2.2)
where l> represents the incoming pion wave and G the Green's function, which is given by G=(E-K1t-HN+ie)"1. The pion-nucleus scattering matrix T nA satisfies the Lippmann-Schwinger equation T„ A = V + V G T r t
.
(2.3)
We now further assume that the pion-nucleus interaction may be treated as if it were composed of undisturbed individual JtN-scatterings. Therefore, in analogy with eqs.(2.2) and (2.3), the multiple scattering of the pion in the nucleus is defined by the equations A
I ¥ > = I < J > > + G E tnl4'n>
,
(2.4a)
A
i y n > = l < D > + G £ tml4'm>
.
(2.4b)
m=l
tn = v n + v n G T „
.
(2.4c)
where I *Pn > is the fractional wave incident on nucleon number n and t,, the pion-bound nucleon scattering matrix. If we limit ourselves to coherent scattering, which means that the nucleus remains in its initial (ground) state, we can derive a one-body Schrodinger equation for the pion wave function, which wave function is defined as \|/(r) = < r n 0 l ¥ >
,
where CIQ represents the nucleus in its ground state.
(2.5)
In the closure approximation we neglect the dynamics of the nucleus so that we can replace the many-particle Green's function by the free-pion Green's function G = (E-Kn-HA+ie)"'= G0=(E-Kn+ie)"1 .
(2.6)
This approximation assumes that the excitation energies and kinetic energies of the nucleons can be ignored. Under certain restrictive conditions [Beg 61, Aga 73, Hiif 73] the in-medium TtNscattering matrix T, may be replaced by the free space nN-matrix t on the energy shell, so that the pion-nucleus scattering matrix T nA is viewed as a sequence of elementary free space pion-nucleon interactions wherein off-shell effects, which cannot be extracted from free space 7tN-scattering, are absent. These conditions are: a) the nucleons can be considered as frozen to their positions, b) the range of the icN-interactions is such that the potentials generated by two adjacent nucleons never overlap. In the case of eq.(2.4c) this is known as the impulse approximation and asserts that free and bound nucleons scatter in the same way. Under such conditions the free pion-nucleon scattering amplitude f can be introduced by means of the relation ,,/k UM k-»o ■"••" k->o -
3
,
(2.17)
where 82T,i. 82721 a r e t n e P u r e strong interaction s and p-wave phase shifts, respectively. As is obvious the pion-nucleon scattering amplitude can be written as a function of individual pionnucleon scattering lengths and volumes which are measurable quantities. Ignoring for the moment spin and isospin dependence in the pion nucleon scattering amplitude, only the terms bg and Cgof eq.(2.15) are retained, the Schrodinger equation as expressed in eq.(2.13) can be written as (A+kV(r)=2mU ( "(r)T(r)
,
(2.18)
with IjC(r) the first order optical potential found by Kisslinger [Kis 55] Ur°
~ C(r,r') = 0 ,
no correlation at long distance
(2.23)
Ir-r'l
lim—» 0 C(r,r') = - 1 , two nucleons cannot occupy the same place.
(2.24)
lr-r'l
This requirement on the correlation function means that the nucleons in the nucleus are supposed to move independently as long as they are further apart than the distance rc but can never come closer to each other than this distance. For this reason the correlation function defined in eq.(2.22) is called the hard-core correlation function and rc the hard-core radius. With this property for the nucleon-nucleon correlation function and assuming low energy pions (kr c «l) the optical potential in second order, often referred to as the Ericson-Ericson potential [Eri 66], is found to be U(r) = - j g - ( q ( r ) - V °*r) V) 2m 1 + 4/37t^a(r)
,
(2.25)
with
q(r) = ( l + ^ ) b 0 p ( r ) mN u
,
(2.26)
and a(r) = ( l + $ L ) ' ' c 0 p(r)
.
(2.27)
11
Compared to the first order potential in eq.(2.19) the p-wave part is renormalized due to the pair correlation. This phenomenon reminds one of the Lorentz-Lorenz effect in electrodynamics where the local field E]oc is larger than the averaged field E in a polarized medium given by
with T| the mean polarizability of the medium (see for instance Born & Wolf [Bor 75]). From eqs.(2.8) and (2.11) a similar relation follows
Els
with r rad and TA the radiative and Auger-widths, respectively. The radiative and the Auger-width can be calculated by the computer code STARKEF [Tau 78]. As can be read in chapter 6 the contributions of the upper level are negligible compared to the lower level which justifies the approximation made in eq.(2.45). By means of an intensity balance for the 2p-level, the strong interaction width rfp can be obtained. From the measured X-ray spectrum one can deduce the ratio of the yield of the 2p—>ls X-ray transition, Y rad (2p-»ls), versus the population of the 2plevel, P(2p), according to Yra"(2p->ls)
Yrad(2p->ls)
P(2P)
I Y rad (n',/ '->2p) + Z YA(n',/ ' -»2p)
(2.46)
17
In this expression Yrad equals the intensity of the observed X-ray transition whereas the Augeryield can be calculated. For this ratio the following expression also holds .
Y r a a (2p->ls)
P(2P)
rrad
X =
=
2 P ->1.
s r-+r2 p
+
(2 4 ? )
r2Ap
from which two relations rfp follows.
2.3.1 Non strong interaction contributions to pionic energy levels All effects which contribute to the pionic energy level and which are not governed by the KleinGordon equation as given by eq.(2.38) are to be calculated separately. The experimental value of a pionic transition is then corrected according to eq.(2.44) to abstract the shift which can be compared to the prediction of a particular set of optical potential parameters as defined in eq.(2.42). A brief description of these corrections is given below whereas a list of the estimated values can be found in chapter 6.
2.3.2 Vacuum polarization The electron of a virtual electron-positron pair creation in the Coulomb field of the nucleus tends to be attracted to the nucleus. This phenomenon is referred to as vacuum polarization. The vacuum polarization changes the electrostatic potential of the nucleus over a distance of the order of the Compton wavelength of the electron (~10"ncm) and since the average pionic orbit size is comparable to or smaller than this wavelength, the orbiting pion is inside the vacuum-polarization charge cloud of the nucleus. As a consequence of this phenomenon, the energy levels in a pionic atom obtain a negative shift (stronger binding): the pion senses a charge larger than the nominal charge Ze of the nucleus. Using the expressions for the vacuum polarization found in the references [Bio 72, Bor 76, Rin 75] the shifts can be calculated to the orders of a(aZ), a 2 (aZ), a(aZ) 3 , a(aZ) 5 and a(aZ) 7 .
2.3.3 Orbital electron screening The electron cloud in a pionic atom decreases the effective charge of the nucleus experienced by the pion and results in an energy shift of the pionic atom level. For pionic orbits with principal quantum numbers n < 10 most of the atomic electrons are far outside the region spanned by such orbits. Screening depends almost only on the K and L-electrons. This effect can be calculated
18 using a relativistic Hartree-Fock procedure as given by Vogel [Vog 73]. The main uncertainties in the calculations result from the unknown numbers of K and L-electrons taking part in the screening. Owing to the Auger effect during the cascade of the pion, the electronic shells are partly emptied. The calculations take into account the Auger effect and the refilling of the electronic K and L-shells during the cascade to obtain the mean population of these shells.
2.3.4 Electromagnetic polarization Nuclear polarization is die effect that the orbiting pion influences the nucleus by separating the protons and neutrons with respect to the nuclear center-of-mass. In return, the nucleus can polarize the orbiting pion due the large potential difference over the pion radius (=1 fm). The additional energy shifts produced by the polarization of the nucleus by the electric field from the pion (and vice versa) are e.g. given by Ericson and Hiifner [Eri 72].
2.3.5 Lamb shift The 'bare' mass of the pion is essentially the mass which appears in the Klein-Gordon equation. But the observed mass has a component associated with the electromagnetic selfinteraction of the pion. This process consists of the emission and the subsequent re-absorption of a virtual photon by the pion, which results in an energy shift of the pionic level. Calculations of this effect are performed according to the method of Klarsfeld and Maquet [Kla 73].
2.3.6 Electromagnetic form factor The pion is represented as a point charge in the Klein-Gordon equation which is not fully correct since the pion has a charge structure (=1 fm), i.e. a form factor. The perturbing potential introduced by the pion form factor can be found in reference [lac 71]. It is found that the energy shift due to this effect is strongly n-dependent and is observable only in the ls-levels.
2.3.7 Reduced mass effect In the Klein-Gordon equation the reduced mass was used instead of the relativistic pion mass and, therefore, does not take all relativistic effects into account. Relativistic reduced mass
19 corrections are discussed by Barrett et al. [Bar 73] for the Dirac atom case. The result is assumed to hold also for the Klein-Gordon situation.
2.4 Hyperfine structure The non-spherical part of the strong and electromagnetic interaction gives rise to a hyperfine splitting of each mesic level for nuclei with spin I > 1. Under the assumption that the deformation of the nucleus is of quadrupole shape only, the energy shift e(F) and level width T(F) of any given member (/ ,I,F) of the hyperfine multiplet, relative to the point-nucleus value, are given [Sen 72] by e(F) = A j X ( / , I , F ) + e 0 +(E 2 -ReA 2 )C(/,I,F) r(F) = r 0 + ( r 2 - 2 I m A 2 ) C ( / , I , F )
,
(2.48)
.
In this expression n,/ are the quantum numbers of the unperturbed mesic orbit, and 1 is the nuclear spin. The shift e0 and width F 0 stem from the monopole part in the Coulomb potential V c and the strong interaction potential U. Due to the quadrupole part of the strong interaction potential, an additional shift e2 and width T2 occur, which are calculated by Koch and Scheck [Koc 80]. The magnetic dipole moment of the nucleus and the magnetic field created by the pion's orbital motion causes a hyperfine interaction indicated by Aj [Dey 75]. Furthermore, A2 is the electric hyperfine constant due to the electric quadrupole part of V~ and C(/, I,F) is the angular momentum factor of quadrupole hyperfine structure
[keV]
Fig.4.4b The Ge-energy spectrum of Co frays measured with an asymmetric BGO-shield as displayed above. The ungated y-ray spectrum is given by the upper curve and the lower one results after ignoring those events accompanied by a signal in the suppression shield.
32
S^JDiscU^-10180 S,_|Disc S
71
stop
Computer Busy /T-i
Disc _T *-y
BGO _ TFA ' JCFhrJ~l-S Ge,
Spec Amp
Pile Up
GateADC , Stop TDC!
ADC,
Fig.4.5 Simplified electronic scheme for the measurement ofpionic X-rays with Germanium detectorsfittedin anti-Compton shields.
33
Furthermore, the Ge-detectors were placed in Compton suppression shields of mainly BGO (see figs.4.3a and 4.4a for the two types used). The front parts of the suppression shields are composed of Nal(Tl). The scintillation efficiency of Nal is a factor of eight higher than that of BGO, which makes Nal more suitable to detect low energy y-rays produced by backward Compton scattering. Compton-scattered y-rays from the Ge-counter seen by the suppression shield are used to produce a veto signal for the corresponding Ge-energy signal. The performance of this Compton suppression system is illustrated in figs.4.3b and 4.4b. A combination of spectroscopy amplifiers (Canberra, model 2021) and pile-up rejectors (model 1468A) provided signals, corresponding to y-ray energies measured with the Ge-detectors, for 8192 channel Laben ADC's (model 8215) as is depicted in the electronic scheme of fig.4.5. For simplicity we limit the discussion to the case of no additional requirements, such as signals from extra Nal-detectors and the like as discussed later. Pile-up rejectors were necessary to prevent pile-up of subsequent y-ray signals from a Ge-detector. The pile-up rejectors are capable of discriminating between two events having a minimum separation of 500 ns. Outgoing count rate (OC) pulses provided by the pile-up rejectors were incorporated in the event trigger such that only single-energy events during the processing time of the amplifiers were taken into account. Geenergy signals were split and fed into pulse-shaping filter amplifiers (TFA 474, Ortec) and constant fraction discriminators (CFD 934, Ortec) for amplification and timing of the Ge-signals, respectively. A typical CFD-delay used for the Ge-signals was about 24 ns providing amplitudeand rise-time compensation. The chosen delay along with the zero-crossing adjustment of the CFD's were mainly responsible for the time resolution which was about 10 ns for the prompt time peak as shown in fig.4.2a. By applying an anti-coincidence of the CFD-output with the BGOcrystal signal, a trigger indicating a "Compton-free" Ge-energy was obtained. The ultimate event trigger occurred after a coincidence with the pion-stop from the telescope. Every Compton free Geenergy was stored in 16k, 24 bits Camac histogram modules (LeCroy model 3588), regardless of the presence of an event trigger. Secondly only those energies accompanied by an event trigger were registered into 64-words(16 bits) deep first-in first-out (FIFO) modules. In this way a general data acquisition program [Laa 85] allowed to write coincident data in list mode on magnetic tape as well to accumulate on-line spectra which could be displayed on a terminal screen during the measurement.
4.2 Pionic
24
Mg and
27
AI measurements
Some years ago the maximum Z-values for which strong interaction shifts and widths of pionic levels had been investigated were Z=10 and Z=33 for the Is and 2p-orbits, respectively. Beyond these Z-values, the relevant X-ray transitions become increasingly wider and weaker and
34
c 3 o
energy
t
[keV]
10-
energy .
[keV]
Fig.4.6 Spectra of pionic 27Al measured with a target of 3.97 glcm2thickness. The upper spectrum was recorded during a test run at NIKHEF. The lower one was measured at PSI with a thin target and a well tuned pion telescope in order to suppress the influence of the muonic 2p—>ls X-ray transition.
35 therefore more difficult to separate from the background, especially if these transitions are also obscured by nuclear y-ray transitions. In the case of 27A1 the pionic 2p—>ls X-ray transition at about 363 keV is obscured by the muonic 2p—>ls transition at 345 keV and by a nuclear y-ray at 350 keV, as is illustrated in fig.4.6. This nuclear y-ray at 350 keV is mainly produced by the reaction 27Al(7t\2p4ny)21Ne which occurs after the pion ends its atomic cascade in the nucleus. The spectra of fig.4.6 were obtained with a Compton-suppressed Ge-detector, in which case the suppression shield consisted of Nal scintillation material only, at the NIKHEF facility with a rather thick Al-target of 3.97 g/cm . To reduce the strong muon contamination, which is seen in the upper spectrum taken during a test run, a beam telescope was installed to provide a clean pion trigger. As is shown in the lower spectrum of fig.4.6 a significant improvement was obtained; the u.X-transition strength is reduced by a factor of about 3.5. This, however, is still not good enough for a meaningful analysis of the pionic 2p—»ls X-ray transition. Besides the use of Compton suppression shields, necessary for a good peak-to-background ratio, an additional method has been applied to reduce the interference of possible nuclear y-rays. In the 27A1 measurement the aim was to reduce the occurrence of the 350 keV nuclear transition in Ne in the energy spectra of the Ge-detectors. There are several possible strong nuclear y-rays besides the 350 keV transition in Ne, e.g. the 440 keV in Na and at higher transition energies the 1274 keV in 22Na and 1368 keV in MMg, which occur in different exclusive reactions after the pion is absorbed from its atomic orbit. By measuring the energy spectra of the Ge-detectors in coincidence with an event in an array of Nal-crystals viewing the target, it may be possible to recognize these nuclear transitions in the spectra of the Nal-crystals. Off-line compilation of an energy spectrum of one of the Ge-counters in coincidence with windows, imposed on the spectra of the Nal-crystals covering the different nuclear y-ray energies seen in these spectra, would yield a Ge-energy spectrum "free" of the 350 keV photo peak. 01
0\
TX
The pion-absorption reactions in Al which end with a Ne nucleus and a Na nucleus in an excited state, producing the 350 keV and 440 keV y-rays, respectively, are of the same probability and by far the most important ones. An inconvenient side-effect of these two absorption reactions, 27 Al(7t",2p4ny)21Ne and 27Al(;i",p3ny)23Na, is the emission of neutrons (of roughly 25 MeV). Off-line discrimination against the (n,n') reactions of these prompt neutrons in the Nal-crystals by means of the time-of-flight method, requires measuring with a rather large solid angle. The status of the data acquisition system at that time did not allow the recording without too many problems of several Ge-channels (both in energy and time) and Nal-channels. Furthermore, in view of the short allocated beam time we decided to arrange a total of eight 12.7 cm (diameter) x 12.7 cm (long) NaI(Tl)-crystals around the target at a rather short distance of about 12.5 cm, (see fig.4.7) and to measure without applying the time-of-flight method to the Nal-counters. Analysis of the Nal-specrra showed that the nuclear y-rays were overshadowed by gamma radiation abundantly produced by (n,n') reactions in Nal and that, due to the lack of time spectra
36
Be-degrader
i Al target
I
45°T
Beam. S, S ,
20 cm
Beam
8 cm
1W lHjl^-5=g^a%7l
♦ S
Nal
J
Veto counter
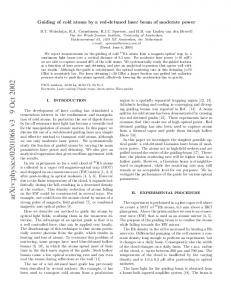
Fig.4.7 Schematic view of the setup for the measurement of pionic 27Al. An array of eight 12.7 cm (diameter) x 12.7 cm (long) Nal(Tl)-crystals was used to detect nuclear y-rays after pion absorption. Plastic veto counters were placed in front of the NaI(Tl)-crystals to discriminate against charged particles. Compton-suppressed Ge-detectors were placed in the horizontale plane; the Na(Tl)-detectors viewed the target from above and below.
37
, 1
. .
i
.
.
.
.
|
. . .
,
.
-
2 ,
21
19
ou3
ir>3 10
.
.
.
.
i
.
.
.
.
i
Na
I*
-
Mg
-' -
F
us c
i
511
T
127, I
i 2 7 , '
J luX
2P -* y w y j y * y w ^
10 2
200
250
300
350
400
450 energy
500 550 , [keV]
200
250
300
350
400
450 energy
500 > [keV]
Fig.4.8 Pionic X and y-ray spectra of27Alfor one of the Ge-detectors. The upper spectrum is a singles y-ray spectrum of events only coincident with a valid pion stop in the target. The^ lower one results from the additional requirement of a coincidence signal in any of eight Nal(Tl)-crystals viewing the target.
38
S
500 550 ♦ [keV] i
21
o4_ -
21 ,9
ol
l
i
.
.
.
1
.
.
.
.
1
.
Ne
-
23, ■fa Mg
5 ii
F
r L
2,
i
127
Na
16
^ ^ ^ s s ^
III j " mk^
y 1,1.l
n X2p-» l s - H i j
200
I
250
300
350
J iWftt 400
450 energy
I
ww 1 "If* 1
500 550 , [keV]
Fig.4.9 Pionic X and y-ray spectra of 24 Mgfor the same Ge-detector. The upper spectrum was measured in coincidence only with a valid pion stop in the target. The lower one was recorded in coincidence with an additional signalfroman array of eight Naf(Tl)-crystals.
39 for the Nal-crystals, no off-line time-of-flight discrimination was possible. Despite the missed opportunity to suppress the influence of the 350 keV transition in 21Ne, the incorporation of the coincidence with the Nal-crystals in the event trigger improved the quality of the energy spectra of the Ge-detectors. This improvement is illustrated by the two spectra of fig.4.8. These 27A1 spectra were recorded at the PSI-facility using an 27Al-target with a thickness of 0.54 g/cm2. Both Geenergy spectra are Compton suppressed and recorded in coincidence with a valid pion stop in the target, since the corresponding ADC was gated in such a way. The histogram spectrum, upper part of fig.4.8, shows all Ge-events converted by the ADC, whereas the lower spectrum of fig.4.8 is composed of those Ge-events which were in addition coincident with a signal in any of the Nal-crystals. As a result of this additional requirement the peak-to-background ratio of the pionic 2p—»ls transition has improved from 20% to 30%. Furthermore, the 2p—>ls ^X-ray transition has almost entirely disappeared due to the cleaner pion trigger accomplished with the additional Nal requirements. A similar improvement was found for the two spectra of pionic Mg depicted in fig.4.9. In this measurement also a remarkable reduction of the 2p—> 1 s ^X-ray transition was obtained. The target of nalMg had a thickness of 1.74 g/cm .
4.3 Pionic
28
Si measurement
For the case of 28Si the muonic 2p—>ls X-ray transition of 400 keV (see fig.4.10) and the nuclear y-rays from the reactions 28Si(7C",p2ny)25Mg, 28Si(7t",2ny)26Al and 28Si(7t",2p3ny)23Na at 392, 417 and 440 keV, respectively, strongly hinder a relevant analysis of the pionic transition. To improve the peak-to-background ratio and to reduce the influence of the muonic 2p—> 1 s X-ray transition, this measurement was performed in coincidence with charged particles emitted after pion absorption. The target, composed of circular plates of nalSi with a diameter of 76 mm and a total thickness of 0.8 mm, was mounted in a vertically placed cylindrical wire chamber. The advantage of this method, compared to the former one with NaI(Tl)-counters, is that a wire chamber is not sensitive to neutrons. Thus, there is no need to record time-spectra for off-line timeof-flight discrimination. The experiment was performed at PSI using one of the cylindrical multiwire proportional chambers of low mass which are part of the large-solid-angle magnetic spectrometer SINDRUM [Ber 85]. The wire chamber, as depicted in fig.4.11, consisted of 192 wires and had a length of 360 mm and an inner diameter of 127 mm. It was divided into 6 sections of 32 wires, each with its own electronics. A typical wire profile belonging to valid pion stops followed by the detection of a charged particle is shown in fig.4.12. The front section of 32 wires facing the incident beam was used as a trigger on the incident pions and was as such a part of the telescope together with the rear section of the chamber (wires 97-128), providing a stop veto for every traversing particle.
40
i
.
21 I9
4
.
.
i
.
.
.
2 1
*
.
Mg
.
.
i
.
.
o
.
i
23
F
.
.
.
.
i
.
.
■
i
Na
26
A1 I
10-
,27
. -
.
I
511 127 I
"Mg"?
j
I/
1 —-A£>J
3
lOl
I ^v U4J MJ/1if 1
j
hw L
nX2p_>ls2^_
2 30
250
300
35 0
400
450
ft
—
ilAJ
500
—
550
energy
> [keV]
450 energy
5O0 550 > [keV]
Fig.4.10 Pionic X and y-ray spectra of28Sifor the same Ge-detector. The upper spectrum is a singles y-ray spectrum of events only coincident with a valid pion stop in the target. The lower one was recorded with an additional coincidence signal in a cylindrical wire chamber surrounding the target.
41
0 = 127 mm
:
P
1
2mm
Fig.4.11 Schematic view of the experimental setup used for the measurement ofpionic Si. A cylindrical wire chamber was used for charged particle detection,which are emitted after pion absorption, is vertically placed in the beam.
10 20 30 40 50 60 70 80 90 100
140
wire numbers Fig.4.12 Wire profile of a vertically placed, cylindrical wire chamber with 192 wires. The front section, 1-32, faced the incident pion beam and the rear section, wires 97-128, was used to veto traversing particles. Two lateral sections, wires 33-96 and 129-192, triggered on charged particles emitted after pion absorption.
42
In this arrangement two sections at each side of the chamber (wires 33-96 and 129-192) were left to detect the charged particles emitted after pion absorption, which were mainly protons. As a result of the clean pion trigger, accomplished by the coincidence with charged panicle emission following the absorption, the recorded spectrum, lower part of fig.4.10, is almost free from the muonic 2p—>ls X-ray transition as well as to a large extent free from the 417 keV nuclear y-ray from the reaction 28Si(jt",2nY)26Al.
4.4 Pionic
93
Nb,
nat
Ru,
na,
Ag and
na,
Cd
measurements
The pionic X-ray spectra of 93Nb, natRu, ratAg and nMCd were measured during a single beam period of two weeks. As is reflected in fig.4.2b the suppression of neutron induced background is of importance for the measurement of these isotopes. All spectra were recorded in the setup as displayed in fig.4.1. To discriminate against neutrons emitted after pion absorption by means of time-of-flight, the Ge-detectors were placed at a distance of about 40 cm from the target. Only for pionic Nb and natRu did the measured spectra permit an analysis of the 3d—»2p pionic X-ray transition and hence for a determination of the width and shift of the 2p-level. In contrast to the 93 Nb and nalRu spectra the pionic spectra of nalAg and natCd did not show a 3d—>2p transition and therefore it was only possible to determine the shift and width of the pionic 3d-level. The natural 93Nb-target had a thickness of 5.5 g/cm2 and had a chemical purity of 99%. The Ru, Ag and Cd-target were all targets with natural abundances and had thicknesses of 3.25, 2.75 and 2.53 g/cm2, respectively, each with a chemical purity of 99.9%.
43
Chapter 5 Methods of data analysis
5.0 Introduction
.
In order to determine shifts and widths of broad and low intensity pionic 2p—>ls X-ray transitions, an accurate fit procedure to the measured data is of central importance. Although in principle a straightforward least-squares method can be used and the statistical error calculus embodies the determination of the covariance matrix they do not account for systematic errors, and the principal problem to be solved in the fit procedure is that of systematic uncertainties. Systematic errors often represent the dominant source of uncertainties; they are also generally the most difficult ones to estimate. Factors that largely contribute to the systematic error are in particular uncertainties in: a) the representation of the detector response function, b) the background determination, c) the estimation of the step function, d) contamination of unknown lines under the broadened line of interest (see chapter 3). In order to deduce final results with a high level of confidence, special attention was paid to these components of the systematic error.
5.1 Detector response function The line shape (detector response) of a Ge-detector for mono-energetic y-rays has been determined from an analysis of several strong y-ray peaks that appeared in the measured spectra. In addition line shapes were obtained by using calibration sources. A Gaussian line shape with tails on both sides was found to form a good representation of the detector response. It is defined by Aexp{^(^+2(x-x0))41n2/rG2}
,
Aexp{ - ( x - x 0 ) 2 4 1 n 2 / r G 2 )
x„ - 5, ls X-ray transition and a radiative width V^ = 2.5 eV, one obtains from eq.(2.47) a 2p-level strong interaction width of rfp = 75.7 ± 7.0 eV. This result is in good agreement with the value 72.5 ± 1.8 eV found by Chambrier et al. Neglecting the absorption from the pionic 3d and higher levels, about 2% of the captured pions reach the ls-level. It is therefore that special techniques, as described in chapter 4 are a prerequisite to detect such weak (and broad) peaks. Fig.6.2 shows the measured pionic 2p—»ls Xray transition in 24Mg. The y-lines of 21Ne at 350.72(6) keV and of 23Na at 439.999(9) keV are taken for the energy calibration in this region. A linear energy calibration yields a value of 323.4 ± 0.4 keV for the pionic 2p—>ls X-ray transition . The presented value E^pil^s = 323.4 ± 1.2 keV is given with an error of 5% of the width for reasons given in section 3.1. The systematic error due to the background is minimized by selecting a large energy interval of 150-700 keV. In this large fit interval several regions free from photo peaks were selected for matching the background function (including the step contribution of every peak in the interval). For the determination of the line shape (detector response), the strong nuclear y-ray of 21Ne was chosen, the line shape parameters of which were used in the tailed-Gaussian Lorentz convolution for the pionic 2p—>ls X-ray transition. The strong interaction shift e l s is obtained by applying eq.(2.44). In table 6.5 the Coulomb transition energy E c and the contributions from a number of other processes (see section 2.3.1), taken together in E , are presented. The composition of E =2.19 keV is given in table 6.14. For the case of 24Mg a shift e l s = -82.7 + 1.2 keV is found, a value which is reasonably well reproduced by the four optical potential parameter sets, listed in table 6.5. The deduced strong interaction width rfs of the pionic ls-level is given in table 6.6 together with the predicted values. Here the corrections to the pionic 2p—>ls X-ray transition width are negligible; the strong interaction width of the 2p-level is less than 0.3 % of the ls-width and the radiative width is even smaller. There is convincing agreement between the experimental result rf s = 24.3 ± 1.0 keV and the theoretical values. These new results on pionic Mg as well as those on Al contradict the earlier reported anomalously small strong interaction ls-level width of 17.2 ± 1.6 keV in Mg [Taa 85], which was a factor of 1.5 smaller than expected from the available optical models. The present value is also supported by the recent value reported for pionic 23Na by Britton et al. [Bri 87]. The main
54
Table 6.2 The pionic X-rays observed in the measured spectrum of Al. The quantity I is the relative intensity of the observed X-ray and fa the relative intensity according to the computer code STARKEF. All intensities are normalized to the 3d—>2p transition. jrel
E[keV]
transition 4f->3d 5f->3d
30.0 44.1
3d->2p 4d->2p 5d->2p 6d->2p 7d->2p 8d->2p 9d->2p
87.51 117.91 131.99 139.64 144.21 147.20 148.8
ycal
94.0 10.2 100 ±6 13.7±0.8 6.2±0.4 3.0±0.2 1.1±0.1 0.4
±0.01 ±0.01 ±0.01 ±0.01 ±0.01 ±0.02
100 (norm) 13.1 6.6 3.1 1.2 0.47 0.11
higher transitions—>2p Auger transitions—>2p 2p->ls
300
0.53 0.16 3.810.3
362.3 11.4
320
340
360
380
400
420
440
energy Fig.6.3 The pionic 2p->ls X-ray transition in 27Al at 362.3 ±1.4 keV.
460 > [keV]
55
reason for the difference in result with earlier NKHEF-data is mainly due to the almost complete suppression of the muonic 2p->ls X-ray transition at 296 keV and due to the large fit interval selection possible with a new fit program (section 5.5), resulting in a much better estimate of the background on the low energy side of the pionic transition. Furthermore, the background both from neutrons and Compton events is better suppressed thanks to the new coincidence technique with Nal-crystals applied (see section 4.2). In the new coincidence measurement, an improvement of the peak-to-background ratio by a factor of two was achieved with respect to the earlier experiment. In addition, the influence of the muonic 2p—»ls X-ray transition at 296 keV has been eliminated. The above presented results are given for Mg which was the main isotope (78.99%) in the natural Mg-target used. This implies that the contributions of the other isotopes, 10.00% 25Mg and 11.01% 26Mg were neglected.
6.1.2 Pionic ls-level in
27
A1
Similar to the MMg case, the intensities of X-rays feeding the 2p-level in pionic 27A1 match the values from the computer code STARKEF rather well, as is shown in table 6.2. For the energy calibration in this region nuclear y-lines in 19 F, 109.894(1) and 197.143(4) keV and in 127 I, 202.860(8) keV, were used. By performing the intensity balance calculation for the pionic 2plevel with n 2 ° d = 3.48 eV we find a strong interaction width rfp =111 + 12 eV. Earlier reported experimental values for the pionic 2p-width are 102 ± 19 eV [Kir 78] and 120 + 7 eV [Bat 78]; the value 120 ± 7 eV is adopted in the data base of appendix A. Since the Al nucleus carries a spin I = 5/2 and has a quadrupole moment Q = 0.140(2) b(arns) [Led 78] the 2p—>ls transition forms a hyperfine complex, the components of which are listed in table 6.3 with Fel the relative intensity and AE the energy of the sublevels relative to the centre of gravity. Table 6.3 Relative intensities and energy displacements of the pionic 2p—>ls hyperfine multiple! in 27Al. Transition
Irel
AE[eV]
2p 7 / 2 ->ls 5 / 2 2p 5 /2->ls 5 / 2 2P3/2-» ls 5/2
100 74.96 50.01
17.3 -55.3 48.4
56
Table 6.4 The pionic X-rays observed in the measured spectrum of28Si. The quantity lrel is the relative intensity of the observed X-ray and f1 the relative intensity according to the computer code STARKEF. All intensities are normalized to the 3d—>2p transition.
transition
E [keV]
Trel
35.2 51.5
4f->3d 5f->3d
102.5 12.3
101.51 ±0.01 136.81 ±0.01 153.15+0.01 162.01 ±0.01 167.09 ±0.01 170.76 ±0.02 173.1
3d->2p 4d-»2p 5d->2p 6d->2p 7d->2p 8d->2p 9d->2p
100 ±6 12.8±0.8 6.1+0.4 2.4±0.1 1.3±0.1 0.5
100 (norm) 11.8 6.3 3.4 1.5 0.63 0.15
higher transitions—»2p Auger transitions—>2p 2p-»ls
0.70 0.09
424.1 ±2.0
2.9
c
3 O
10 _ 350
400
450
500 energy
Fig.6.4 The pionic 2p->ls X-ray transition in 28Si at 424.1 ±2.0 keV
550 ► IkeV)
57 These values were obtained with the computer code PIONDELTA with as input the strong interaction quadrupole parameters t^, T2> ReA2 and ImA2 (see eq.2.48), calculated by the code MESON (section 2.5), and adopting a nuclear magnetic moment u = 3.641504(2) (standard nuclear magnetons) [Led 78] for the calculation of At. The hyperfine splitting is of minor importance in this case since the neglect of the hyperfine splitting for 27A1 introduces an error of less than 0.5% in the width of the pionic 2p—>ls X-ray transition. As can be noticed from figs. 6.3 and 4.6 there is a remarkable improvement in the suppression of the background between the two recorded spectra. Without this better suppression of the background and also of the muonic 2p—>ls X-ray transition at 346 keV the analysis of the pionic transition would have been extremely difficult. By correcting the experimental energy of the pionic 2p—»ls X-ray transition for the electromagnetic contributions given in table 6.5 (and 6.14), the strong interaction shift of the lslevel was found to be e ls = -115.5 ± 1.4 keV. The optical potential predictions, as listed in table 6.5, are found to be in good agreement with that value. Also, the measured strong interaction width of the ls-level rfs = 28.8 ± 1.2 keV is well reproduced by the optical potential parameter sets; see table 6.6. The good agreement between theory and the present experimental results for 24 Mg and 27A1 entails that the optical potential of eq.(2.37) describes the deeply bound pionic lslevels rather well and that there is no indication for an anomaly or saturation.
6.1.3 Pionic ls-level in
28
Si
As depicted in fig.6.4 the pionic 2p—»Is X-ray transition in 28Si can only be fitted with a large uncertainty. Debit to this are not only the y-lines on top of the transition but also the unknown structures at the high energy side around 475 keV. In the histogram energy spectrum (a spectrum recorded without any additional requirements than a valid pion stop in the target; see section 4.1) these structures are much more pronounced as is shown in the upper spectrum of fig. 4.10, giving the opportunity to determine the line shape. Thanks to the experimental technique applied, i.e. the additional requirements of coincidences with charged particles emitted after pion absorption, the muonic 2p—»ls X-ray transition at 400 keV and the nuclear y-line in 27A1 at 417 keV are almost entirely suppressed. The intensities feeding the pionic 2p-level are again, as for 24Mg and 27A1, well predicted by the code STARKEF; see table 6.4. In order to obtain a constraint on the pionic 2p—Ms X-ray transition, in this case the known strong interaction 2p-width rf = 196.2 ± 5.3 eV [Cha 85] and the value for the radiative width T^ = 4.67 eV were used explicitly. It was found that the pionic 2p-»ls X-ray transition is about 2.9% of the 3d—»2p transition. This value was used in the fit of the 2p—»Is X-ray.
Table 6.5 The experimental strong interaction pionic Is-level shift eis deducedfrom the measured transition energy E%pL,i, using eq.(2.44). The quantity E%p_>is is the calculated point Coulomb transition energy and E$£-tls is the sum of the electromagnetic contributions to the transition energy as listed in table 6.14. Also given are the predictions of the shifts according to the optical potential parameter sets of table 3.1. E!pi,is
E^
E^„
e„
[Tau71]
[Tau71]
[Bat 78]
5=0
5=1
5=1
5=1
[keV]
[keV]
[keV]
[keV]
[keV]
[Sek 83]
[keV]
[keV]
[keV]
Mg Al
323.4±1.2 362.3+1.4
403.88 475.37
2.19 2.43
-82.7+1.2 -115.5±1.4
-79.6 -111.3
-79.2 -110.8
-76.1 -111.3
-76.6 -113.8
Si
424 ±2
552.75
2.92
-132 ±2
-133
-132
-128
-130
28
Table 6.6 Comparison between the measured strong interaction ls-level width TS[S and the calculated values using the four optical potential parameter sets of table 3.1. The measured transition width rfp^,/, is correctedfor according to eq.(2.45). The quantity r'f* is the radiative width and rf p the strong interaction width of the pionic 2p-level. rlp^is [keV] 24
^
d
r§
[keV]
[keV]
24.4±1.0
1.42 IO"3
Al
28.9±1.2
3
1.67 IO"
Si
41 ±4
1.94 IO 3
Mg
28
rf, [keV]
72.511.1 IO'3 24.311.0 3 120 ±7 io- 28.811.2 io-3 41 14 196 ±5
[Tau71]
[Tau71]
[Bat78]
5=o
5=1
5=1
[Sek 83]
5=1
[keV]
[keV]
[keV]
[keV]
23.1 28.9 37
22.8 28.6 37
24.8 29.3 39
22.1 25.0 35
59 ■
■
'
I
l
l
I
I
I
I
I
.
I
I
I
—1—■
'
■
'
1—i
I
I
1
'.
• . .
i . . .
•
i . .
■
■ i . . . .
i
4f->3d Pionic
5
Nb
io:
-
c
5f-»3d
4JuJ
10.
I .1
6f->3d | ?f^3d
w Ukl J J j L iiH 1
10f
V -
-;3d
(1
1
L9f-^3d
250
300
350
400
450
500
550 600 energy _
|
tfb*:
650 700 ♦ [keV]
Fig.6.5 Part of the pionic X-ray cascade observed in the energy spectrum of93 hNb. Table 6.7 The pionic X-rays observed in the measured spectrum of 9HNb. The relative intensity of the observed X-ray is given by fel and /""' is the relative intensity according to the computer code STARKEF. All intensities are normalized to the 4f—>3d transition. E [keV]
transition 6g->4f 5g^4f
216.6 140.3
4f->3d 5f->3d 6f->3d 7f->3d 8f->3d 9f->3d 10f->3d
307.79 448.84 525.39 571.50 601.64 619.83 633.55
rrel
109.5 14.5 ±0.02 ±0.07 ±0.07 ±0.06 ±0.05 ±0.06 ±0.06
100 ±6 9.8±0.6 3.4±0.2 3.3±0.2 1.9±0.1 0.7±0.1 0.8±0.1
higher transitions—» 3d Auger transitions—» 3d 3d-»2p
879
jcal
100 (norm) 8.9 2.6 1.3 0.73 0.32 0.37 0.46 0.07
±3
14.1±0.8
60
280
290
300
310
320 energy
Fig.6.6 The pionic 4f->3d X-ray transition in 93Nb at 307.79 ± 0.02 keV.
330 ► [keV)
61 The results listed in table 6.5 and 6.6 reflect that the pionic 2p-»ls transition in 28Si with e l s = -132 ± 2 keV and rf s = 41 ± 4 keV are again quite well reproduced by the optical potential calculations.
6.2.1 Pionic 2p and 3d-ievel in
93
Nb
The measurement of the 3d—»2p pionic X-ray transition in Nb is greatly hindered by neutron induced reactions like 72Ge(n,n'Y) with a neutron edge at 834.14 keV which covers the transitions to be measured. As explained in chapter 4 time-of-flight discrimination of these neutrons emitted after pion absorption yields a prompt energy spectrum entirely free from these neutron peaks as was clearly shown in fig.4.2. In this case we have to determine the strong interaction width of the 3d-level, rf d, in order to deduce the width of the deeply bound 2p-state. In fig.6.5 the pionic X-ray transitions feeding the 3d-state are clearly seen. The deduced intensities, along with the theoretically calculated values are listed in table 6.7. The intensities of the 4f~>3d and 3d->2p transitions given are those of a hyperfine complex since 93Nb carries a spin I = 9/2 and has a quadrupole moment Q = -0.32(2) barns [Pov 73]. This nuclear spin gives rise to a 15 and a 9 fold splitting as listed in table 6.8, with relative intensities Table 6.8 Relative intensities and energy displacements of the pionic 4f—>3d and 3d—>2p hyperfine multiplets in 93Nb. 4f->3d Transition 15/2 —> 13/2 13/2 -> 11/2 13/2 —> 13/2 11/2 —> 9/2 11/2 —» 11/2 11/2 —> 13/2 9/2 —> 111 9/2 —> 9/2 9/2 —> 11/2 7/2 —> 5/2 7/2 —» 7/2 7/2 —> 9/2 5/2 —> 5/2 5/2 —» 7/2 3/2 —> 5/2
3d->2p yre]
100.00 67.24 20.20 41.33 31.30 2.31 21.67 34.44 6.36 7.87 30.47 11.65 19.66 17.85 25.02
AE[keV] 0.142 -0.184 0.203 -0.168 -0.168 0.219 0.042 -0.182 -0.182 0.325 0.012 -0.211 0.291 -0.021 0.261
yrel
AE[keV]
100.00
-1.037
51.37 35.11
2.497 -0.650
17.51 46.82 7.80
-1.365 2.497 -0.650
34.98 22.51
-1.588 2.273
42.88
-1.901
Irc , and at energies AE from the centre of gravity. In the calculation of the hyperfine splitting (section 2.4) a nuclear magnetic moment |j. = 6.1705(3) (standard nuclear magnetons) [Led 78] is
62
I
I
I
■ ■
O
10'Z.S0I->ZC
■8
>
ep c ©
-in
ON
z
I
o
■V~t
00
ore6£-!s
w LZ'LLL -IS VLXSLXZ
sjunoo
o r-
63
Table 6.9 The pionic X-rays observed in the measured spectrum of ""'Ru. The relative intensity of the observed X-ray is given by fe andfcal is the relative intensity according to the computer code STARKEF. All intensities are normalized to the 4f—>3d transition. E [keV]
transition 6g->4f 5g->4f
249.4 161.6
125.0 17.6
4f-»3d 5f->3d 6f->3d 7f->3d 8f->3d 9f->3d 10f->3d
355.57 517.82 606.85 659.59 694.65 719.32 734.17
100 ±6 8.6±0.5 2.1+0.1 1.6±0.2 2.2±0.1
±0.08 ±0.16 ±0.15 ±0.11 ±0.11 ±0.22
100 (norm) 8.7 2.3 1.1 0.60 0.28 0.22
higher transitions—»3d Auger transitions—»3d 3d->2p
981 . .
1.0 0.08 10.0±0.8
±7
1 . .
>l
7cX4f ->3d
^
-
o ^ 3
8 1
nat
pionic
Ru
1\ -
CO
4
£ ^ ON
3d transition the hyperfine splitting is small, it was taken into account in the determination of the strong interaction 3d-width F ^ ; see below. Also in the case of the 3d—»2p transition the hyperfine splitting was accounted for explicitly in the fit to the strong interaction broadened line. By applying the intensity balance calculation with the values of table 6.6 and by using a radiative width of F^ = 62.18 eV a strong interaction width of rf d = 470 + 40 eV is found. The shape of the pionic 4f->3d transition at 307.79 ± 0.02 keV (fig.6.6) enabled us to obtain a more precise value for the 3d-width. To this end the total transition width is corrected by the theoretical value for the strong interaction 4f-width and the radiative width of the initial and final level according to the program PIATOM (parameter set [Bat 78] as input). This results in a value of rfd = 402 + 16 eV, which is in good agreement with the value obtained from the intensity balance. Compared to the optical potential prediction for the 3d-width as presented in table 6.13 there is no discrepancy. This also holds for the 3d-level shift of e 3d = 0.74 ± 0.02 keV as is listed in table 6.12. In fig.6.7 the 3d—»2p pionic X-ray transition as it appears in the energy spectrum is shown as a broad peak underneath and surrounded by many nuclear y-ray transitions. For a reliable fit a large energy interval (350 keV) was selected for a good background (plus step) estimation; it contains more than 100 photo-peaks. From the/analysis of the 3d—»2p hyperfine complex we found the strong interaction shift to be e2p = -11 ± 3 keV and the width r | = 64 ± 8 keV. In tables 6.10 and 6.11 these values are listed along with the calculated values. As explained in section 5.3, the shift e0 obtained is that of the centroid of the hyperfine complex. The calculated values e2 are according to the parameter set [Bat 78]. The width deduced is not corrected for the strong interaction quadrupole width, that means we neglect this contribution in the calculated values. A negative shift for the pionic 3d—>2p X-ray transition in 93Nb was already predicted by Krell and Ericson [Kre 69], who calculated a change of sign from the fact that the attractive p-wave interaction was balanced by the repulsive s-wave in the region Z=36. This is the first time a negative value for the strong interaction shift of a pionic 2p-orbit is explicitly found.
6.2.2 Pionic 2p and 3d-level in
nat
Ru
The "44RU target used was composed of the following isotopes with abundances: 96 Ru 5.52%, 98Ru 1.88%, " R u 12.7%, 100Ru 12.6%, 101Ru 17.0%, 102Ru 31.6% and 104 Ru 18.7%. Only the isotopes 99Ru and 101Ru have a nuclear spin different from zero, both have a spin I = 5/2. The calculation of pionic transition intensities as well as of the electromagnetic contributions as listed in table 6.14 were performed for the most abundant isotope 102Ru. For the
66
Fig.6.10 The pionic 4f->3d X-ray transition in ""Ag at 406.69 ± 0.10 keV.
380
400
420
440
T 460
'
r
480 energy _
500 - [keV]
Fig.6.11 The pionic 4f->3d X-ray transition in """Cd at 424.54 ± 0.09 keV.
67 pionic 3d->2p X-ray transition no hyperfine complex is included. Considering the quadrupole moments for 99Ru and 101Ru, Q = 0.076(7) and Q = -0.44(4), respectively, and the low abundances, only a negligible effect can be expected. In the former case of 93Nb (100%) with a nuclear spin 9/2 and a quadrupole moment of Q = -0.32(2), the energy difference between the two most intense members represented only 5% of the transition width. Here it would be an order of magnitude smaller. A strong interaction width of rfd = 871 ± 90 eV is obtained from the intensity balance by making use of the values from table 6.9 and adopting a radiative width of I ^ j d = 82.47 eV. The 4f->3d transition (fig.6.8) yields a 3d-shift and width of e3d = 1.39 + 0.08 keV and rfd = 0.75 ± 0.08 keV, respectively; see also tables 6.12 and 6.13 for a comparison with calculated values. The pionic 2p-level shift and width were obtained from the spectrum shown in fig.6.9. Values for the strong interaction shift and width deduced are e ^ = -48 ± 7 and rfp = 77 ± 24 keV. This case represents the deepest bound pionic 2p-orbit measured at present.
6.3.1 Pionic 3d-level in
nat
Ag and
na,
Cd
As might already be expected from the pionic 3d—»2p transition for "JjRu in fig.6.9, no reliable 2p-data can be extracted from the spectra of "^Ag and n4gCd. The 4f—>3d X-ray transitions as displayed in figs. 6.10 and 6.11 can easily be fitted to determine pionic 3d-level shifts and widths. For the natural Ag-target both isotopes 107Ag (51.8%) and 109Ag (48.2%) have a nuclear spin less than unity and therefore no hyperfine spitting occurs. The pionic X-ray transitions in nalCd are not hyperfine split either since m C d (12.80%) and 113Cd (12.22%) have a spin I = 1/2 whereas all the other isotopes, 106 Cd (1.25%), 108 Cd (0.89%),' 1 0 Cd (12.49%),112Cd (24.1%), u 4 Cd (28.73%) and 116Cd (7.49%) have zero spin. The 3d-level shifts and widths found are e 3d = 1.94 ± 0.07 keV and rfd = 1.44 ± 0.05 keV for Ag and E3d = 2.14 + 0.09 keV and rfd = 1.65 ± 0.07 keV for na'Cd. These values compare well with the values obtained by Batty et al. [Bat 79] (e3d = 1.83 ± 0.07 keV, rfd = 1.41 ± 0.05 keV for pionic nalAg and e3d = 2.20 ± 0.09 keV and rfd = 1.56 ± 0.05 keV for natCd).
nal
6.4 Conclusions The two sets of optical potential parameters [Bat 78] and fSek 83] were taken for a comparison with the presented experimental data. For the ls-cases (24Mg, Al and Si) we find, contrary to the expectations when we began this work, that the optical model description with the 'old' parameters is a rather good one. As to the strong interaction shifts e ]s , the 1983 calculation is slightly better, but the only serious deviation (8% with five experimental standard deviations) is
68 that of Mg in both theoretical estimates. The widths are almost too nicely reproduced by [Bat 78], whereas the [Sek 83] calculation is of the order of 10% low (or two experimental standard deviations). As to the 2p-levels, the calculations again yield values that are generally in agreement with the experimental data within their errors. The only comment may be is that in the calculations of [Sek 83] the widths were found too low by about two standard errors. For the 3d-levels presently determined, however, two comments should be made. The [Bat 78] calculation is able to reproduce all data except the shift of natRu (15% too low, or three experimental standard deviations). The 1983 theoretical calculations are significantly worse for most cases; see table 6.12 and 6.13. Altogether, there is no sign being detected of a structural anomaly such as had been found earlier for deeply bound pionic 3d-levels and as preliminary results for ls-levels indicated.
Table 6.10 The experimental strong interaction pionic 2p-level shift e2p deduced from the measured transition energy Ef3xf_^2p using eq.(2.44). The quantity E^d_>2p 's tne calculated point Coulomb transition energy and E%%+2p 's tne sum of the electromagnetic contributions to the transition energy as listed in table 6.14. Also given are the predictions of the shifts according to the optical potential parameter sets of table 3.1. h
93
Nb nat
Ru
3d-*2p
fc
3d->2p
cCor tOd-^p
£
2P
[Tau71]
[Tau71]
[Bat 78]
4=o
[Sek 83]
4=1
4=1
4=1
[keV]
[keV]
[keV]
[keV]
[keV]
[keV]
[keV]
[keV]
879+3 981±7
883.88 1021.37
6.55 7.13
-11±3 -48+7
-13 -32
-14 -35
-17 -43
-23 -52
Table 6.11 Comparison between the measured strong interaction 2p-level width rjp and the calculated values using the four optical potential parameter sets of table 3.1. The measured transition width re3xf-,2p ■ ' * corrected for the strong rad interaction width rjd and the radiative widths r of initial andfinal level to obtain the strong interaction width r f „ .
93
Nb Ru
y-exp 1 3d->2p
T-r ad
[keV]
[keV]
65+8 78+24
0.64 0.85
1
3d+2p
rid [keV] 478±16 10 3 3 850+8 io-
1P
[Tau71]
[Tau71]
[Bat 78]
4=0
4=1
4=i
4=1
[keV]
[keV]
[keV]
[keV]
[keV]
60 78
59 76
57 70
47 57
64±8 77±24
[Sek 83]
Table 6.12 The experimental strong interaction pionic 3d-level shift deduced from the measured transition energy E^f%3d using eq.(2.44). The quantity E^f^d is the calculated point Coulomb transition energy and E^j^3d is the sum of the electromagnetic contributions to the transition energy as listed in table 6.14. Also given are the predictions of the shifts according to the optical potential parameter sets of table 3.1. pexp fc 4f^3d
93
Nb Ru Ag Cd
PC Z 4 f-»3d
pCor
E3d
[Sek 83]
[Tau71]
[Tau 71]
[Bat 78]
4=0
4=1
4=i
4=i
[keV]
[keV]
[keV]
[keV]
[keV]
[keV]
[keV]
[keV]
307.79±0.02 355.57±0.08 406.69±0.10 424.54±0.09
305.43 352.22 402.41 419.93
1.62 1.96 2.34 2.47
0.7410.02 1.39+0.08 1.94±0.07 2.14±0.09
0.66 1.12 1.74 2.07
0.67 1.12 1.77 2.03
0.73 1.16 1.91 2.04
0.66 1.04 1.71 1.79
Table 6.13 Comparison between the measured strong interaction 3d-level width T3d and the calculated values using the four optical potential parameter sets of table 3.1. The measured transition width re4xJl^3d is correctedfor the strong interaction width r^and the radiative widths Trad of initial andfinallevel to obtain the strong interaction width r3d . Hf^d
Hf^d
rff
rfd
[Tau 71]
[Bat 78]
4=o
4=1
4=i
[Sek 83]
4=1
[keV]
[keV]
[keV]
[keV]
[keV]
[keV]
[keV]
0.47810.016
0.075
0.001
0.40210.016
0.405
0.413
0.459
0.404
Ru
0.85 ±0.08
0.100
0.001
0.75 ±0.08
0.75
0.75
0.81
0.71
Ag
1.57 10.05
0.129
0.002
1.44 10.05
1.26
1.28
1.40
1.21
1.79 10.07
0.140
0.003
1.65 10.07
1.54
1.54
1.61
1.39
Nb
[keV]
[Tau 71]
nat nat nat
Cd
Table 6.14 Electromagnetic
contributions
3d->2p transition in 93Nb and
to the pionic 2p—>ls X-ray transition in
W2
Ru and to the 4f->3d transition in 93Nb,
102
Ru,
Mg,
Al and
Si, to the
107
Ag and "4Cd. The values for
vacuum polarization in 1-, 2-, 3-, 5- and 7-order, electron screening, nuclear polarization, hadron polarization, Lamb shift, electromagnetic formfactor and reduced mass effect are listed.
vpl
vp2
vp3
vp57
elscr
npol
hpol
lams
formf
redm
[keV]
[keV]
[keV]
[keV]
[keV]
[keV]
[keV]
[keV]
[keV]
[keV]
Mg
2.1716
0.0165
-0.0004
0.0000
-0.0001
0.0113
0.0101
0.0276
-0.0513
0.0093
A1
2.4061
0.0184
-0.0005
0.0000
-0.0001
0.0292
0.0119
0.0332
-0.0757
0.0105
Si
2.8821
0.0221
-0.0007
0.0000
-0.0001
0.0180
0.0164
0.0378
-0.0672
0.0137
93
Nb
6.3636 0.0480
-0.0078
-0.0002
-0.0026
0.1190
0.0393 -0.0218
-0.0019
0.0106
102
Ru
7.1322 0.0541
-0.0081
-0.0003
-0.0029
0.1521
0.0490 -0.0269
-0.0026
0.0125
Nb
1.6182 0.0113
-0.0073 -0.0097
-0.0002 -0.0004
-0.0058
0.0037
0.0012
0.0000
0.0000
0.0027
-0.0066
0.0059
0.0019
0.0000
0.0000
0.0032
-0.0124
-0.0005
-0.0075
0.0086
0.0000
0.0000
-0.0134
-0.0006
-0.0078
0.0103
0.0029 0.0032
0.0000
0.0000
0.0040 0.0041
24 27
28
93 102
Ru
107
Ag
114
Cd
1.9512 0.0137 0.0164
2.3258
2.4565
0.0174
73
Chapter 7 Fits of the optical potential parameters
7.0 Introduction The analysis of strong interaction level shifts and widths in pionic atoms yields essential information on the 7t"-nucleus interaction at zero total energy. These data can be seen as supplementary to the information from low energy pion-nucleus scattering. Therefore, values of optical potential parameters derived from pionic atom data are expected to be related to the zeroenergy extrapolation of these parameters from the scattering experiments. But unlike scattering experiments, where the energy and momentum transfer vary, these quantities are fixed in pionic atom experiments and where one can distinctly select the angular momentum state. Recent pionic atom experiments, using high-resolution solid state y-ray detectors to investigate pion absorption occurring from the atomic Is, 2p, 3d and 4f-orbits, have yielded much more accurate results than previously achieved. The present data on pionic Is and 2p-levels and the recently reported results on the 3d and 4f-orbits in 181Ta, nal Re, natPt, 197Au, 208 Pb and 209Bi along with earlier reported precise values are given in appendix A (tables A1-8); a total of 140 data points. The standard optical potentials that have been presented so far (table 3.1) are able to describe the more peripheral pionic atom states for most nuclei, but they consistently fail to describe the strong interaction shifts and widths of the more deeply bound levels in the heavy elements mentioned above [Ach 84, Laa 85, Laa 88]. The experimental values for the 3d-shifts and widths for these cases are significantly smaller than those predicted by standard optical potentials [Laa 88], a trend which is not observed in the pionic Is and 2p-data. The main aim of the present discussion is to construct a parameter set for the optical potential given eq.(2.37) that yields a better overall description for all pionic atom data, notably for the deeply bound 3d-levels. Nuclear parameters necessary for the calculation of strong interaction pionic shifts and widths are listed in table A.9. For each isotope the proton density parameters cp and t_ (see eq.(2.40)) are given as well as those for the neutron density, cn and ct. The fermi-distribution parameters for the protons are taken from muonic atom and electron scattering data [Vri 87]. Hartree-Fock calculations by Angeli et al. [Ang 80] and an investigation of 1 GeV proton scattering data by Hoffman et al. [Hof 80] provided us with the neutron density parameters c n and t„. In some cases the neutron density is taken to be equal to the proton density. For nuclei with spin I > 1 the nuclear deformation parameter P (related to the quadrupole moment Q) is also listed.
74
208
>
Theory
Pb Im Ct = Im B, Acnp=0.14fm
70. Ac np =0.21 fin
60.
-0.15/-0.04
50.
40 -
-0.25/-0.08 o 15
20 £(3d)
25 [keV]
Fig. 7.1 Experimental and theoretical data on pionic Pb, in a plot of widths versus shifts I Laa 88]. The double square point gives the theoretical value for cn = cp (using the parameter set of Batty el al. [Bat 78]). The almost horizontal line shows the linear behaviour for non-zero cn-c but zero isovector absorption terms. Starting from the value for cn- cp = 0.14 fm, the influence of non-zero ImBj and ImCj are shown (lines for only one of the two differing from zero, points for three combinations of non-zero terms).
7.1 Extension of the optical potential In order to obtain a better matching with the experimental data, especially for the pionic 3dlevels, we extended the optical potential with the s-wave and p-wave TtNN-isovector terms B, and C] ( see eq.(2.37)). De Laat [Laa 88] showed that an improved fit of the deviating 3d-shifts and widths could be achieved by adding absorption isovector terms ImB, and ImCj. In fig.7.1 we show the result of the experiment on pionic 208Pb as performed by De Laat. The theoretical value according to the parameter set [Bat 78] is indicated by the double square in the upper right corner of the figure. By taking the neutron density different from the proton density as given by Hoffman
75 et al.[Hof 80] and by Angeli et al. [Ang 80], the experimental 3d-data of 208 Pb can be reached by adding isovector absorption terms ImB, and ImCj different from zero to the standard optical potential (see fig.7.1). The conviction that the standard optical potential needs the extension discussed, is supported by similar substantial improvements obtained for 181Ta, nal Re, nalPt, 197 Au and 209Bi [Laa 88].
7.2 Parameter fits As mentioned in the introduction to this chapter, the results of four parameter sets out of the many published ones have been chosen for comparison to the updated experimental compilation given in appendix A; For the calculation of the shifts and widths the program MESON (see section 2.3.9) was used. As explained earlier the experimental data of table A. 1-8 differ from the data sets of [Tau 71], [Bat 78] and [Sek 83]. Many of the new experimental results presented in this appendix were not part of their data sets. Again we have taken a systematic error of 5% of the level width for the corresponding strong interaction shift; see chapter 3. Preliminary parameter fits to the experimental data given in appendix A, using the optical potential according to eq.(2.37), all yielded values for ReB, that were not significantly different from zero. Therefore, in all the fits discussed hereafter the parameter ReB[ was kept fixed to zero. Common to most published fits the full Lorentz-Lorenz effect was taken into account by setting
7.2.1 Fits of s-wave (and p-wave) strong interaction parameters We have selected the available ls-data for nuclei with Z > 5. Data from pionic atoms with lower Z were kept outside the data base of appendix A. For the lightest nuclei the optical approach is less suited, for those cases detailed microscopic calculations are more successful. In order to illustrate the dependence of the s-wave parameters on the pionic ls-data of tables A.l and A.2 several different fits have been performed. In table 7.1 (fit I) the values for the swave parameters are listed, as resulting from a fit to the 28 pionic.ls-data points with all p-wave parameters set to zero. Another approach to fit the s-wave strong interaction parameters is to adjust the parameters bu, ReB0 and ImB0 to the 14 available experimental ls-data points for Z=N nuclei in the region 5 < Z < 14. By selecting Z=N nuclei the parameters b] and Bj play a minor role since these appear in the potential in terms with 8p(r)=pn(r)-pp(r). After b0, ReB0 and ImB0 have reached their ultimate values in the Z=N fit, those values are kept fixed in the next step, i.e. in fitting b| and ImB, to all the 28 ls-data points. This procedure is then iterated until Q 2 0lal for either step
76 does not change anymore. This procedure ends with a fit wherein b 0 , ReB0 and ImB0 stem from the ls-data with Z=N and bj and ImB! from all ls-data. The final result of this procedure is given as fit II in table 7.1. In this case we have used the values for the p-wave parameters from the best fit; see below and one but last column of table 7.1. Treating the p-wave parameters as constants is justified because to first order those values are insensitive to the ls-data. By leaving all five s-wave parameters free to vary when fitting to all the 28 ls-data points simultaneously and using again the values for the p-wave parameters from the best fit, wefinda slightly different result. These values are listed as fit III in table 7.1. From these three fits to the lsdata it follows that the different choices for the p-wave parameters do not significantly affect the values for the s-wave parameters as deduced from the ls-level shifts and widths. There are 26 data points available with pionic level shifts and widths in Z=N nuclei (14 lsorbits and 12 2p-orbits) to fit the parameters b 0 , ReB0, ImB0, c0, ReC0 and ImC0. After these had been determined, they were kept fixed in the fit of b1; ImB], c,, ReCj and ImC[ to the Is and 2pdata set of tables A. 1-4; altogether 86 points. Iterating this procedure yields values for b0, ReB0, ImB 0 , c0, ReC0 and ImC0 from Z=N nuclei and values for b,, ImB,, Cj, ReC, and ImCj determined by all Is and 2p-data points. The parameters from this fit IV are also listed in table 7.1. Finally, leaving all 11 parameters free simultaneous in a fit to the Is and 2p-data points results in set V in table 7.1. Including the pionic 2p-data does not significantly change the s-wave parameters compared to the ls-data fits. This illustrates the weak correlation of the s-wave parameters with the p-wave parameters. More interesting features of fit V are given below in a comparison with the best fit.
7.2.2 Best fit to all pionic atom data A fit to the full pionic atom data base (140 data points) leaving the 11 s-wave and p-wave parameters free gave the final result, which is presented as the best overall fit in table 7.1. If we compare the quality of this fit with the performance of the next best set [Bat 78], we observe that a significant improvement has been obtained in matching the pionic strong interaction level shifts and widths with experiment. The improvement is clearly shown in the lowest lines of the tables in appendix A, where we compare for each atomic level Q2(e), for the shifts, and Q2(r), for the widths, with the corresponding g2-values according to the four parameter sets given in table 3.1. Of course, the pionic Is and 2p-level shifts and widths can be somewhat better described by the optical parameter set from fit V (parameters fitted to Is and 2p-data only), as is shown in the bottom part of table 7.1. The performance of set V, however, is much worse for the 3d-levels compared to that of the best fit. For the best fit case, only the s-wave parameter ImB, has changed significantly due to the inclusion of the 3d-levels in nuclei with large neutron densities (8p(r)#0). All the other s-wave
77
parameters still have values similar to those deduced from the pionic ls-level shifts and widths. Considering the p-wave parameters, these are all fitted with errors that are a factor of two smaller. The value of ReC0 is not significantly different from zero, which is affirmed by a fit of the same quality with this parameter set to zero.This indicates that the anomalous 3d-level shifts are better described by adding the p-wave TtNN-isovector parameter ReCj. Since the p-wave parameter ImC] has not significantly changed compared to the ls-2p-value, the conclusion arises that the deviating 3d-level widths are better matched with the experimental data due to a s-wave TtNNisovector parameter ImB, in the optical potential. The large negative value for this parameter indicates an extra repulsion. Fig.7.2 and fig.7.3 show the pionic 3d-level shifts and widths, respectively, according to the calculations of the best fit parameter set [Kon 89] and the sets [Bat 78] and [Sek 83] compared to the experimental values.
7.2.3 Fits using scattering lengths and volumes Alons [Alo 89] obtained, from a phase shift analysis of low energy pion scattering data, pionnucleon isoscalar and isovector scattering lengths b 0 = -0.0198 and b[ = -0.0825 and scattering volumes c0 = 0.2087 and c, = 0.1716. In comparing these values with those from Row et al. [Row 78] (table 3.1), which are also pion-nucleon parameters, to the values from the present best fit, one finds that only the isovector scattering volume Cj differs considerably. As mentioned in chapter 3 the p-wave parameters appear between gradient operators in the optical potential, causing the p-wave interaction to be confined to the surface of the nucleus. One would therefore expect the p-wave parameters for nuclei to be closest to the nucleon values. The s-wave parameters, on the contrary, apply to the entire nuclear volume and would be most sensitive to medium effects. This would then lead to the expectation that b0 and bj might be different for the pionic data compared to the scattering data. Clearly it is a p-wave parameter Cj that is changing most. By keeping the four parameters from Alons as constants in a fit to the present full pionic data set a somewhat deteriorated fit results; see table 7.1. Since a large correlation (-99%) exists between the individual members of the parameter pairs (b0,ReB0), (bj.ReBj), (c 0 ,ReC 0 ), (c^ReC]), the variable parameters from those pairs change to a large extent.
Table 7.1 Different optical potential parameter fits to the experimental strong interaction pionic level shifts and widths assembled in appendix A. mi bo b, RcB 0 Im B0 ReB, ImB, Co C]
Re C0 ImC 0 ReC, ImC,
run
Hi III
fit IV
fitV
-0.011 ±0.003 -0.072 ±0.006 -0.078 ±0.015 0.0462±0.0010 0 -0.08 ±0.02
-0.006 ±0.005 -0.077 ±0.006 -0.11 ±0.03 0.0539±0.0015
-0.003 ±0.005 -0.076 ±0.006 -0.13 ±0.03 0.0546±0.0015
-0.006 ±0.005 -0.076 ±0.007 -0.11 ±0.02 0.0543±0.0017
0 -0.11 ±0.03
0 -0.11 ±0.03
0 -0.13 ±0.03
0.003 ±0.005 -0.077 ±0.007 -0.16 ±0.03 0.0560±0.0017 0 -0.12 ±0.03
0 0 0 0 0 0
0.266 0.40 -0.07 0.105 -1.4 0.34
0.266 0.40 -0.07 0.105 -1.4 0.34
0.34 0.34 -0.33 0.109 -1.3 0.22
0.32 0.27 -0.26 0.109 -0.8 0.20
0?ol
Q2(ls) Q2(2p) Q2(3d) Q2(4f)
74
54
53
±0.04 ±0.14 ±0.15 ±0.007 ±0.8 ±0.12
467 55 99 285 27
±0.04 ±0.14 ±0.14 ±0.007 ±0.8 ±0.13
477 54 95 296 34
Best fit 0.007 ±0.004
phase shifts -0.0198
-0.075 ±0.005 -0.0825 -0.18 ±0.02 0.0426±0.0018 0.0587±0.0014 0.0521±0.0010 0 -0.18 ±0.03 -0.24 ±0.02 -0.205 ±0.019 0.266 0.40 -0.07 0.105 -1.4 0.34
±0.019 ±0.07 ±0.07 ±0.004 ±0.3 ±0.06
338 74 106 124 34
0.2087 0.1716 0.169 ±0.008 0.091 ±0.004 -0.12 ±0.09 0.29 ±0.06 555 135 246 131 43
m"il ~ -i m„ m„ m-4
m'n ml m -3
.3
m„ ml ml ml ml
79 7.2.4. Fits using the constraint ReB 0 =-ImB 0 Strieker et al. fitted both low energy pion-nucleus scattering [Str 79] and pionic atom data [Str 80]. They imposed the condition ReB0=-ImB0 as a restriction in their fits to the data used by Krell and Ericsson in 1969 [Kre 69]. We also made a fit including such a condition as a constraint. Such a fit, with the corresponding Q2-values of 96, 110, 138 and 34 for the Is, 2p, 3d and 4f levels respectively, is only 11 % worse than the best fit to our data set. However, their parameter values do not agree at all with what we find. In fact their fit to the low energy data on elastic scattering of 7t+ and Jt" on 4He and 12C are not very satisfactory. Dover [Dov 73] obtained from a T-matrix analysis ReB0 = ImB0 whereas Nishimoto et al. [Nis 71] calculated for the 7t-deuteron interaction ReB0 = 2ImB0.
7.3 Conclusions The experimental results on strong interaction effects in pionic atoms have in recent years become significantly more accurate and the presently available data throughout the periodic table enable a rather detailed study of the optical potential. The phenomenological 7c"-nucleus optical potential apparently can quite successfully reproduce the experimental results for these strong interaction level shifts and widths. The present best-fit parameters (table 7.1) yield a much improved description for notably the 2p-level widths (see table A.3), the (?2-value goes down by almost a factor of five compared to the best previous calculation [Bat 78], and for both the shifts and the widths of the 3d-levels. Even some of the deeply bound 3d-levels have their widths reasonably well reproduced. Notorious exceptions are 181Ta, nalRe and 197Au for which the optical potential yields values that are some 30% high. From the above presented results we might conclude that the p-wave 7tNN-isovector parameter ReB, as well as the s-wave rcNN-isoscalar parameter ReC0 may have very small values. The constraint ReB0 = -ImB0as proposed by Ericson and Ericson [Eri 66] is not confirmed from the present fits to all pionic data.
80
Fig.7.2 The strong interaction shifts of the pionic 3d-level as a function of the atomic mass A. The error bars represent the experimental values as listed in table A.5. The three curves represent the values reproduced by different sets of optical potential parameters; 1-1 Kon 89], II(Bat 78J, III-[Sek 83], which values are also listed in table A.5.
81
Fig.7.3 The strong interaction widths of the pionic id-level as a function of the atomic mass A. The error bars represent the experimental values as listed in table A.6. The three curves represent the values reproduced by different sets of optical potential parameters; I-fKon 89], II[Bat 78], Hl-ISek 83], which values are also listed in table A.6.
83
Chapter 8 Summary and conclusions
A negatively charged pion (7t"), when slowed down in matter, is usually captured in a high lying atomic orbit, far away from the nucleus. Such a particle can occupy atomic orbits, which for the same principal and angular momentum quantum numbers, have radii that are approximately 270 times smaller than those for the atomic electron. As the pion is a hadron, the orbits are governed by the electroweak and strong interactions. The influence of the strong interaction becomes more important as the pion cascades down into deeper lying orbits, where the pion wave function has a considerable overlap with the nuclear density. As a consequence of the strong interaction the pionic levels are broadened and their energies are shifted with respect to the values calculated from the electromagnetic interaction alone. This influence increases very rapidly with decreasing distance between the pion and the nucleus. The strong absorption experienced by the pion in inner orbits causes a considerable energy broadening of the level. This effect increases so drastically as the particle cascades down through its atomic orbits that the strong interaction width could only be directly measured for just one state for each case. In order to explore X-rays populating such deeply bound pionic levels in the present experiments, modern spectroscopic tools were applied to detect the pionic 2p-»ls X-ray transitions in 24Mg, 27A1 and 28Si and the 3d-»2p transition in 93Nb and nalRu. The coincidence techniques in combination with high-resolution Ge-BGO Compton suppression spectrometers, as described in chapter 4, allowed for the first time to observe the pionic 2p-»ls X-ray transitions in 24 Mg, 27A1 and 28Si. Furthermore, we could demonstrate for the first time by experiments on the pionic 3d—>2p transitions in 93Nb and natRu that the strong interaction in the pionic 2p-shell becomes repulsive for Z=36. Maybe it is possible to extend these data in the future to pionic Is and 2p-orbits for slightly higher Z by measuring pionic X-rays in coincidence with nuclear y-rays (Nal, BGO or Ge-detectors) and charged particles (wire chambers) and as well as by discriminating against neutrons by time-of-flight detection. The experimental data on pionic atoms as collected and presented in appendix A can, therefore, be considered as a rather 'complete' set. An extension of the experimental data on strong interaction pionic ls-levels with rather precise experimental values for shifts and widths is very difficult to obtain within a reasonable measuring period. This is clear from the presentation of the measurements on 27A1 and 28Si in chapters 4 and 6. Similar arguments hold for a possible extension of the pionic 2p-level data as can be inferred from the experimental data on the deepest
84 2p-level measured at present for natRu. In the case of pionic 3d and 4f-levels, the end of the periodic system for stable isotopes has been reached. For these levels only an extension for lower Z is possible as was presently done for93Nb, "^Ru, "t^Ag and na.gCd. Since for these elements no deviations between experiment and optical potential calculations have been observed, further measurements on weaker-bound pionic 3d-levels seem of minor interest. Recent suggestions to create a negatively charged pion in a deeply bound pionic orbit may in the future offer a possibility to further explore the Jt"-nucleus interaction in even more exotic pionic orbits [Kil 87]. The optical potential parameter set, presented in chapter 7, results from a fit to the most complete pionic data set available at present. The main improvement achieved in comparison with other standard optical potentials is the more successful reproduction of pionic 3d-level shifts and widths in heavy elements. So far, optical potential parameter sets could not simultaneously reproduce the 3d-level shifts and widths in elements like 181Ta, nalRu, nalPt, 197Au, 208Pb and 209 Bi. The present finding is that by including the JtNN-isovector terms with suitable strenghts in the standard optical potential, both the 3d-level shifts and widths are much better reproduced. A large negative 7tNN-isovector term ImBj gave a satisfactory improvement of the calculated pionic 3d-level widths in these heavy elements. The negative value for ImE^ implies an increased s-wave repulsion experienced by pions absorbed from these deeply bound 3d-levels. This result is more satisfactory than the ad hoc introduction of an extra hard core repulsion in the optical potential as proposed by Olivier et al. [Oli 84]. The pionic 3d-level shifts in the lighter elements are quite well reproduced by the extended optical potential. The calculations according to the optical potential parameter sets as presented in chapter 3 were found to agree with the presented pionic strong interaction ls-level shifts and widths in 24Mg, 27 A1 and 28Si as well as with the 2p-level shifts and widths in 93Nb and natRu. As is shown in fig.8.1 the presently investigated pionic Is and 2p-orbits are about as deeply bound as the 3dlevels observed in the above mentioned heavy nuclei. These observations, along with the fact that the best fit to pionic Is and 2p-data only (fit V, table 7.1) is not able to reproduce the 3d-data for deeply bound states, show that the extra repulsion needed to describe the 3d-data is not structural for deeply bound pionic orbits but is confined to these 3d-levels only. This is consistent with the fact that for a suitable choice of the 7tNN-isovector term also the 3d-data can be fairly well reproduced, since only heavy nuclei have a large neutron excess. In addition, it is shown for the first time that the pion experiences a repulsive strong interaction in the 2p-orbits in 93Nb and nalRu as the result of a cancellation between the s and p-wave interaction. This effect was already predicted by Krell and Ericson in 1969 [Kre 69].
85
50
100
150
200 A
»
Fig.8.1 Calculated overlap between the wave function of a pion in a specific atomic orbit and the nuclear density (pp + p„), using the optical potential parameter set [Bat 78] of table 3.1 .The curves are smoothed, obscuring irregularities in the calculated overlap. The pion-nucleon isoscalar and isovector scattering lengths b 0 and bl and the scattering volumes c0 and Cj as deduced from optical potential fits to pionic atom data have in the past been compared by many authors with the corresponding values obtained from elastic pion-nucleon scattering as well as from elastic pion-nucleus scattering. In low energy elastic scattering these parameters are treated as complex quantities to account for quasi-elastic scattering. In pionic atoms the Jt" is in a bound state and is assumed to be absorbed with zero total energy. The single nucleon isoscalar and isovector scattering lengths and volumes are, therefore, purely real numbers in the pionic atom optical potential. Several studies have been performed in comparing the pionic atom parameters with low energy scattering data. In most studies, [Str 79, Str 80, Sek 83, Mas 88], pionic atom parameters were extrapolated to those for elastic scattering at energies in the range 2050 MeV. Masutani and Seki [Mas 88] for instance could nicely reproduce the cross section measured for low energy elastic scattering of it* on 12C and 1 6 0 at 20 and 30 MeV performed by Wright et al. [Wri 87]. When 'anomalous' pionic atom data (3d-level), such as for 7t'-208Pb, were included, an impressive improvement with the Jt'-scattering data on 40Ca and 58Ni (20, 30 MeV) could be achieved. This illustrates that also elastic scattering data on Ca and Ni require a
86
repulsion in the local interaction. Since these sets of pionic atom parameters differ from the one presented as the best fit in table 7.1, it would be of interest to repeat these elastic scattering calculations starting from the present best fit values.
87
References Ach 84 Aga 73 Alo 89
Bla 67 Bio 72 Bor 75 Bor 76 Bri 87 Cha 79 Cha 85 Del 76 Dey 75 Dor 85 Dov 73
- J.F.M.d'Achard van Enschut et al.; Phys. Lett. 136B (1984) 24 - D.Agassi and A.Gal; Ann. of Phys. 75 (1973) 56 - private communication; R.A.Arndt, program SAID, Virginia Polytechnic Institute and State University, Solution FP85, Fall 1985 - I.Angeli et al.; Journ. of Phys. G6 (1980) 303 - G.Backenstoss; Ann. Rev. Nucl. Sci. 20 (1970) 467 - R.C.Barrett et al.; Phys. Lett. 47B (1973) 297 - C.J.Batty et al.; Phys. Rev. Lett. 40(1978)931 - M.A.B.Beg; Ann. of Phys. 13(1961) 110 - W.Bertl et al.; Nucl. Phys. B260 (1985) 1 - P.R.Bevington; Data reduction and error analysis for the physical sciences (McGraw-Hill, New York, 1969) - J.M.Blatt; Journ. of Comp. Phys. 1 (1967) 382 - J.Blomqvist; Nucl. Phys. B48 (1972) 95 - M.Born & E.Wolf; Principles of Optics (Pergamon Press 5th edition, 1975) - E.Borie; Nucl. Phys. A267 (1976) 485 - D.I.Britton et al.; Nucl. Phys. A461 (1987) 571 - J.Chai and D.O.Riska; Nucl. Phys. A329 (1979) 429 - G. de Chambrier et al.; Nucl. Phys. A442 (1985) 637 - J.Delorme and M.Ericson; Phys. Lett. 60B (1976) 451 - W.Dey et al.; Nucl. Phys. A326 (1979) 418 - M.Dorr et al.; Nucl. Phys. A445 (1985) 557 - C.B.Dover; Ann. Phys. 79 (1973) 441
Eri 66 Eri 72 Fra53 Fri 69 Fri 73 Gau 69 Gio 87 Hof 80 Hiif 73 Hiif 75 lac 71 Isa 82
-
Ang80 Bac 70 Bar 73 Bat 78 Beg 61 Ber 85 Bev 69
M.Ericson and T.E.O.Ericson; Annals of Physics 36 (1966) 323 T.E.O.Ericson and J.Hufner; Nucl. Phys. B47 (1972) 205 N.C.Francis and K.M.Watson; Phys. Rev. 92 (1953) 29 B.Fricke; Zeit. fur Phys. 218 (1969) 495 B.Fricke; Phys. Rev. Lett. 30 (1973) 119 W.Gautschi; S.I.A.M. Jour, of Numer. Anal. 12 (1969) 465 K.L.Giovanetti et al.; Phys. Lett. 186B (1987) 9 G.W.Hoffman et al.; Phys. Rev. C21 (1980) 1488 J.Hufner; Nucl. Phys. B58 (1973) 55 J.Hufner and F.Iachello; Nucl. Phys. A247 (1975) 441 F.Iachello and A.Lande; Phys. Lett. 35B (1971) 205 H.P.Isaak et al.; Hel. Phys. Acta 55 (1982) 477
88 Isa 83 Kam 81 Kil 87
Sek 83 Shi 86 Ste74
- H.P.Isaak et al.; Nucl. Phys. A392 (1983) 385 - J.de Kam; Nucl. Phys. A360 (1981) 297 - K.Kilian; Proc. of the Intern. Sym. on Dynamics Of Collective Phenomena In Nuclear And Subnuclear Long Range Interactions In Nuclei, Bad Honnef, Germany, May 4-7 1987 - K.E.Kir'yanov et al; Sov. Journ. Nucl. Phys. 26 (1977) 685 - L.S.Kisslinger; Phys. Rev. 98 (1955) 761 - S.Klarsfeld and A.Maquet; Phys. Lett. 43B (1973) 201 - J.H.Koch and M.M.Sternheim; Los Alamos Scientific Lab., report LA-5110 (1973) - J.Koch and F.Scheck; Nucl. Phys. A340 (1980) 221 - D.S.Koltun; Advances In Nuclear Physics, Volume 3 (Plenum Press, 1969) - J.Konijn, J.Koch, C.T.A.M. de Laat and A.Taal; to be published - M.Krell and T.E.O.Ericson; Nucl. Phys. B l l (1969) 521 - C.T.A.M. de Laat and J.G.Kromme; Nucl. Inst. and Meth. A239 (1985) 556 - C.T.A.M. de Laat et al.; Phys. Lett. 189B (1987) 7 - C.T.A.M. de Laat; Strong and electromagnetic interactions in heavy exotic atoms (thesis, Delft University) - C.M.Lederer and V.S.Shirley; Table of Isotopes (J.Wiley & S.7th edition, 1978) - D.M.Lee et al.; Nucl. Phys. A182 (1972) 20 - K.Masutani and R.Seki; Phys. Rev. C38 (1988) 867 - K.Nishimoto, H.Ohtsubo and H.Narumi; Progr. Theor. Phys. 46 (1971) 135 - M.E.Nordberg, K.F.Kinsey and R.L.Burman; Phys. Rev. 165 (1968) 1096 - J.G.J.Olivier, M.Thies and J.Koch; Nucl. Phys. A429 (1984) 477 - S.Ozaki et al.; Phys. Rev. Lett. 4(1960)533 - H.P.Povel; Nucl. Phys. A217 (1973) 573 - G.A.Rinker and L.Wilets; Phys. Rev. A12 (1975) 748 - G.Rowe, M.Salamon and R.H.Landau; Phys. Rev. C18 (1978) 584 - F.Scheck; Nucl. Phys. B42 (1972) 573 - F.Scheck; Leptons,Hadrons and Nuclei (North Holland Physics Publishing, 1983) - R.Seki and K.Masutani; Phys. Rev. C27 (1983) 2799 - A.Shinohara et al.; Nucl. Phys. A456 (1986) 701 - M.M.Sternheim and R.R.Silbar; Ann. Rev. Nucl. Science (1974) 249
Str79 Str 80 Taa85 Tau 71
-
Kir 78 Kis 55 Kla 73 Koc 73 Koc 80 Kol 69 Kon 89 Kre 69 Laa 85 Laa 87 Laa 88 Led 78 Lee 72 Mas 88 Nis 71 Nor 68 Oli 84 Oza60 Pov 73 Rin 75 Row 78 Sch 72 Sch 83
K.Stricker, H.McManus and J.A.Carr; Phys. Rev. C19 (1979) 929 K.Stricker, H.McManus and J.A.Carr; Phys. Rev. C22 (1980) 2043 A.Taal et al.; Phys. Lett. 156B (1985) 296 LTauscher; Proc. Int. Sem. "jt-Meson Nucleus Interaction"; Strasbourg 1971,
89
Tau 78 Vog73 Vog 74 Vri 87 Wat 53 Wat 57
-
Win 63 Wri 87
-
CNRS-Strasbourg p.45 L.Tauscher et al.; Zeit. fur Phys. A285 (1978) 139 P.Vogel; Phys. Rev. A7 (1973) 63 P.Vogel; Atom. Nucl. Data tables 14 (1974) 599 H. de Vries et al.; Atomic Data and Nuclear Data Tables 36 (1987) 495 K.M.Watson; Phys. Rev. 89 (1953) 575 K.M.Watson; Phys. Rev. 105 (1957) 1388 and Rev. Mod. Phys. 30 (1958) 565 R.Winston; Phys. Rev. 129 (1963) 2766 D.H.Wright et al.; Phys. Rev. C35 (1987) 2258 D.H.Wright et al.; Phys. Rev. C36 (1987) 2139 D.H.Wright et al.; Phys. Rev. C37 (1987) 1155
91 Appendix A Calculated pionic atom shifts and widths, using five different optical potential parameter sets, are compared to the experimental values. The four sets [Tau 71] (£=0 and ^=1), [Bat 78] (£=1) and [Sek 83] (£=1) are listed in table 3.1. The fifth set [Kon 89] is the new set of optical potential parameters presented in table 7.1. For every set the sum of the weighted squared deviations between experiment and theory is given. All experimental shifts listed in table A.l-8 are given with respect to the point nuclear Coulomb value, i.e. the shifts are not corrected for the finite size effect. For all experimental values listed, the references are given below the tables. In the case of more than one reference for a single value, the average value given in the corresponding references is taken. The errors for the shifts are taken to be 5% of the corresponding width, for reasons explained in chapter 3. These adjusted errors in the shifts are never smaller than the errors in the references. In the last table of this appendix, table A.9, a list of the nuclear parameters is given for all the nuclei used for the optical potential parameter fitting.
92 Table A.l Experimental values ofpionic ls-level shifts versus the calculations according to the parameter sets of table 3.1 and table 7.1. All values are in keV. e(ls) experiment ref [Tau71] [Tau71] [Bat 78]
[Sek 83]
[Kon 89]
4=0
4=1
4=1
4=1
5=1
ioB
-3.25±0.08
1
-3.52
-3.49
-3.20
-3.04
»B
-4.17±0.09
2
-4.23
-4.22
-4.31
-4.33
-4.16
12
-6.79+0.15
3]
-6.78
-6.74
-6.36
-6.37
-6.78
C
13
4
)
C 14 N
-11.7 +0.2
5
-11.9
160
-18.7 ±0.4
6
18 Q
-23.3 ±0.3
1 6
19p
-31.6 ±0.5
-7.76±0.13
-7.89
-7.87
-8.03
-8.19
-3.17
-8.11
-11.9
-11.3
-U.4
-19.3
-19.2
-18.2
-18.2
-19.3
-24.4
-24.3
-25.3
-25.4
-23.2
7)
-33.2
-33.0
-32.9
-32.5
-31.3
8
-42.9
-42.6
-40.3
-39.7
-41.4
-50.4
-50.2
-51.6
-52.0
-49.2
-64.4
-64.0
-64.0
-64.6
-63.6
-12.1
20
Ne
-41.4 +0.8
22
Ne
-49.7 ±0.5
23
Na
-63.9 ±0.9
24
Mg
-82.7 ±1.2
11-,
-79.6
-79.2
-76.1
-76.6
-80.1
27
A1
-115.5 ±1.4
IK
-111.3
-110.8
-111.3
-113.8
-113.8
28
Si
-132
IK
-133
-132
-128
-130
-137
59
53
Q2(£ls)
±2
1 9% 10
)
122
131
') A.Olin el al.; Nucl. Phys. A360 (1981) 426 L.Tauscher and S.Wycech; Phys. Lett. 62B (1976) 413 R J.Harris et al.; Phys. Rev. Lett. 20 (1968) 505 GMackenstoss et al.; Phys. Lett. 25B (1967) 365 DAJenkins el al.; Phys. Rev. Lett. 17 (1966) 1 and Phys. Rev. Lett. 17 (1966) 1148 2 ) A.Olin et al.; Nucl. Phys. A360 (1981) 426 L.Tauscher and S.Wycech; Phys. Lett. 62B (1976) 413 RJ.Harris et al.; Phys. Rev. Lett. 20 (1968) 505 DAJenkins et al.; Phys. Rev. Lett. 17 (1966) 1 and Phys. Rev. Lett. 17 (1966) 1148 3 ) C.Fry et al.; Nucl. Phys. A37S (1982) 325 L.Tauscher and S.Wycech; Phys. Lett. 62B (1976) 413 G.Backenstoss et al.; Phys. Lett. 25B (1967) 365
26
93 Table A.2 Experimental values ofpionic ls-level widths versus the calculations according to the parameter sets of table 3.1 and table 7.1. All values are in keV. T(ls) experiment ref [Tau71] [Tau71] [Bat 78]
5=0 ioB "B 12
c c
13
5=1
5=1
[Sek 83]
[Kon 89]
5=1
5=1
1.5810.16
1
1.27
1.25
1.40
1.33 .
1.7710.16
2)
1.4,1
1.34
1.44
1.49
1.19
2.9910.14
3N
2.73
2.67
2.96
2.91
3.20
1.61
2.5910.14
4
2.88
2.70
2.95
3.18
2.51
14 N
4.3 ±0.2
5
4.6
4.5
5.0
4.8
5.3
16 Q
7.9 ±0.3
6N
6.8
6.7
7.4
6.9
7.8
18 Q
6.3 ±0.4
6s
5.7
5.6
5.7
5.1
5.0
19 F
10.1 ±0.7
7-,
8.5
8.4
9.1
8.3
9.5
20
Ne
15.4 10.4
8
12.6
12.4
13.9
12.8
14.9
22
Nc
10.8 ±0.7
9
10.3
23
Na
24
Mg
11.7
11.6
11.5
10.3
10
17
17
17
15
17
24.3 ±1.0
11
23.1
22.8
24.8
22.1
25.2
11
28.9
28.6
29.3
25.0
27.8
11>
37
37
39
35
38
83
94
41
108
47
17
±2
27
A1
28.8 ±1.2
28
Si
41
Q2ls rontgenovergangen gemeten in 24 Mg, 27A1 en 28 Si, alsmede de pionische 3d—>2p rontgenovergangen in Nb en nalRu. De coincidentie-technieken gebruikt voor de
104
metingen aan de kernen 24Mg, 27A1 en 28Si (hoofdstuk 4) maakten het voor het eerst mogelijk deze pionische 2p—»ls rontgenovergangen waar te nemen en te analyseren. Bovendien is het voor het eerst aangetoond dat de attractieve sterke wisselwerking in de 2p-schil repulsief wordt bij Z=36 door de experimenten aan de pionische 3d-»2p rontgenovergangen in 93 Nb en nat Ru. Misschien is het mogelijk om in de toekomst deze verzamelde gegevens verder uit tebreiden naar nog dieper gebonden toestanden door een coi'ncidentiemeting van pionische rontgenovergangen met gebruikmaking van alle bovengenoemde technieken. Door deze dan ook nog te combineren met vluchttijdmetingen in de kerngamma-detectiesystemen (Nal, BGO of Ge) is bovendien discriminatie tegen de gei'nduceerde neutronachtergrond mogelijk. Kort geleden zijn experimenten voorgesteld om de 7i"-kemwisselwerking te onderzoeken door een negatief geladen pion te creeren in een diepgebonden atomaire baan met behulp van een kernreactie [Kil 87]. In de toekomst zal het daarom wellicht mogelijk zijn nog dieper gebonden pionische atoombanen te bestuderen. De experimentele gegevens verzameld in appendix A kunnen naar aanleiding van het bovenstaande, tenminste voorlopig, als compleet worden beschouwd. Een uitbreiding van het aantal meetgegevens over de sterke wisselwerking van voldoende nauwkeurigheid is zeer moeilijk haalbaar binnen een redelijke meetperiode. Dit wordt ondermeer duidelijk uit de preseritatie van de metingen aan Al en Si in de hoofdstukken 4 en 6. Gelijkluidende argumenten kunnen worden aangevoerd voor uitbreiding van de verzameling pionische 2p-gegevens. Voor de pionische 3d- en 4f-toestanden is het eind van het periodieke systeem voor stabiele isotopen bereikt. Voor deze banen kan slechts een uitbreiding naar lagere Z worden bewerkstelligd. Daar echter voorheen geen afwijking tussen het experiment en de berekening met de optische potentiaal werden waargenomen, lijken metingen aan zulke zwakker-gebonden 3d-toestanden van minder belang te zijn. De optische potentiaal in de gemodificeerde Klein-Gordon-vergelijking die de sterke wisselwerking tussen het gebonden pion en de kern beschrijft (hoofdstuk 2) is uitgebreid met jtNN-isovectortermen (zie hoofstukken 2 en 7). De waarden voor de parameters van deze uitgebreide optische potentiaal werden verkregen uit een aanpassing aan de 140 meetresultaten getabelleerd in appendix A. In vergelijking met eerdere semi-empirische aanpassingen van deze parameters blijkt de nieuwe aanpassing een aanmerkelijke verbetering te geven. Een opmerkelijk feit is dat tot dusver geen enkel stel parameters gelijktijdig de energieverschuivingen alsmede de niveauverbredingen van 3d-niveau's in zware kemen kon reproduceren. De analyse in hoofdstuk 7, waarbij de optische potentiaal is uitgebreid met JtNN-isovectortermen, resulteert in een parameterset die wel gelijktijdig de energieverschuivingen alsmede de niveauverbredingen van deze 3d-niveau's goed berekent. De grote negatieve waarde voor de rtNN-isovector term ImB, geeft ook een bevredigende verklaring voor deze aanmerkelijke verbetering in aanpassing. De negatieve waarde voor ImB( impliceert een vergrote s-golfafstoting die door de pionen wordt ondervonden in hun wisselwerking met de kern. Dit resultaat geeft een meer bevredigende
105 verklaring dan die geopperd door Olivier en medewerkers [Oli 84], namelijk een ad hoc gei'ntroduceerde 'extra harde kern afstoting'. De optische-potentiaalberekeningen met de parametersets gepresenteerd in hoofdstuk 3 bleken in goede overeenstemming te zijn met de experimenteel gevonden energieverschuivingen en niveauverbredingen van de pionische ls-baan in 24 Mg, 27A1 en 28 Si alsmede met de energieverschuivingen en niveauverbredingen van de pionische 2p-baan in 93 Nb en naIRu. Zoals gegeven in hoofdstuk 8 zijn de nu onderzochte Is- en 2p-banen ongeveer even diepgebonden als de 3d-banen in zware kernen. Dit toont aan, tesamen met het feit dat de beste aanpassing aan enkel Is- en 2p-data (zie hoofdstuk 7) niet instaat is deze diepgebonden 3d-banen goed te beschrijven, dat de extra afstoting noodzakelijk om deze meetgegevens te kunnen reproduceren geen structureel verschijnsel van diepgebonden toestanden is. Deze conclusie is consistent met de gevonden waarden voor de 7tNN-isovectorterm in de potentiaal, welke waarden hoofdzakelijk bepaald worden door zware kernen met een groot neutronenoverschot en een grote overlap van de piongolffuncties met de kern. Bovendien werd voor het eerst aangetoond dat het pion een afstotende sterke wisselwerking ondervindt in de pionische 2p-banen van Nb en nalRu. De reden hiervoor is dat de s-golf termen in de optische potentiaal de invloed van de p-golf gaan overtreffen, hetgeen reeds werd voorspeld door Krell en Ericson in 1969 [Kre 69]. De isoscalaire en isovector verstrooiingslengten b0 en bj en verstrooiingsvolumina c 0 en c, voor het pion-nucleon systeem (ontleend uit aanpassingen van de optische potentiaal parameters aan meetgegevens verkregen uit pionische atoomexperimenten) zijn in het verleden door vele auteurs vergeleken met de overeenkomstige waarden verkregen uit elastische pion-nucleon verstrooiingsexperimenten alsmede van elastische pion-kern verstrooiing. In elastische verstrooiingsexperimenten bij lage energie worden deze parameters als complexe grootheden behandeld teneinde rekening te kunnen houden met quasi-elastische verstrooiing. In een pionisch atoom verkeert het pion in een gebonden toestand en wordt verondersteld te worden geabsorbeerd met een totale energie die ongeveer nul is. De isoscalaire en isovector verstrooiingslengten en volumina zijn daarom zuiver reele getallen in de optische potentiaal voor het pionische atoom. Vele auteurs vergelijken resultaten van elastische verstrooiingsexperimenten in het energiegebied 20-50 MeV [Str 79, Str 80, Sek 83, Mas 88] met waarden voor pionische atoomparameters die geextrapoleerd zijn naar dit energiegebied. Masutani en Seki,[Mas 88] lieten zien dat de berekende en experimentele waarden voor de werkzamedoorsneden van elastische verstrooiingsexperimenten bij lage energie [Wri 87] van JT* aan C en 16 0 bij 20 en 30 MeV in goede overeenstemming met elkaar zijn. Een zeer verbeterde overeenstemming tussen berekende en experimentele waarden voor de werkzame doorsnede van Jt'-verstrooiing aan 40Ca en 58Ni bij 20 en 30 MeV kon worden verkregen, indien de anomale meetresultaten voor de pionische 3d-baan in 208Pb [Laa 88] in rekening werden gebracht. Dit toont aan dat ook voor de Iaagenergetische
106
verstrooiingsexperimenten aan '"'Ca en 58Ni een sterkere afstodng wordt vereist in het lokale deel van de optische potentiaal.
107
Curriculum vitae
De schrijver van dit proefschrift werd geboren op 20 augustus 1954 te Scheveningen. Het genoten middelbaar onderwijs bestond uit een MAVO-4 opleiding gevolgd door een hbo-opleiding elektrotechniek aan de Gem. H.T.S. te Den Haag. In 1976 werd een aanvang gemaakt met de studie technische natuurkunde aan de Technische Universiteit te Delft. Na een onderbreking voor het vervullen van de militaire dienstplicht werd de studie in 1984 afgerond bij de toenmalige vakgroep Experimentele Kernfysica. Op 1 maart 1984 trad de schrijver dezes in dienst als promovendus van de Stichting voor Fundamenteel Onderzoek der Materie bij de PIMU (pion/muon) groep aan het Nationaal Instituut voor Kernfysica en Hoge-energiefysica (NIKHEF) te Amsterdam. Het experimentele werk beschreven in dit proefschrift werd uitgevoerd aan het Paul Scherrer Institute te Villigen, Zwitserland.
Stellingen
bij het proefschrift
Deeply bound orbits in pionic atoms and the optical potential
door
A.Taal Delft, 21 maart 1989
1.
Bij experimenten waarin wordt gezocht naar afwijkingen van de 1/r evenredigheid (Newton's gravitatiewet) is het onjuist de inhomogeniteit van bodemformaties afgeleid uit geofysische gegevens te vertrouwen, daar deze berust op de veronderstelling dat er geen afwijking van de gravitatiewet is. F.D.Stacey and G.J.Tuck; Nature Vol. 292 (1981)
6.
M.E.Ander et al.; to be published in Phys. Rev. Lett. 2.
De weerlegging door Tacik et al. van de door Altman et al. gevonden lage
Het steeds sneller afnemen van het aantal planlcn- en diersoorten (naar schatting zal dat een soon per uur in het jaar 2000 zijn ' h en het daarmee verdwijnen van waardevol genetisch materiaal zou de aanleiding moeten vormen voor een mondiaal onderzoekprogramma van ten minsie dezelfde omvang als de huidige ruimtevaartprojecten. ' Biologische Raad van de Koninklijke Academie van Wetenschappen
7.
Het argument voor het toevoegen van chemische cosmetica aan voedselprodukten, dat de consument vraagt naar steeds verdere verfraaiing, is een drogreden gezien de uitermate geringe keuzemogelijkheid van de klant voor produkten zonder kunstmatige toevoegingen.
8.
Gezien de gestage vervuiling van het milieu zal binnen afzienbarc tijd de bij milieu-ongelukken gelanceerde frase "Er bestaal geen gevaar voor de volksgczondheid" haar betekenis geheel verloren hebben.
opbrengst voor het quasi-deuteron proces in pionabsorptie is gebaseerd op een foul in eigen meting van de bijdrage van de drie-nucleonabsorptie. A.Altman et al.; Phys. Re,v. C34 (1986) 1756 R.Tacik et al.; Phys. Rev. C, to be published R.Hamers; thesis (Vrije Universiteit, 1989) 3.
Voor het bepalen van het verschil in bezettingsgraad van een eendceltjestoestand voor twee kernen, is het alleen bestuderen van elastische werkzame doorsneden gemeten in een elektronverstrooiingsexperiment geen geschikte methode. B.Frois ef al.; Nucl. Phys. A396 (1983) 409 J.Friedrich; Phys. Rev. C33 (1986) 2215 A.J.C.Burghardt; thesis (Universiteit van Amsterdam, 1989)
4.
Het verdient aanbeveling om voor Monte Carlo simulalies meer gebruik te maken van de capaciteit die besloten ligt in meetsystemen met gedistribueerde verwerkingsmogelijkheden.
5.
Het beschikbaar komen van steeds duurderc, geavanceerdere, medisch diagnostische apparatuur ontneemt steeds meer patienten de kans op de bcste behandeling daar maar weinig ziekenhuizen definanci'elemiddelen tot aanschaf bezilten.


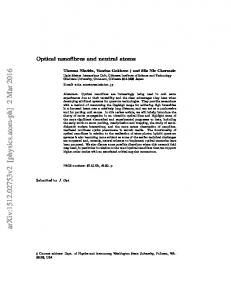

![[PDF] Atoms, Molecules and Optical Physics 1: Atoms ... - Google Sites](https://m.moam.info/img/260x300/pdf-atoms-molecules-and-optical-physics-1-atoms-go_64779269097c474d228c3091.jpg)