A Case Study from the Open Source âApacheâ MyFaces Project Family. Dindin Wahyudin ... Main results of data analysis are (a) a set of project metrics prior to ...
Defect Prediction using Combined Product and Project Metrics A Case Study from the Open Source “Apache” MyFaces Project Family Dindin Wahyudin, Alexander Schatten, Dietmar Winkler, A Min Tjoa, Stefan Biffl Institute for Software Technology and Interactive Systems Vienna University of Technology, Vienna, Austria
{Dindin, Schatten, Winkler, Tjoa, Biffl }@ifs.tuwien.ac.at
Abstract The quality evaluation of open source software (OSS) products, e.g., defect estimation and prediction approaches of individual releases, gains importance with increasing OSS adoption in industry applications. Most empirical studies on the accuracy of defect prediction and software maintenance focus on product metrics as predictors that are available only when the product is finished. Only few prediction models consider information on the development process (project metrics) that seems relevant to quality improvement of the software product. In this paper, we investigate defect prediction with data from a family of widely used OSS projects based both on product and project metrics as well as on combinations of these metrics. Main results of data analysis are (a) a set of project metrics prior to product release that had strong correlation to potential defect growth between releases and (b) a combination of product and project metrics enables a more accurate defect prediction than the application of one single type of measurement. Thus, the combined application of project and product metrics can (a) improve the accuracy of defect prediction, (b) enable a better guidance of the release process from project management point of view, and (c) help identifying areas for product and process improvement. Keywords: Open Source Software, Software Quality, Defect Prediction, Software metrics
1. Introduction The nature of open source software (OSS) development [4], such as highly distributed development by volunteer contributors; cultural and time zone differences of contributors; informal project management and modest consideration of quality assurance (QA) and documentation during development, makes product QA a major concern to potential users of new releases. Empirical studies [1, 17] suggest that some OSS
projects have created software products with quality levels similar to closed source commercial development [1]. Ben Collins and Brian Fitzpatrick, committers and co-founders of the OSS Subversion project1, suggested constant product improvements and releases as indicators for a “healthy” OSS project [19]. These product improvements are directed by a strong feedback from the user community (e.g., bug reports and feature requests)2 and active developers’ contributions [14]. In OSS projects, where formal QA practices such as inspection are less practicable, one feasible approach for assessing the quality of a software product is to predict the defect between releases. In a closed source software development, the prediction of defects between releases can provide benefits such as to guide testing of the next release [3], to improve maintenance resource allocation and adjust deployment [13], to guide development process improvement [5], and to enable the selection among different product releases [8]. For a release manager and project leading team in an OSS project, defect prediction between releases is important as decision support for release candidates such as: a) is the a release candidate good enough for deployment or whether there is another QA cycle necessary before delivery; b) input for planning the next release cycle based on the prediction results. However, Fenton [16] reported most prediction models to be based on product metrics (e.g., size and complexity metrics) obtained after product release, which seems rather late for guiding development [17, 18] and release process [13]. Another type of metrics, which is not as popular as product metrics, is project metrics. Project metrics are measures for development activities (e.g. developer source code contributions, 1
Google Speaker Series: Successful Open Source Projects can be found at http://www.youtube.com/watch?v=ZtYJoatnHb8. Last accessed 1st March 2008 2 E. Raymond. The cathedral and the bazaar. http://www.catb.org/esr/writings/cathedralbazaar/ cathedral-bazaar/, 2003. Last accessed 1st March 2008
developer email contributions) which can be monitored and obtained through all project life cycle [9]. Thus, in this paper we propose a) to derive from project leader and release manager goals a set of typical QA practices in “quality-aware” OSS projects and ways to measure the QA practices in form of project metrics; b) to investigate the potential contribution of these project metrics for defect prediction in OSS project context; c) to investigate whether a combination of project and product metrics can provide better defect prediction compared to a prediction model using only the traditional product metrics. For an empirical evaluation we collected data from 11 releases of 2 Apache MyFaces project family (Tobago and Core), and analyzed the potential contribution of combination of product and project metrics for defect prediction model in OSS project context. The remainder of this paper is structured as follows: Section 2 summarizes related work on software defect prediction and quality improvement in OSS projects. Section 3 describes the continuous software product improvement process in OSS projects and derives research issues. Section 4 outlines the case study design. Section 5 reports the data analysis results. Section 6 discusses the results with the research issues. Section 7 concludes and suggests future work.
2. Software Defect Prediction Most empirical studies use prediction models to estimate the number of defects, defect density, and potential defect growth [16] of software products. Schneidewind [17] suggested two approaches for defect prediction: (a) time-based approaches and (b) metric-based approaches. A time-based approach estimates the number of (remaining) defects from the number of defects found in a time interval after product release and fit the data to form a software reliability growth model (RGM) [9]. While a metrics-based approach uses metrics obtained from historical project data before product release (called as predictors) to fit a prediction model. The advantage of time-based approaches is more accurate prediction compare to metrics based approaches, since the estimate is derived from actual defect occurrences data; however the availability of data for estimation mostly come later after testing, thus the prediction is often too late to support in-time decision making [7] such as release process. In contrast metric-based approach promises better support for a release manager by providing defect forecast prior to release, often with less accuracy as the tradeoff [7]. Li et al [9] classified defect predictors as:
• Product metrics, which measure attributes of any intermediate or final software product, for example line of codes (LOC) or number of classes. Product metrics are the most commonly used predictors and supported by [2, 5, 13] as important predictors. • Project or development metrics measure attribute of development processes and activities such as LOC per developer within a release. Mockus et al [14] and Weyuker et al [20] suggested these metrics as important predictors. • Deployment and usage metrics measure attributes of the deployment context and usage patterns of software releases, e.g., time since first release, time to next release [7, 8]. • Configuration metrics measure attributes of software and hardware configuration that interact with the software product/release during operation e.g. Deployment operating system, type of software application [13]. Currently there are several metric based prediction models that commonly used by experts. Khosgoftaar et al. [11] suggested prediction models such as using component clustering fitted to linear regression, nonlinear regression to predict the changes of dependent variables value (e.g., number of defects) by parameterized amount of independent variables (e.g., size and complexity) [12]. Another approach is to use Neural Networks that presents predictors values as neural inputs, which can be used by a neural network to reach a conclusion based on experience cases stored in a database [10]. Surprisingly prior study by Li et al as reported in by [7] verified that simpler models such as linear regression showed comparable accuracy levels to more complex defect prediction models in context of open source project. In this paper, we focus on metric-based approaches with two steps predictors’ selection, which consist of a) correlation analysis of variables and b) stepwise linear regression procedures. This two-step predictor selection intends to eliminate insignificant predictors before we can fit the data to the prediction model. We expect this selection procedure to enable data analysis effort reduction by focusing on smaller set of strong metrics [8, 12].
3. Measuring QA Practices in OSS Projects A good OSS project offers continuous improvement of software product releases. Just to give some examples large OSS projects such as Gnome, Mozilla, Phyton, Subversion and Eclipse encourage quality improvement as part of OSS community awareness.
Figure 1. Continuous software product improvement within an OSS project. Their goals are to improve the quality of the releases by involving a larger part of the project community based on principles [18] such as involvement of a developer to review the validity of a defect candidate reported by a user before submitting the report into the issue tracker (see: Buddy System at Subversion project3). Our prior study [19] in four large Apache OSS projects concluded that these communities should coordinate and work together as a symbiosis mutualism to produce high-quality software. In [19] we found that large successful projects such as Apache Tomcat and HTTPD have faster developer response times to user community feedbacks (i.e. defect report or feature request), and higher numbers of peer-reviews of each code set or patches submitted into the project code versioning system. Figure 1 illustrates a complete life cycle of an OSS project with five typical QA practices represented as circles as partially depicted in studies such as [6, 18, 19]; some of these practices are fully or partially observable, and thus we can measure the development activities with these practices to derive relevant project metrics. Afterward we investigated the usefulness of these project metrics to defect prediction in our case study.
QA Activity 1: Design Review Issues reported to the tracker tool trigger most of the development activities within OSS projects. An issue can be a new requirement (feature request/new functionality, or enhancement/patch) or software defect reported by a user. Throughout the project lifetime, there are several quality assurance (QA) practices as part of product release continuous improvement.
3
http://subversion.tigris.org/project_issues.html
When a developer has an idea for new functionality or a patch, he may construct specification and design and then ask other developers within the community to review his specification and design before listing them as new issues (see circle 1 in Figure 1). The Python project4 community encourages developers to engage in a specific design process, called Python Enhancement Proposal (PEP), which is similar to a request for comments and design technical review meeting in commercial software projects [7]. This design review process uses common information spaces of the project such as emails, forum, and project documentation and involves different stakeholders across all project communities. During design review, we can observe the developer activities in negotiation, collaboration, and refinement of proposed design. If the design proposal gets accepted, then the developer lists appropriate action items in the issue tracker. However, it is also common that a developer directly jumps into implementation (with his own ideas), then submits the code set, and later opens a discussion in developer communication channels and asks for technical review of his code.
QA Activity 2: Code Testing It is worth noting that a developer in an OSS project always conducts code testing before submitting the code set into the CVS (see circle 2 in Figure 1). If the tests fail, then the developer either continues to work until the issue is resolved or returns the issue into the tracker as “open” with related documentations for knowledge preservation (i.e., refined bug recipes, development issues encountered). Although we cannot measure the testing process directly, we can measure developer contributions from developer communication spaces (mailing list, CVS, 4
th
http://www.python.org/, last accessed on 14 February 2008.
and issue tracker) prior to a release. Hence we can obtain the following metrics: changes to code metrics (e.g. delta, added, deleted, modified to line of codes by developers) [9], number of committers/core developers and number of peripheral developers [14], code and changes contribution of core and peripheral developers.
QA Activity 3: Code Peer Review In a quality-aware OSS project, an issue labeled “resolved” will attract other developers to review the code set. A committer then should decide based on review results whether a code set should be added into current body of code or get returned to the issue tracker (circle 3 in Figure 1). These practices especially peer review can be observed through the project communication space, issue tracker and project CVS. Prior to a release date, a release manager needs to identify which patches and functionalities should be added to the next release package. Later he performs integration testing to assure the software quality before publishing the release package. Code peer review effectiveness can be measured as number of defects stated as “closed” prior to a release [23]; based on the Bugzilla5 documentation “closed” means the issue has been resolved and has passed a peer review. For example: number of closed defects, number or resolved defects, number of resolved defects/number of reported defects, number of closed defects/number of reported defects.
QA Activities 4 and 5: Product Release Usage and Defect Validation The user community obtains the new release and uses it in different work contexts, and provides feedbacks to the developer community such as defects found and feature requests. This defect detection practice is similar to black box testing to find defects in a software product release (see circle 4 in Figure 1). The defect detection activities provide a list of defect candidates of a software release and considered as the primary activities performed by developers and users a release in OSS project [14]. Prior work [18] provides several examples of metrics that can be used as predictors such as: number of defects reports prior to release, number of open defects prior to release, number of invalid defects prior to release, and defect detection effectiveness prior to release. Most of the defects are detected through software usage and then validated by a developer by reproducing the defect based on defect recipe report from the 5
Bugzilla documentation can be found at :http://www.bugzilla.org/docs/. Last accessed 10th December 2007.
user (see circle 5 in Figure 1). If the defect is valid, a developer takes ownership of the confirmed defect and performs a suitable development process for resolution. In this study we applied all of these project metrics as predictors and investigated their correlation to defect estimates in the case study context.
4. Case Study Design In this section, we describe our case study objects, define independent and dependent variables, and formulate research hypotheses for evaluation. Later we proposed our two-step predictor selection procedure. First, we use correlation analysis as suggested in [15] to identify predictors with strong correlation to potential defect growth between releases. In this paper, we call the potential defect growth between releases “delta defects”. Estimates of delta defects are important indicators to evaluate the quality improvement of the current development process (e.g., potential contribution of defects of the next release) compared to prior releases. In the second step, we use stepwise regression and backward elimination for selecting a subset of independent variables (predictors) from the strong correlated list to form a linear prediction model [12]. For evaluation, we cross validate the prediction model by comparing the average relative error (ARE) [17] of each prediction model to select which variant provides better estimates of delta defects.
4.1. Objects The objects of our case study are releases in the family of the OSS Apache MyFaces project6.We selected MyFaces Core and MyFaces Tobago for the study because Core is the main project of MyFaces and a pure OSS project (all voluntarily developers) while Tobago is a hybrid project where some developers are paid and well supported by commercial organizations. Later we applied defect prediction models to six releases of Core (C.1.1, C.1.2, C.1.3, C.1.4, C.1.5, and C.1.6) and six releases of Tobago (T.1.1, T.1.2, T.1.3, T.1.4, T.1.5, T.1.6). Our selection criteria are: all releases should be announced after both projects have left the incubation process from the Apache Software Foundation7. Later we can regard our selected study objects as mature releases and have been promoted for larger user and developer community; therefore, we can observe more activities within the project commu6
Apache MyFaces Project website can be found at http://myfaces.apache.org/. Last accessed at 10th January 2008. 7 http://incubator.apache.org/ Last accessed at 10th January 2008.
nity compare to the activities during the incubation process.
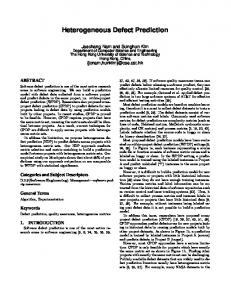
4.2. Threats to Validity As in any empirical study, there are threats to the validity of data collection and analysis that need to be acknowledged and addressed appropriately. To reopen a resolved defect is common practice in OSS projects [18] thus there is high possibility that some of new defects reported are old defect from prior releases which most of them could not be observed. Our observation using reliability growth models (see figure 2 in section 5.1), reveals that a large proportion of accumulated defects originated from the incubator process hence prior to the early mature releases the developers were heavily preoccupied to resolve these defects. As the results in the first mature releases of both projects reveal very large number of defects reported which significantly increase the data skewness especially in MyFaces Core. To address such issues in this paper after collecting valid defect data (by excluding invalid and duplicate defects) using Jira query we classified defect as a) “defect prior to release”: a defect from prior release that has been targeted to be resolved for the next release, and b) “defect reported after release”: a release defect that has been reported into the issue tracker after release. Later we normalized the number of defects data reported after release with accumulative number of defects prior to release (see equn 1 in section 4.3). Later we called this normalized data as defect growth between releases or delta defects. In this work, we focus in one OSS community only; therefore, we consider the results would be valid for the projects in MyFaces and similar community in Apache family. However, we still need to validate the robustness of proposed estimation model with different OSS project communities.
4.3. Variables The measurement model defined for the empirical study consists of independent and dependent variables. Following standard practice in empirical studies we define the independent variables as: a) selection of input parameters (product, project or combination of both) and b) context parameters consisting of deployment metrics, configuration metrics, project origin, project sponsorship (pure or hybrid) and period of case study. The dependent variable in our case study is growth of defect between releases called as delta defect (Py). Py signifies the number of defects reported after release (y) in comparison to accumulative defect reported prior to release (yo) and y (see equn. 1).
(equn. 1) Using Py as dependent variable we can directly assess current quality of release in term of defect reported in comparison to prior release, for example if Py > 50% means current release contributes more defects than in prior to release and signify the need for higher resource allocation for defect removal. To select which predictors have strong correlation with independent variables, we employ the Pearson bivariate correlation model [15], and we use multiple linear regressions to exclude insignificant predictors [12] and to develop prediction models with different combination of predictors (product metrics only, project metrics only, and combination of both types of metrics). To validate our prediction models we fit the model to historical data of releases, we use the average relative error (ARE) to evaluate forecast accuracy. In equn. 2 we apply the ARE definition as suggested by [17] to Py instead of absolute number of defects reported (y); and Py’ as estimator of Py (see equn 2). ∑
(equn. 2)
4.4. Hypotheses In the case study we will evaluate following hypotheses in order to address the research issues: RI1. Contribution of Project Metrics: Goal of this research issue is to investigate whether an increase of QA effort is correlated with a decrease of defects in the next release. Therefore we propose the null hypothesis as: H01: There is no project metrics (pj) that has statistically significant impact to dependent variable Py compare to product metrics (pd). If r is a function to check whether there is a strong correlation between variables x ϵ Pj and dependent variable Py, then the respective null hypothesis can be formulated as H01:
|
,
(equn. 3)
RI2. Accuracy of Defect Prediction using Combined Project and Product Metrics: A combination of project and product metrics should be able to predict the defect growth in the next release with lower ARE value compared to prediction based on the traditional product metrics alone. Then we proposed following null hypothesis as: H02: A prediction model that used combination of project and product metrics has higher ARE value compare to prediction model that used only product metrics. If the estimate of defect prediction model (℮)
is a function of product (pj) and/or process metrics (pd), then the respective null hypothesis can be formulated as: H02: ARE(℮(pj,pd)) > ARE(℮(pd) ) (equn. 4)
4.5. Data Collection In this work, we examined both projects during 6 months of recent development (1/10/2007 to 01/03/2008). To measure the development activities before release, we retrieved historical code collections using StatSVN tool, SVN log and diff commands from the trunk directory of each project. We collected more than 1,700 valid issues and more than 1,300 valid reported defects using Jira query commands. We applied an Eclipse metrics tool plug-in8 to measure product metrics of the study objects. We used a check style plug-in9 to analyze style violations in the source code10. We analyzed the collected data using SPSS for performing Pearson correlation analysis and linear regressions procedures (Stepwise and Backward). Table 3 (see Appendix) describes collected product metrics as suggested by [7] with two additional code quality metrics. Table 4 (see Appendix) outlines 23 project metrics as suggested by [7, 17, 18, 19] and newly proposed metrics (bold font). For deployment and usage metrics we used following metrics: type of release (major release, minor release and service pack), months since the 1st release, months since the previous release, month to the next release, months from release date to the end of case study.
5. Data Analysis Results In this section, we outline the reliability growth model for MyFaces Core and Tobago derived from the whole life span of both projects. Later we perform the predictor selection procedures and estimate the defect growth between releases using variants of metrics (product metrics, project metrics, and combination). Our two-step predictor selection process starts with predictor correlation analysis to find out a set of the strongest correlated predictor to Py and then we use stepwise and backward linear regression to exclude some insignificant predictors.
8 Metrics plug-in for Eclipse: http://metrics.sourceforge.net/. Last accessed at 15th December 2007. 9 Check style plug-in for Eclipse: at http://eclipse-cs.sourceforge.net/. Last accessed at 10th December 2007.
5.1. Predictor Correlation Analysis Table 1 shows the Pearson rank correlation among predictors with the dependent variable Py. In a first step we analyze predictors with Core data, and then we compare the results to Tobago data. From table 1, project metrics such as RRD, RCD and CI considered have significant correlation to Py. RCD has negative correlation with Py that means every peer-reviewed defect resolution may reduce the possibility of defect reported in the next release. While RRD and CI has positive correlation to Py which means that resolved defects and number of issue patched prior to a release may increase number of defects. Table 1. Top 10 Predictors Correlation Analysis11 Predictors Resolved Defects/Reported Defects Closed Defects/Reported Defects Closed Issues prior to release/Reported issue Changes by peripheral developers/total changes NPath Complexity Resolved defects prior to release McCabe Cyclomatic Complexity Class Data Abstraction Coupling Depth Inheritance Tree Method LOC
Abbreviation RRD
Core Tobago
Correlation 0.927* 0.967*
0.024 0.02
RCD
Core Tobago
-0.879* -0.969*
0.005 0.001
CI
Core Tobago
0.901* 0.695
0.037 0.125
CBD
Core Tobago
-0.768 -0.465
0.042 0.132
NP
Core Tobago Core Tobago Core Tobago Core Tobago Core Tobago Core Tobago
-0.734 -0.272 0.681 0.955* 0.613 0.212 0.582 0.243 0.580 0.616 0.460 0.345
0.158 0,602 0.205 0.03 0.272 0.686 0.303 0.064 0,305 0,193 0,012 0,155
RD MCC CDA DIT MLO
Project
Sig.
5.2. Reliability Growth Models We collected defect occurrences data and use quadratic curve estimation to construct reliability growth models (RGMs) of Core and Tobago as can be seen in figure 2. The RGMs are useful to outline defect growth through all project life cycle, later using data from table 3; we can perform analysis based on correlation of strong predictors with defect growth between releases. We discuss the results with an OSS expert to identify potential scenarios of the outlined RGMs Using correlation table 1, there are at least two scenarios that potentially accelerate the defect growth in 11
*) correlation is significant with p-value < 0.05 level (2-tailed)
Core as estimated in figure 2a as a steep linear defect growth which are a) new defects found in new features and patches b) a curious developer takes resolved defect prior to release and reports as new defect in current release. Tobago has a gradual hyperbolic curve, which means potential deceleration of defect growth after 5 releases. The RGM shape of Tobago could be derived by higher number of defects closed prior to release. Using correlation data from table 1, we can assume that that in Tobago, the developer community spends more effort for peer reviewing defect resolutions compare to Core (see figure 3 in Appendix), in which after five releases have been paid off by slower defects growth.
the procedures for each group. Each estimation procedure was used with the three groups to fit a linear modeling expressing program defect growth in a release (Py). In this case, each procedure led to selection of these following metrics: product metrics (CDA, DIT), project metrics (CD, RRD, RCD, CBD) and combination metrics (MCC, DIT, CBD, CDA, RRD, RCD). We use these variants of metric sets from historical release and fit the data into the regression model. The predictive quality for each estimation procedure was determined by determining the ARE values from all project releases to perform cross validation of the model. Table 2 shows the prediction results using linear regression and conclude that using Stepwise linear regression with combination metrics is superior to other prediction models. Table 2. Comparison of Prediction Models. Prediction Model linear regression product metrics linear regression project metrics linear regression combination metrics
with with with
Project Core Tobago Core Tobago Core Tobago
Mean (ARE) 0.93 0.12 0.24 0.06 0.02 0.04
StdDev 1.18 0.08 0.26 0.05 0.01 0.01
6. Discussion
(a) RGM for MyFaces Core
(b) RGM for MyFaces Tobago Fig 2. Reliability Growth Models (RGM) for Myfaces Tobago and Core
5.3. Selection of Predictors Stepwise regression and backward elimination procedure support selecting a subset of independent variables (predictors) from the top-ten list to form a linear model. We grouped the predictors into three groups: product, project and combination metrics, and employ
Analyzing the empirical results, we derive the following implications for defect prediction in comparable OSS projects. Contributions of Project Metrics. The results show for both MyFaces Core and Tobago that project metrics, which are related to issue and defect resolution prior to release, have strong correlation to defect growth between releases (Py). Data analysis for both projects agreed for RRD and RCD to have strong and significant correlation with dependent variables Py. For example, the increase of peer reviewed defect resolution prior to a release significantly reduces the likely number of defects in a release; while a higher number of resolved defects prior to a release are correlated to stronger defect growth. In an OSS project, this can be a result of practices such as reopening resolved defects or adding defect prior to release as a new defect in current release. In Core CI is strongly positively correlated to Py (pvalue