THE JOURNAL OF CHEMICAL PHYSICS 130, 134716 共2009兲
Density functional theory, molecular dynamics, and differential scanning calorimetry study of the RbF–CsF phase diagram O. Beneš,1,2,a兲 Ph. Zeller,2 M. Salanne,3,4 and R. J. M. Konings1 1
European Commission, Joint Research Centre, Institute for Transuranium Elements (ITU), P.O. Box 2340, 76125 Karlsruhe, Germany 2 Department of Physics and Chemistry, CEA/Saclay, F-91191 Gif-sur-Yvette, France 3 UPMC Univ Paris 06, UMR 7612, LI2C, F-75005 Paris, France 4 CNRS, F-75005 Paris, France
共Received 27 November 2008; accepted 18 February 2009; published online 7 April 2009兲 A multiscale modeling approach is developed to compute the phase diagram of the RbF–CsF binary system. The mixing enthalpies of the 共Rb,Cs兲F solid and liquid solutions are evaluated using density functional theory and classical molecular dynamics calculations, respectively. For the solid solution, 18 different configurations are studied with density functional theory and the surrounded atom model is applied in order to compute the configurational partition function. We also measure the solidus and liquidus equilibria using differential scanning calorimetry. Finally the RbF–CsF phase diagram is constructed using the calculated excess free enthalpies of the solid and liquid solutions and a very good agreement with our experimental data is found. © 2009 American Institute of Physics. 关DOI: 10.1063/1.3097550兴 I. INTRODUCTION
The design of tomorrow’s nuclear reactors involves the development of new materials. Among them, in the molten salt reactor 共MSR兲 the fuel consists of a molten fluoride matrix in which the actinides are dissolved. Several criteria must be fulfilled by MSR fuels, thus limiting the selection of the salt. In the Russian concept of the nonmoderated MSR 共MOSART concept兲1 the fuel is based on the LiF– NaF– BeF2 matrix with 1.3 mol % of AnF3, mostly represented by 239PuF3, added as a fissile material. In a previous study2 five fuel alternatives based on the MOSART concept have been presented and one of them is a system based on the LiF–NaF–RbF matrix. To predict the fuel behavior in terms of its melting temperature, vapor pressure, or actinide solubility, a thermodynamic description of the system is needed. Moreover to investigate the thermodynamic behavior of the fuel contaminated with some amount of fission products that are difficult to extract during the MSR clean-up process one must consider the presence of the CsF compound. The thermodynamic assessment of the LiF– NaF– RbF– CsF– PuF3 system has therefore been made as described in this previous study.2 It has, however, been noted in Ref. 3 that some additional data would be necessary in order to describe the RbF–CsF subsystem more precisely. This paper presents a thermodynamic assessment of the RbF–CsF system. At the start of this work it was already known that no intermediate compound exists in this system. Both end members crystallize in the same fcc structure, the solution is substitutional, and there is extended solubility both in the solid and in the liquid states. Also, the thermodynamic functions of both end members are well known. Hence what was missing was the exact boundaries of the a兲
Electronic mail:
[email protected].
0021-9606/2009/130共13兲/134716/13/$25.00
liquid+ solid two-phase field, i.e., the liquidus and the solidus, as well as the excess contributions to the thermodynamic potentials. In this work we measure the solid-liquid equilibria using differential scanning calorimetry 共DSC兲 共Sec. II兲. We also compare them to a phase diagram that we build using the excess Gibbs energy of the 共Rb,Cs兲F solid solution and that of the 共Rb,Cs兲F liquid solution, both calculated here. These latter calculations involve two distinct approaches, which have in common their first-principles basis, for the solid and liquid phases. The solid solution is treated in Sec. III. First some configuration energies are calculated using the density functional theory 共DFT兲.4 Next the relevance of the ”bond model” 共BM兲 and the ”surrounded atom model” 共SAM兲 共Ref. 5兲 is discussed to extrapolate the energy to any configuration of the solid solution. Then we use either of two approximations, those of Bragg and Williams6 and Guggenheim,7 to compute the partition function ⍀ and hence the free energy. Although historically the Bragg–Williams 共BW兲 and Guggenheim approximations were presented within the frame of the BM whereas the SAM was introduced combined with the Guggenheim approximation, we distinguish in the present paper the configurational energy models 共Sec. III B兲 from the approximations made in the calculation of ⍀ 共Sec. III C兲. The liquid solution is treated by classical molecular dynamics 共MD兲 共Sec. IV兲 with potentials built exclusively from DFT data, as opposed to empirical or semiempirical potentials. This technique has already proven to be successful for the determination of a wide range of physicochemical properties of several molten salts: Dynamic 共diffusion coefficients, electrical conductivity, viscosity兲8 as well as thermodynamic 共heat capacities, thermal expansions, activity coefficients兲9,10 and structural quantities are well described provided that the interaction potentials between the involved species are well chosen.
130, 134716-1
© 2009 American Institute of Physics
Downloaded 08 Apr 2009 to 193.1.172.166. Redistribution subject to AIP license or copyright; see http://jcp.aip.org/jcp/copyright.jsp
134716-2
J. Chem. Phys. 130, 134716 共2009兲
Beneš et al.
Many of the techniques and tools used here 共i.e., DSC, first-principles calculations, MD, calculation of phase diagrams兲 are fairly standard and have already been thoroughly described elsewhere–with the possible exception of our treatment of the solid solution. This is why more emphasis is given on the corresponding part of the paper 共Sec. III兲.
TABLE I. Solidus and liquidus temperatures of the RbF–CsF system obtained by DSC in this study.
II. EXPERIMENTAL
The RbF–CsF binary system has been investigated by Samuseva and Plyushchev,11 who used thermal analysis to determine the solidus and liquidus points. Their reported phase diagram, however, shows a temperature minimum on the solidus curve without a corresponding minimum on the liquidus curve which results into a binary phase field which is defined by two different equilibria 共solid solution–liquid solution and solid solution–solid solution兲, thus violating the phase rule. Therefore new measurements of the solidus and liquidus temperatures of the RbF–CsF system were made in the present study. Our measurements are performed using DSC performed on a SETARAM multidetector high temperature calorimeter. The samples were prepared by mixing the initial pure RbF 共Alfa Aesar, 99.975% metallic purity兲 and CsF 共Alfa Aesar 99.99% metallic purity兲 compounds. These fluorides are very hygroscopic and therefore prior to the sample preparation they were dried in a powder form under vacuum at T = 453 K for 4 h. Thus obtained dry precursors were stored in a glove box which was kept under constant argon gas flow of 6.0 grade 共measured long time content of the moisture in the glove box is 28 ppm兲. In order to minimize the weighing error, all samples were weighed directly in the stainless steel, gas tight DSC crucibles specially developed at ITU.12 Boron nitride 共oxygen-free, AX05 grade兲 liner was inserted into the crucible to avoid direct contact between the steel and the fluoride salts which are corrosive at high temperatures. Every DSC measurement consisted of three heating and cooling runs. The first run was always used to achieve good mixing between the RbF and CsF compounds. During this run the salt was kept for 1 h at T = 1173 K, well above the melting temperature of both components. The data from this run have never been considered for the analysis. The two other runs were monitored and consisted of the heating and cooling sequences, both at temperature rate of 3 K/min. The peak temperature was 1173 K as in the case of the prerun. Since the melting temperatures of the pure compounds were well reproduced from the heating and cooling curves, it has been assumed that there is no supercooling effect in this system. This observation was also supported by the fact that RbF and CsF are highly ionic compounds and thus their crystallization is very fast. Therefore it was possible to analyze the solidus points as the onset points of the DSC peaks from the heating curves and the liquidus points as the onset points of the DSC peaks from the cooling curves. The results are reported in Table I and included in Figs. 8 and 9 共in Sec. V兲 in which a comparison to the calculated phase diagrams is made.
xCsF
Tsolidus 共K兲
Tliquidus 共K兲
0 0.069 0.088 0.141 0.236 0.297 0.396 0.506 0.597 0.694 0.788 0.839 0.858 1
¯ 1022.6 958.9 1015.6 985.9 973.7 961.7 962.1 947.1 953.1 941.4 944.4 960.3 ¯
1060.9 1040.6 978 1033.1 1010.7 999.9 983.8 978.2 967.9 961.3 953.2 954.6 999.4 959.4
III. SOLID SOLUTION
We consider here a macroscopic sample made of NRb rubidium atoms, NCs cesium atoms, and N = NRb + NCs fluorine atoms. Molar fractions are denoted xRbF =
NRb N
and
xCsF =
NCs . N
共1兲
All the calculations performed in this work are done at zero pressure so that the pV term is equal to zero, enthalpy is equal to internal energy 共H = U兲, and Helmholtz energy is equal to Gibbs energy 共F = G兲. It must be noted that although for ambient conditions p = 1 bar, due to the fact that we are dealing with condensed phases the pV term is negligible throughout. Statistical thermodynamics in the canonical ensemble at absolute temperature T relates the configurational part of the free energy to the partition function ⍀ through the following formulas: F = − kBT ln ⍀ and
冉
⍀ = 兺 exp − c
共2兲
冊
⌽共c兲 , k BT
共3兲
where c represents a configuration, i.e., an arrangement of the set of Rb and Cs atoms on the cation sublattice, ⌽共c兲 is its energy, and kB is the Boltzmann constant. Notations are those of Mathieu et al.5 We assume that disorder does not mix cations with anions since it is well established that antisite defects in these strongly ionic compounds have a very large positive energy. Accordingly, the configurational energy is attributed to cations only and from here on we do not mention F− anions any more in this section. In contrast to a “configuration,” a solid solution is a macroscopic concept encompassing all these microscopic configurations. The weight of a configuration in a given solid solution depends on external constraints as described by thermodynamic variables 共e.g., p, T, U, S, xRbF, xCsF, Rb, and Cs兲, out of which we choose here p = 0, T, and xRbF. Mixing quantities obey
Downloaded 08 Apr 2009 to 193.1.172.166. Redistribution subject to AIP license or copyright; see http://jcp.aip.org/jcp/copyright.jsp
134716-3
similar relationships as shown in Eqs. 共2兲 and 共3兲. In this study it is assumed that configurational energies do not depend on temperature and they are computed for T = 0 K. In other words the vibrational contributions to the excess free energy are neglected. This includes the so-called zero-point energy, i.e., the phonon energy at T = 0 K, since we do not compute any phonon spectrum. A. DFT calculation 1.
CASTEP
J. Chem. Phys. 130, 134716 共2009兲
Investigation of the RbF–CsF phase diagram
parameters
Our calculations are performed using the planewave pseudopotential code CASTEP which implements DFT and has been extensively described elsewhere.13 We use the generalized gradient approximation of PerdewBurke-Ernzerhof 共GGA-PBE兲 approximation14 for the exchange correlation functional. The first Brillouin zone is sampled with the Monkhorst–Pack scheme15 with intervals no larger than 0.040 Å−1 on all axes. We use the MATERIALS STUDIO 共Ref. 16兲 interface for launching the calculation and analyzing the results as well as various interfaces and tools within the CYGWIN/X package.17 The pseudopotentials are also taken from the MATERIALS STUDIO library. To identify the best cut-off energy value, several calculations of tetrag4 onal RbCsF2 共P m mm space group兲 have been performed with cut-off energies ranging from 350 to 500 eV by 50 eV steps. A satisfactory accuracy is achieved for a cut-off energy of 400 eV and this value has been selected for all our calculations. All elements are described using Vanderbilt scheme ultrasoft pseudopotentials18 with configurations 关He兴2s22p5 for F, 关Ca 3d10兴4s24p65s1 for Rb, and 关Sr 4d10兴5s25p66s1 for Cs. For each configuration a “geometry optimization” is performed, i.e., ionic positions and cell parameters are varied so as to minimize the total energy. Pseudopotentials from the MATERIALS STUDIO library are provided with several convergence and validity tests. In order to assess the validity and the performance of our chosen set of parameters–including these pseudopotentials–we have complemented those tests by computing equilibrium geometries and atomization energies of pure Rb, Cs, RbF, and CsF crystals and comparing them to experimental values taken from the literature.19,20 For atomization energies we have included in the calculated data the zero-point energies computed with CASTEP 共all of them in the 1 kJ/mol atom order of magnitude兲 and in the experimental data all the corrections describing the transition from the standard state at 298 K to the zero pressure and zero temperature conditions. The results are summarized in Table II. All lattice parameters agree to within 1%, which is a good result consistent with CASTEP standard performances for these settings,21 confirming the quality of the pseudopotentials. All calculated atomization energies happen to be underestimated by 7 ⫾ 1 kJ/ mol atom. This similarity is of course fortuitous, and the relative differences are 10% for the pure metals and 2% for RbF and CsF. The discrepancy for the pure metals is in the usual range, but it may also reflect the fact that for those simple metals the GGA usually performs worse than the local density approximation. Since this paper focuses on ionic and partly covalent materials GGA is arguably the best
TABLE II. Atomization energies and lattice parameters of some chosen reference compounds. Lattice parametera 共Å兲 Compound Rb metal Cs metal RbF CsF
Atomization energyb 共kJ mol−1兲
Experimentalc
CASTEP
Experimentald
CASTEP
5.70 6.14 5.64共2兲 6.03
5.70 6.14 5.710 6.100
82.192 78.014 718.180 709.598
75.4 70.0 704.5 693.0
a
All these compounds crystallize in a cubic structure. At 0 K and 0 bar. c Reference 20. d References 19 and 42. b
choice. For RbF and CsF these energy differences are acceptable given the purpose of this work. In fact although errors on energies of the order of 7 kJ/mol atom would in general preclude the computation of a phase diagram completely ab initio, relative errors of a few percentage on the excess quantities are quite satisfactory and we may in fact expect small relative errors on the excess quantities due to wellknown error cancellation properties in first-principles calculations.4,21 2. Excess configurational energies
The energies of 18 different configurations of the 共Rb,Cs兲F solid solution have been calculated using CASTEP. Energies of the pure RbF and CsF end members have then been proportionally subtracted from the energy of each 共Rb,Cs兲F solid solution configuration in order to obtain the excess configurational energy as ⌽xs共RbxCsyFx+y兲 = ⌽共RbxCsyFx+y兲 − x⌽共RbF兲 − y⌽共CsF兲.
共4兲
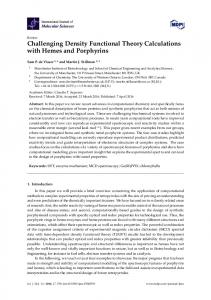
The choice of the various configurations was made by arbitrary displacement of the Rb and Cs atoms on the cation sublattice in order to cover a large array of nearest neighbor environments. The calculated excess configurational energies are shown in Fig. 1 and reported in Table III. Although some of the configurations have the same crystallographic space group and contain the same amounts of Rb and Cs cations per unit cell 共e.g., case of configurations 6, 8, and 9兲 the arrangements of the cations within the cation sublattice are different, as well as their cell parameters, so that they correspond to different configurations and are in general associated with different energies. B. Configurational energy models
In order to extrapolate ⌽ 关see Eq. 共3兲兴 from our CASTEP data set to any configuration, several models can be considered. A very common one, used by Guggenheim in his treatment of mixtures,7 can be called the bond model 共BM兲. It distributes the configurational energy among the first neighbor bonds, that is, in the present case, among the cationcation bonds since we neglect F− anions. Three parameters are introduced: RbRb, CsCs, and RbCs = CsRb which describe the bond energies according to their type. The energy of
Downloaded 08 Apr 2009 to 193.1.172.166. Redistribution subject to AIP license or copyright; see http://jcp.aip.org/jcp/copyright.jsp
134716-4
J. Chem. Phys. 130, 134716 共2009兲
Beneš et al.
xs xs ⌽SAM 共c兲 = ⌽SAM 共共M j兲,共Pi兲兲 xs = ⌽SAM 共M 1, . . . ,M 12, P1, . . . , P12兲 12
12
=兺
j − M j共ERb
0 ERb 兲
FIG. 1. Excess configurational energy ⌽xs of the various configurations of CASTEP the 共Rb,Cs兲F solid solution calculated with 共⽧ symbol兲 and with the SAM 共䊊 symbol, Sec. III B兲. 共Solid curve兲 Excess enthalpy Hxs of the solid solution obtained with the BW thermodynamics model applied to the SAM data 共Sec. III C 1兲.
0 i + 兺 Pi共ECs − ECs 兲.
共7兲
i=1
j=1
Fitting Eq. 共7兲 to CASTEP data requires optimization of 0 0 j i − ERb and 12 ECs − ECs excess en2z = 24 parameters 共12 ERb ergies兲. Beyond the fact that this is impossible based on the knowledge of “only” 18 configurations calculated in this work, it would not make much physical sense to fit these parameters completely independently of one another by recurring to, say, 26 configurations instead of 18. Nevertheless, in the same way as in the original work by Mathieu et al.,22 we observe that a three-parameter law of variation of these excess energies as a function of the atom surroundings is sufficient in order to obtain a good agreement between the SAM and CASTEP results. Introducing the molar excess energies 0 j − ERb 兲 U j = NA共ERb
and
0 i Vi = NA共ECs − ECs 兲,
共8兲
configuration c and the associated excess energy are where NA is Avogadro’s number, the parabolic laws used in this study are
z ⌽共c兲 = 共NRbRbRb + NCsCsCs兲 + W 2 and
⌽ 共c兲 = W , xs
共5兲
共9兲
V i =  1i +  2i 2 ,
共10兲
and
where z is the lattice dependent coordination parameter which in case of the 共Rb,Cs兲F fcc lattice is equal to 12, W is the number of Rb–Cs nearest neighbor pairs in the sample, and , the single parameter of the model for excess energy, has the dimension of an energy and is defined as RbRb + CsCs = RbCs − . 2
U j = ␣1 j + ␣2 j 2
where ␣1 = 0 共Ref. 23兲 and ␣2, 1, and 2 are the three parameters optimized by least squares fit to
共6兲
The BM cannot be satisfactorily fitted to our CASTEP data set as it leads to a rms deviation of the order of the excess energies themselves. Therefore we switched to the more elaborate treatment provided by the SAM. The SAM has been presented by Mathieu et al.5,22 to describe binary alloys. We apply it here to the pseudobinary mixture by treating RbF and CsF as two atomic species. In the following we briefly summarize the original derivation by Mathieu et al. using as much as possible the notations of their work.5 The main characteristic of the SAM is the elementary configurational support as a central atom 共in our case a cation兲 in the force field of its z nearest neighbors on the cation sublattice. This replaces the partitioning based on pair interactions used in the BM described above. A configuration is characterized by a set of 2共z + 1兲 = 26 numbers denoted 共M 0 , M 1 , . . . , M 12 , P0 , P1 , . . . P12兲 where M j is the number of Rb atoms having exactly j Cs first neighbors and Pi is the number of Cs atoms having exactly i Rb first neighbors. j The corresponding individual atom energies are denoted ERb i and ECs according to the atom type and its surroundings. The excess configurational energy of configuration c is therefore simply equal to
␣2 = + 76.4 J/mol cation,
共11兲
1 = − 550.9 J/mol cation,
共12兲
2 = + 85.2 J/mol cation.
共13兲
Excess configurational energies obtained from the SAM are plotted in Fig. 1 together with CASTEP values and a very good data reproduction is evident. These results are also reported in Table III as well as the difference between CASTEP and the SAM giving a maximum absolute error of 0.141 J/mol. We conclude this section with a few relationships5 which will be needed in the next section. 12
12
M j = NRb, 兺 P j = NCs 兺 j=0 j=0
共14兲
and 12
12
jM j = 兺 jP j = W, 兺 j=0 j=0
共15兲
where W is the number of Rb–Cs nearest neighbor pairs, are derived from obvious conservation laws.
Downloaded 08 Apr 2009 to 193.1.172.166. Redistribution subject to AIP license or copyright; see http://jcp.aip.org/jcp/copyright.jsp
134716-5
J. Chem. Phys. 130, 134716 共2009兲
Investigation of the RbF–CsF phase diagram
TABLE III. Calculated excess configurational energy of some configurations of the 共Rb,Cs兲F solid solution. No.
Compositiona
Structure
Space group 共IT number兲
1
RbF
Cubic
2 3 4 5 6 7 8 9 10 11
Rb7CsF8 Rb7CsF8 Rb3CsF4 Rb5Cs3F8 Rb20Cs12F32 Rb20Cs12F32 Rb20Cs12F32 Rb20Cs12F32 RbCsF2 Rb2Cs2F4
Cubic Tetragonal Orthorhombic Monoclinic Monoclinic Monoclinic Monoclinic Monoclinic Tetragonal Orthorhombic
12 13 14 15 16 17
Rb3Cs3F6 Rb4Cs4F8 Rb4Cs4F8 Rb12Cs20F32 Rb3Cs5F8 RbCs3F4
Hexagonal Tetragonal Tetragonal Monoclinic Monoclinic Orthorhombic
¯ m 共225兲 Fm3 ¯ m 共225兲 Fm3 4 P m mm 共123兲 Cmmm 共65兲 2 P m 共10兲 Pm 共6兲 2 P m 共10兲 Pm 共6兲 Pm 共6兲 4 P m mm 共123兲 Pmmn 共59兲 ¯ m 共166兲 R3
18 19
RbCs7F8 RbCs7F8
Cubic Tetragonal
20
CsF
Cubic
Amm2 共38兲 Pmma 共51兲 Pm 共6兲 2 P m 共10兲 Cmmm 共65兲 ¯ m 共225兲 Fm3 4
P m mm 共123兲 ¯ m 共225兲 Fm3
b xs ⌽CASTEP
bc xs ⌽SAM ,
bc xs xs ⌽SAM − ⌽CASTEP ,
0
0
0.935 1.154 1.401 2.207 2.263 1.499 1.816 2.319 2.946 1.319
0.937 1.013 1.441 2.107 2.199 1.635 1.877 2.431 2.968 1.256
0 0.002 ⫺0.141 0.040 ⫺0.100 ⫺0.064 0.136 0.061 0.112 0.022 ⫺0.062
1.256 2.142 2.142 1.663 2.081 1.270
1.256 2.112 2.112 1.654 2.030 1.299
0.000 ⫺0.030 ⫺0.030 ⫺0.010 ⫺0.050 0.029
0.796 0.845
0.804 0.890
0.009 0.044
0
0
0
a
The indicated composition corresponds to the number of atoms per unit cell. All units are in kJ/mol of one RbxCs1−xF unit formula. c SAM stands for surrounded atom model 共Sec. III B兲. b
mj =
Mj NCzj
and
pi =
Pi
, NCzi
共16兲
where Csr = 共 rs 兲 = s ! / 共r ! 共s − r兲!兲 is the usual binomial coefficient, define useful auxiliary variables m j and pi.
N! = 兺 g共a兲. NRb ! NCs! a=all A
Given that g共a兲 is always positive, there exists a value aញ such that Eqs. 共17兲 and 共18兲 combine into ⍀=
C. Calculation of the partition function
At this point all the terms of the sum in Eq. 共3兲 are known, at least formally, from Eqs. 共7兲–共13兲. To calculate the sum two basic models may be applied, the BW model6 and the Guggenheim model7 also known as the quasichemical model. We have just seen that the configurations can be sorted using an auxiliary parameter, say, A, such that all configurations associated with A = a have the same energy E共a兲. The number of configurations having A = a is the degeneracy denoted g共a兲. In the BM A is simply equal to W, the number of Rb–Cs nearest neighbors pairs, while in the SAM A is an array of 26 numbers 共M 0 , M 1 , . . . , M 12 , P0 , P1 , . . . , P12兲 关see Eq. 共7兲兴. What matters here is that any single configuration c can be given a specific value a = A共c兲, be it in the BM or in the SAM. After having grouped all the configurations which have the same value of A, and therefore the same energy denoted from now on ⌽共a兲, Eq. 共3兲 becomes ⍀=
冉
兺 g共a兲exp a=all A
−
⌽共a兲 k BT
冊
and the total number of configurations is
共17兲
共18兲
冉
冊
N! ⌽共aញ 兲 exp − , NRb ! NCs! k BT
共19兲
where aញ is in general a function of T, NRb, and NCs and ញ = ⌽共aញ 兲 is a weighed average of the configurational energy. ⌽ The free energy of mixing is obtained from ⍀ using Eq. 共2兲 Fm = ⌽共aញ 兲 + kBT共NRb ln xRbF + NCsF ln xCsF兲,
共20兲
and the Boltzmann law for the probability of an arbitrary configuration c to occur becomes prob共c兲 =
冉
冊
⌽共aញ 兲 − ⌽共A共c兲兲 NRb ! NCs! exp . N! k BT
共21兲
1. Bragg–Williams model
The BW model considers a completely disordered solution. From the point of view of configurational arrangements this assumption implies that the probability for any given cation site to be occupied by a Cs 共resp. Rb兲 cation is equal to xCsF 共resp. xRbF兲 whatever its surroundings. Therefore the probability for a given Rb atom to have exactly j Cs atoms and z − j Rb atoms among its 12 nearest neighbors is given by the binomial distribution as
Downloaded 08 Apr 2009 to 193.1.172.166. Redistribution subject to AIP license or copyright; see http://jcp.aip.org/jcp/copyright.jsp
134716-6
J. Chem. Phys. 130, 134716 共2009兲
Beneš et al.
M ⴱj z−j j xRbF , = CzjxCsF NRb
共22兲
from which we get z−j+1 j mⴱj = xCsF xRbF
z−j+1 j xCsF . and symmetrically pⴱj = xRbF
共23兲 In this and the following sections all SAM quantities relative to the BW solution are denoted with a star superscript. These expressions together with Eq. 共15兲 yield the number of nearest neighbor Rb–Cs bonds, Wⴱ = NzxCsFxRbF .
共24兲
From a thermodynamics point of view the BW assumption of complete disorder implies that the entropy of mixing is equal to that of ideal mixing, m = − NkB共xRbF ln xRbF + xCsF ln xCsF兲. SBW
共25兲
A comparison of this expression with Eq. 共20兲 shows immediately that the internal energy of mixing is m m m UBW = FBW + TSBW = ⌽共aញ 兲
共26兲
and due to the general law 共U / T兲 p=0,xCsF = T共S / T兲 p=0,xCsF m it appears that ⌽共aញ 兲, like SBW , is temperature independent. Evaluating it as an average configurational energy in the limit of infinite temperature 共so that all configurations have the same probability of occurrence兲, using the linearity of Eq. 共7兲 with respect to M j and Pi and using the fact that M ⴱj and Pⴱi given by Eqs. 共22兲 and 共23兲 are also configurational averages, we obtain 12
1 共M ⴱj U j + Pⴱj V j兲 = ⌽共aⴱ兲. 兺 ⌽共c兲 = 兺 ⍀ x→⬁ all c j=1
m = lim UBW
共27兲 This derivation, in the course of which all exponential Boltzmann terms of Eq. 共21兲 are taken equal to 1, clearly shows where the approximation lies and that the BW model is only justified at high enough temperatures. Using Eqs. 共23兲 and 共9兲–共13兲 and summing over index j leads to the following expression for the molar excess energy and enthalpy 共equal in the present case兲: xs xs ⬅ Um,BW = xRbF共1 − xRbF兲共L11 + L21xRbF兲, Hm,BW
共28兲
where L11 = z共␣1 + 1 + z␣2 + 2兲 = 5413 J/mol
共29兲
and
clear departure from the BM and the solution is asymmetric. This has to do with the fact that the substitution of a Cs atom into a RbF crystal is energetically different from the opposite case of substituting a Rb atom into a CsF crystal. The main characteristics of the BW model are the temperature independence of Hxs and the absence of any excess entropy. Its assumption of complete disorder is best justified in the limiting case of infinite temperature. It is interesting to note that as illustrated by Fig. 1 any single one among the configurations studied with CASTEP would in itself generally give a poor estimate of the excess internal energy/enthalpy of the solution. In fact even a zero excess configurational energy is possible for any concentration—although it is not displayed on the graph. This zero energy is obtained for a single configuration, that with complete spatial separation of both components. The excess internal energy of the solid solution, as a thermodynamic potential, takes into account the fact that in the real crystal disorder may favor higher configurational energies due to their higher statistical weight.
2. The quasichemical “Guggenheim” model
Equation 共21兲 shows that if two configurations have a large energy difference the one with the lowest energy has a significantly larger probability of occurrence. This fact is neglected by the BW model but it is taken into account by the Guggenheim model which we now briefly recall. A crucial step in this model is to write g共a兲 as g共a兲 = h共NRb,NCs兲u共a兲,
共31兲
where u共a兲 is some known expression 共which will be made explicit later兲 that makes up a fair approximation to g but also needs to be complemented by h, called the “normalization factor,” which only depends on NRb and NCs and is not known explicitly. The Guggenheim approximation consists in making use of the theorem of the dominant distribution which states that the sum in Eq. 共17兲 关Eq. 共18兲兴 can be replaced by its maximum term. Forgetting momentarily that the starred quantities have already been defined above within the frame of the BW model, we define here aⴱ such that g共aⴱ兲 is the maximum term of the sum in Eq. 共18兲. We thus obtain aⴱ, which is a function of NRb and NCs but is independent of temperature, by solving
冏 冏 du da
a=aⴱ
共32兲
= 0.
Equation 共18兲 becomes L21 = z共z − 1兲共2 − ␣2兲 = 1162 J/mol.
共30兲
The resulting molar excess enthalpy is shown in Fig. 1 together with the calculated molar configurational energies. The peak of the curve corresponds to xs Hm,BW = 1.502 kJ/ mol and xCsF = 0.48 so that a slight asymmetry toward the RbF side is found. As shown by Mathieu et al.22 if U j and Vi in Eqs. 共9兲 and 共10兲 followed linear laws 共␣2 = 2 = 0兲 the SAM would be completely equivalent to the BM with = 共␣1 + 1兲 / NA and it would describe a symmetric “regular” solution. Since a quadratic law is obeyed there is a
N! = g共aⴱ兲, NRb ! NCs!
共33兲
from which we get h共NRb , NCs兲 as h共NRb,NCs兲 =
1 N! . NRb ! NCs! u共aⴱ兲
共34兲
In a similar way the value of a that maximizes the running term in Eq. 共17兲, denoted ¯a, is obtained as a function of NRb, NCs, and temperature T by solving
Downloaded 08 Apr 2009 to 193.1.172.166. Redistribution subject to AIP license or copyright; see http://jcp.aip.org/jcp/copyright.jsp
134716-7
J. Chem. Phys. 130, 134716 共2009兲
Investigation of the RbF–CsF phase diagram
冏 冉
冉
d ⌽共a兲 u共a兲exp − da k BT
冊冊冏
共35兲
= 0.
u=
¯ a=a
NRb ! NCs! j
i
Nm0 ! 共Nm1!兲z ¯ 共Nm j!兲Cz ¯ Np0 ! ¯ 共Npi!兲Cz ¯ 共44兲
The Guggenheim approximation leads to
冉
¯兲 ⌽共a ¯ 兲exp − ⍀ = g共a k BT
冊
and ln共u兲 is well approximated by 共36兲
and using Eq. 共34兲 to eliminate h共NRb , NCs兲 we obtain the final expression of ⍀ as ⍀=
冉
冊
¯兲 ¯兲 N! ⌽共a u共a . ⴱ exp − NRb ! NCs! u共a 兲 k BT
共37兲
The free energy of mixing is obtained from ⍀ using Eq. 共2兲
冉
¯ 兲 + kBT NRb ln xRbF + NCsF ln xCsF − ln Fm = ⌽共a
冊
¯兲 u共a . u共aⴱ兲
12
ln共u兲 = − N 兺 Czj共m j ln m j + p j ln p j兲.
The starred quantities 关aⴱ, i.e., the set of M ⴱj and Pⴱi that cancel the differential du in Eq. 共32兲兴 end up having the same expressions as those already given within the BW model 关Eqs. 共22兲 and 共23兲兴: Maximization of g in Eq. 共18兲 is equivalent to the hypothesis of total disorder and there is no ambiguity in our notations. The barred quantities are equal to25
冉 冊 冉 冊
¯j=m ¯ 0e j exp − m
Uj , RT
共46兲
¯pi = ¯p0e−i exp −
Vi , RT
共47兲
共38兲 As shown in the original paper5 the following treacherously simple expressions for the molar excess internal energy, enthalpy, and entropy do hold:24
where
12
Hxs ⬅ Uxs =
NA ¯ 兲 = 兺 Czj共m ¯ jU j + ¯p jV j兲 ⌽共a N j=1
共39兲
and Sxs =
¯兲 R u共a ln ⴱ , N u共a 兲
冉
xRbF , Z共兲
共48兲
¯p0 =
1 − xRbF , Q共兲
共49兲
冊冉
冉 冊
冉 冊
z
Uj , RT
共50兲
冉 冊
共51兲
Z共兲 = 兺 Czje j exp −
where R is the perfect gas constant. Let us now specify explicitly function u共a兲. In the BM, which we recall for illustration purposes, a is the number W of Rb–Cs nearest neighbor pairs in the sample and u共a兲 is defined as
u共a兲 =
¯0= m
共40兲
z N ! 2
共45兲
j=0
0
z
Q共兲 = 兺 Czie−i exp − 0
Vi , RT
and is such that e is the single real positive root of the polynomial of degree 2z = 24 in e defined by
冊冉冊冉冊
z z a a a a NRb − ! NCs − ! ! ! 2 2 2 2 2 2
.
Therefore aⴱ, determined by du / da = 0 using Stirling’s formula, is equal to aⴱ = Wⴱ = N z xRbF xCsF
共42兲
and ¯a is the solution of Eq. 共35兲 which reads
冉 冊
¯a2 2 = exp − k BT 共zNRb − ¯a兲共zNCs − ¯a兲
冋
共41兲
共43兲
and gives its name to the “quasichemical” model due to the resemblance with the mass-action law. However, as stated in Sec. III B, in the present case the BM is not satisfactory. In the SAM the expressions are much more complicated due to the fact that a is an array of 26 parameters. Function u is equal to
R共e兲 = ez xRbFQ
册
Z Q + 共1 − xRbF兲Z .
共52兲
These equations, which complete the presentation of the Guggenheim approximation applied to the SAM, have no simple analytical solution in the general case. A numerical solution is conveniently obtained using SCILAB.26 The BW model of Sec. III C 1 can be derived using the present Guggenheim method by just replacing the definition of ¯a in Eq. 共35兲 by ¯a = aⴱ, where aⴱ is given by Eq. 共32兲. Thus Eqs. 共37兲 and 共38兲 become ⍀BW =
冉
N! ⌽共aⴱ兲 exp − NRb ! NCs! k BT
冊
共53兲
and m = ⌽共aⴱ兲 + NkBT共xRbF ln xRbF + xCsF ln xCsF兲, FBW
共54兲
from which Eqs. 共27兲 and 共25兲 can be deduced. This derivation clearly shows why the BW model is also called “zero-
Downloaded 08 Apr 2009 to 193.1.172.166. Redistribution subject to AIP license or copyright; see http://jcp.aip.org/jcp/copyright.jsp
134716-8
J. Chem. Phys. 130, 134716 共2009兲
Beneš et al.
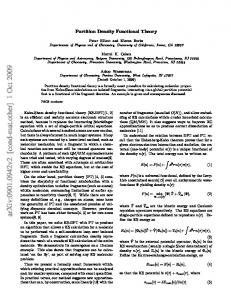
FIG. 2. 共Color online兲 Excess Gibbs energy of the 共Rb,Cs兲F solid solution. The solid curves, obtained with the Guggenheim approximation, are isotherms between 300 and 900 K with a 100 K step. The dashed line is obtained with the BW approximation.
order approximation” while the Guggenheim model is called “first order approximation.” It also shows that the difference between both models can be quantified by ¯a − aⴱ. Going back to the approach behind Eq. 共31兲, a careful examination of Eq. 共41兲 reveals that u共a兲 does not qualify as the number of configurations having a number of Rb–Cs bonds equal to a because of interferences between the different types of pairs and of double counting of oriented Rb–Cs bonds. Similarly u共a兲 in Eq. 共44兲 is not quite equal to the number of configurations having A = a because a given atom belongs to the surroundings of several other atoms and this kind of interference is not taken into account.27 Therefore the sum of u over all values of a allowed by the model is never exactly equal to the total number of configurations. All these effects would be very difficult to take into account properly; hence the correction introduced with function h partly removes these defects and leads to the correct orders of magnitude. The excess Gibbs energy as a function of T and xCsF is reported in Fig. 2 where a comparison between the Guggenheim and the BW models is made. The solid solution is described in the present model using the three fitting parameters denoted ␣2, 1, and 2 and given by Eqs. 共11兲–共13兲. A more physically intuitive interpretation of these three parameters will now be given by resorting to three relationships given in Refs. 5 and 22. Two of them pertain to the excess partial molar enthalpy of CsF in a rubidium-rich solution 共xRbF close to 1兲, approximately given by the following limiting value: xs,⬁ បCs = Vz + zU1 = z共␣1 + 1 + ␣2 + z2兲,
共55兲
and symmetrically to the excess partial molar enthalpy of RbF in a cesium-rich solution xs,⬁ បRb = Uz + zV1 = z共␣1 + 1 + z␣2 + 2兲.
共56兲
J / mol and In the present case we find xs,⬁ បRb = 6580 J / mol. These values and the expressions for these limiting partial molar enthalpies are valid for both the BW and the Guggenheim model: They are insensitive to temxs,⬁ = 5417 បCs
FIG. 3. 共Color online兲 Excess enthalpy of the solid solution calculated for xs,⬁ different values of SRO with fixed T = 1050 K, បCs = 5417 J / mol, and xs,⬁ បRb = 6580 J / mol. Dashed 共SRO⬍ 0兲 and solid lines 共SRO⬎ 0兲 are obtained with the Guggenheim approximation and the thick line 共SRO= 0.019兲 corresponds to CASTEP results. The dotted line is obtained with the BW approximation and is insensitive to SRO.
perature. The third relationship, written here in the limiting case of a cesium-rich solution, reads
SRO = 1 −
冉
冊
冉 冊
¯P V2 − 2V1 22 2 = 1 − exp − = 1 − exp − RT RT Pⴱ2
共57兲 and defines a parameter that we call SRO for “short-range order.” Recalling that P2 is the proportion of cesium atoms that have two rubidium first neighbors, SRO quantifies a difference between the BW 共Pⴱ2兲 and the Guggenheim models ¯ 兲 in terms of cation surroundings in the first coordination 共P 2 shell, i.e., in fact some kind of short-range order associated with the Guggenheim model since the BW model is based on an assumption of complete disorder. Now by inverting Eqs. 共55兲–共57兲 the individual excess cation energies U j and Vi in terms of which the SAM describes the solid solution can be xs,⬁ xs,⬁ xs,⬁ , បCs , and SRO. For given បRb and expressed using បRb xs,⬁ បCs the BW model is insensitive to the third parameter, SRO, whereas the results of the Guggenheim model depend on it. This is illustrated in Fig. 3 where the excess enthalpy is xs,⬁ xs,⬁ and បRb fixed at the values cited above for plotted for បCs a constant temperature T = 1050 K and for a range of SRO values. By construction all the curves merge at the end points 共xRbF ⬃ 0 and xRbF ⬃ 1兲 and they mostly differ in the middle range of xCsF. This figure also shows that according to CASTEP and the SAM, i.e., 2 given by Eq. 共13兲 or SRO= 0.019, short-range ordering occurs indeed in the 共Rb,Cs兲F solid solution but its energetic influence remains quite limited. Let us now relate this to a more commonly used definition of short-range order. In a given configuration the average surroundings of a Rb cation, i.e., the average number of Cs cations around it, is equal to 兺zj=0 jM j / 兺zj=0M j. Hence, given a Rb cation and a given site s among its nearest neighbors, the probability prob共Cs兩 Rb兲 that site s is occupied by a
Downloaded 08 Apr 2009 to 193.1.172.166. Redistribution subject to AIP license or copyright; see http://jcp.aip.org/jcp/copyright.jsp
134716-9
J. Chem. Phys. 130, 134716 共2009兲
Investigation of the RbF–CsF phase diagram
IV. LIQUID SOLUTION: MOLECULAR DYNAMICS
The 共Rb,Cs兲F liquid solution has been studied by MD simulations. In the case of molten fluorides, the potential is best described as the sum of four different components: Charge-charge, dispersion, overlap repulsion, and polarization.30 The first three components are purely pairwise additive; first the charge-charge term is Vq−q = 兺 i⬍j
q iq j , rij
共59兲
where qi is the charge on ion i, and formal charges are used throughout. The dispersion component includes dipoledipole and dipole-quadrupole terms, FIG. 4. 共Color online兲 The correlation between short-range order parameters SRO and at different values of xRbF. All curves are calculated with fixed xs,⬁ xs,⬁ T = 1050 K, បCs = 5417 J / mol, and បRb = 6580 J / mol.
Cs cation is equal to 1 / 共zNRb兲兺zj=0 jM j and one wants to compare it to xCsF. This suggests to define a short-range order parameter by z ¯ prob共Cs兩Rb兲 1 ¯ =1− W , =1− =1− jM 兺 j xCsF NzxRbFxCsF j=0 Wⴱ
共58兲 ¯ is obtained from Eqs. 共15兲, 共16兲, 共46兲, and 共47兲 and where W computed numerically together with the solution of the Guggenheim model. This is in fact the definition of the Cowley order parameter for the first coordination sphere.28 If the solution is completely disordered then = 0. If ⬍ 0 the solution shows a trend to intermediate compound formation. If ⬎ 0 the trend is toward segregation or phase separation. Here is a function of T and xCsF and it also depends on the xs,⬁ xs,⬁ SAM parameters បCs , បRb , and SRO. In Fig. 4 we plot xs,⬁ xs,⬁ versus SRO for several values of xRbF while បCs , បRb , and T remain fixed at the same values as for Fig. 3. The figure shows that SRO is in good qualitative agreement with the more standard Cowley definition and that it has the same order of magnitude. A plot of versus SRO for a different temperature would also yield an almost linear dependence, only with a different slope. It is interesting to note that SRO is explicitly based on correlations in the first coordination sphere whereas only reflects the average surroundings, and this difference appears most strikingly in highly diluted solutions where becomes worthless since “at first order” such a solution is always completely disordered. Besides, the fact that and SRO are so closely linked is due to the shape functions we chose for the surrounding atom energies 关Eqs. 共9兲 and 共10兲兴, whereas with arbitrary U j and Vi there would not necessarily be such similarity between them.29 The big merit of SRO is that it provides us with a clear and simple physical interpretation for the third parameter of the SAM, whereas the Guggenheim model, and therefore W or as well, has no analytical solution in the general case.
冉
Vdisp = − 兺 共1 − f 6共bijrij兲兲 i⬍j
冊
C6,ij C8,ij , 6 + 共1 − f 8共bijrij兲兲 共rij兲 共rij兲8 共60兲
where C6,ij 共C8,ij兲 is the dipole-dipole 共dipole-quadrupole兲 dispersion coefficient, and 共1 − f n兲 are Tang–Toennies dispersion damping functions31 describing the short-range penetration correction to the asymptotic multipole expansion of dispersion32 关f n共0兲 = 1 and f n共⬁兲 = 0兴. These functions take the form n
f n共x兲 = e−x 兺
k=0
xk k!
共61兲
and the parameter bij represents the distance at which the correction begins to be taken into account. The third term of the interaction potential, the repulsion overlap component, is given by Vrep = 兺 Bije−aijrij .
共62兲
i⬍j
The polarization part of the potential includes chargedipole and dipole-dipole terms Vpol = − 兺 qi␣,j共1 − c ji f 4共bD,ijrij兲兲T␣共1兲 i,j
+ 兺 q j␣,i共1 − cij f 4共bD,ijrij兲兲T␣共1兲 i,j
共2兲 − 兺 ␣,i,jT␣ +兺 i,j
i
1 ជ i兩 2 . 兩 2␣i
共63兲
共2兲 are the charge-dipole and dipole-dipole Here T␣共1兲 and T␣ interaction tensors while ␣i is the polarizability of ion i. Again, Tang–Toennies functions are included to account for ជ i其i苸N is the short-range effects. The set of induced dipoles 兵 treated as 3N additional degrees of freedom of the system. The dipoles are determined at each time step by minimization of the total polarization energy and they depend on the positions of all the atoms at the corresponding time; therefore the polarization part of the potential is considered to be a many body term. All the parameters necessary to simulate RbF–CsF mixtures have been determined from a recently developed firstprinciples procedure.33,34 The pair parameters are summa-
Downloaded 08 Apr 2009 to 193.1.172.166. Redistribution subject to AIP license or copyright; see http://jcp.aip.org/jcp/copyright.jsp
134716-10
J. Chem. Phys. 130, 134716 共2009兲
Beneš et al. TABLE IV. Parameters of the interaction potential 共a.u.兲. Ion pair ij −
−
F –F F− – Rb+ F− – Cs+ Rb+ – Rb+ Rb+ – Cs+ Cs+ – Cs+
Bij
aij
C6,ij
C8,ij
bij
bD,ij
cij
c ji
282.3 150.96 151.12 1.0 5000.0 5000.0
2.444 1.961 1.874 5.0 3.0 3.0
15.0 0.001 10.95 0.001 0.001 8.0
150.0 0.001 109.5 0.001 0.001 80.0
1.9 1.9 1.9 1.9 1.9 1.9
1.0 1.822 1.930 1.0 1.0 1.0
0.0 3.463 3.391 0.0 0.0 0.0
0.0 ⫺0.440 0.485 0.0 0.0 0.0
rized in Table IV. The polarizabilities were, respectively, of 7.9, 8.4, and 14.8 a.u. for F−, Rb+, and Cs+ ions. The MD simulations were performed on 11 molten salt compositions ranging from pure RbF to pure CsF. All the corresponding simulation cells contained 432 ionic pairs. The mixtures were simulated in the NPT ensemble following the method described by Martyna et al.,35 with a pressure fixed at 0 GPa and a temperature of 1200 K. We chose a time step of 0.5 fs and after 100 ps of equilibration, production runs of 200 ps were conducted for each composition. Enthalpy of the systems was sampled each 50 fs during the production runs. This quantity was then averaged over the full simulation, and its composition dependence is displayed in Fig. 5. The error bars were determined by block averaging. We could then extract the enthalpy of mixing for each composition, which corresponds to the difference between the obtained enthalpy and the value corresponding to ideal mixing between the two components according to Eq. 共4兲. The variation of the enthalpy of mixing with composition is displayed in Fig. 6. It does not exceed 140 J mol−1, which is a very small value in this type of system. The error bars have the same amplitude as in Fig. 5, but because of the small quantities involved, they now have the same order of magnitude as the enthalpies of mixing themselves. As a comparison, in molten fluoride systems which involve the mixing of very different cations, such as Li+ and Cs+ cations, the excess enthalpy reaches a value of −3330 J mol−1, with a similar error bar 共and at the same temperature兲, as calculated within the frame of this study. This means that the RbF and CsF systems can be considered to mix almost ideally. The mixing properties in a liquid depend a lot on the
FIG. 5. Computed mean enthalpies for all the compositions.
structural properties of its various components.36,37 In pure molten salts, the first-shell structure of a given cation varies with its size and valence charge. Longer range structure is mainly understood on the basis of packing and Coulomb ordering. When adding a second component, this structure is broken to an extent which depends on the compatibility of the two materials. For example, one can distinguish the network formers such as BeF2 共Refs. 8 and 38兲 from the network breakers such as CsF. In the case of the RbF–CsF mixture, the two cations have some very similar first-shell structures. In Fig. 7, we have plotted the Rb–F, Cs–F, and F–F radial distribution functions for three different compositions. First, it appears that the first maxima of the cationanion functions correspond to distances of, respectively, 2.6 and 2.7 Å for Rb+ and Cs+. Second, all the radial distribution functions change only slightly upon mixing, which means that all the species have similar environments in the pure liquids and in the mixture. This is of course consistent with the variations obtained for the enthalpies of mixing, and it confirms the nearly ideal behavior of the mixture. V. THERMODYNAMIC ASSESSMENT OF THE RbF–CsF PHASE DIAGRAM
As described above, two models, the BW and the Guggenheim models, have been used to interpret the DFT data relative to the solid solution. In order to simplify and to keep a compatibility with our developed database,2 the results from these models have not been directly used for the assessment of the RbF–CsF phase diagram. For the excess
FIG. 6. 共䊏兲 Enthalpy of mixing and their error bars for all considered compositions calculated for T = 1200 K. 共Solid line兲 Fit using the modified quasichemical model 共Sec. V兲.
Downloaded 08 Apr 2009 to 193.1.172.166. Redistribution subject to AIP license or copyright; see http://jcp.aip.org/jcp/copyright.jsp
134716-11
J. Chem. Phys. 130, 134716 共2009兲
Investigation of the RbF–CsF phase diagram
冉
xs Gm,Gug = xRbF共1 − xRbF兲 5423 −
544 000 T共K兲
2 + xRbF 共1 − xRbF兲1500 J mol−1 .
冊 共66兲
For a description of the excess Gibbs energy of the 共Rb,Cs兲F liquid solution a modified quasichemical model based on the quadruplet approximations proposed by Pelton and co-workers39,40 which is well suited for ionic liquids has been used. The optimization of the excess parameters was based on the results of the MD study 共see Sec. IV兲 which suggested slight positive excess enthalpy and little or no excess entropy. We choose to describe the excess Gibbs energy of the 共Rb,Cs兲F liquid solution by a single, temperature independent parameter, optimized in this study to the value 共67兲
⌬gRbCs/FF = 188.3 J mol−1 .
FIG. 7. Radial distribution functions for the xCsF = 0.0, 0.5, and 1.0 compositions.
Gibbs energy description of the 共Rb,Cs兲F solid solution the classical polynomial formalism generally defined as
The same notation as proposed by Chartrand and Pelton41 is kept here. A comparison between the mixing enthalpy obtained from the MD study and the calculated data based on our thermodynamic assessment are given in Fig. 6 and show an excellent agreement. The ⌬gRbCs/FF term which is the matter of optimization when using the modified quasichemical model is in fact equal to the Gibbs energy difference of the exchange reaction of the Rb and Cs atoms on the cation sublattice as shown by 共Rb – F – Rb兲 + 共Cs – F – Cs兲 ↔ 2共Rb – F – Cs兲
n
xs
G =
兺
⌬gRbCs/FF .
共68兲
共64兲
xi1x2j Lij
i,j=1
has been used, where Lij are the parameters to be optimized and are written in a polynomial form. In the case of the BW results the expression is exact and the Lij coefficients were obtained analytically according to Eqs. 共28兲–共30兲 using the ␣2, 1, and 2 parameters from Eqs. 共11兲–共13兲 and the corresponding excess Gibbs energy is xs = xRbF共1 − xRbF兲5413 Gm,BW 2 + xRbF 共1 − xRbF兲1162 J mol−1 .
共65兲
The excess Gibbs energy function based on the Guggenheim model was obtained by the least squares fit of its results and the final equation, valid for the temperature range 300–1200 K, is given below
Hence it is related to the short-range ordering of the 共Rb,Cs兲F liquid solution. In other words only when ⌬gRbCs/FF = 0 is the solution characterized by a random mixing and the configurational entropy is equal to the ideal mixing term 共−xRbFR ln xRbF − xCsFR ln xCsF兲. Any nonzero value always results into ordering of the solution. However, since the ⌬gRbCs/FF value obtained in our study is very small 关see Eq. 共67兲兴 the “ordering” effect is negligible and the configurational entropy is close to ideal. For example, the calculated mixing entropy at xRbF = 0.5 and T = 1000 K deviates from the ideal behavior only by 0.0003 J mol−1 K−1. Furthermore the modified quasichemical model requires the definition of the coordination numbers of the Rb and Cs atoms in the unary and binary interactions. They were taken from our previous study3 and are set to Rb Cs Rb Cs ZRbRb = ZCsCs = ZRbCs = ZRbCs = 6. The thermodynamic data of the solid and liquid phases
TABLE V. Gibbs energy equations of the solid and liquid phases of the pure RbF and CsF compounds. Coefficients are in J mol−1. All data are valid for temperature range 298–2000 K. Phase RbF 共s兲 RbF 共l兲 CsF 共s兲 CsF 共l兲
a
bT
cT ln T
dT2
eT−1
⫺573 639 ⫺563 539 ⫺569 439 ⫺565 798
213.919 390.427 230.509 405.400
⫺42.343 ⫺71 ⫺46.811 ⫺74.057
−1.3012⫻ 10−02 ¯ −8.7950⫻ 10−03 ¯
23 450 ¯ 4 111 ¯
Downloaded 08 Apr 2009 to 193.1.172.166. Redistribution subject to AIP license or copyright; see http://jcp.aip.org/jcp/copyright.jsp
134716-12
J. Chem. Phys. 130, 134716 共2009兲
Beneš et al.
FIG. 8. RbF–CsF phase diagram assessed using the BW model 共solid lines兲 and comparison to the solidus and liquidus data measured in this study by DSC. 共쎲兲 Solidus data determined from the heating run; 共䊊兲 liquidus data determined from the cooling curves.
FIG. 9. RbF–CsF phase diagram assessed using the Guggenheim model 共solid lines兲 and comparison to the solidus and liquidus data measured in this study by DSC. 共쎲兲 Solidus data determined from the heating run; 共䊊兲 liquidus data determined from the cooling curves.
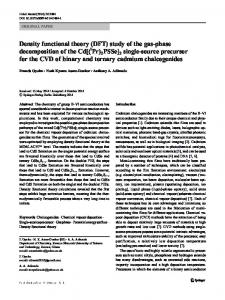
of pure RbF were taken from JANAF tables42 as well as the data for the solid phase of CsF. However, the data of the CsF liquid phase had to be modified in order to reproduce its melting temperature, T = 961 K 共compared to 975 K according to Ref. 42兲, measured in this study. The Gibbs energies of all four phases as a function of temperature G共T兲 = a + bT + cT ln T + dT2 + eT−1 are given in Table V. The RbF–CsF phase diagrams have been calculated by minimization of the Gibbs energy with respect to the proportion of the solid and liquid phases. This procedure yields the solidus and liquidus curves and it is carried out using the 43 FACTSAGE software. The resulting phase diagram based on the BW approximation is shown in Fig. 8 and that based on the Guggenheim approximation is shown in Fig. 9. Both phase diagrams are characterized by a minimum on the liquidus curve found at similar temperatures and compositions. In the case of the BW approximation the minimum is at T = 947 K and xRbF = 0.274, whereas with the Guggenheim approximation it is located at T = 951 K and xRbF = 0.250. However, from a comparison of both figures it is evident that in the case of the BW approximation a miscibility gap with a critical temperature T = 368 K at xRbF = 0.575 appears, whereas in the case of the Guggenheim model no immiscible region in the solid state has been found. This is due to the fact that in the former case the excess Gibbs energy is assumed to be temperature independent and thus has always the same value for a given composition. Consequently at low temperatures where the ideal mixing term 共xRbFRT ln xRbF + xCsFRT ln xCsF兲 has relatively small influence, the positive excess term is dominant and phase separation occurs. This is not the case with the Guggenheim approximation which does evolve with temperature. Hence the positive excess parameters are small at low temperatures while they increase with increasing temperature and reproduce nearly the same minimum on the liquidus curve as found from the assessment based on the BW model. Due to the lack of experimental data at low temperature it is very difficult to judge which phase diagram is closer to reality; however, since the Rb+ and Cs+ cations are highly ionic and their sizes are very similar it is not expected that a
miscibility gap would appear in the solid state. Thus the phase diagram optimized based on the data of the Guggenheim approximation as shown in Fig. 9 is to be preferred. VI. CONCLUSIONS
The RbF–CsF pseudobinary phase diagram we have measured using DSC is in very good agreement with the one we have calculated using our multiscale approach involving exclusively, for the smaller scale of description, DFT. The calculated excess enthalpy reveals an almost ideal behavior of the liquid phase whereas a small but significant positive excess enthalpy occurs in the solid phase. This is a common feature in systems with extended solubilities and it illustrates the similarity of the end members. As for the solid solution the calculation reveals that some short-range order is present, quantified by the difference between the zero-order BW and the first order Guggenheim approximations, and that its neglect would lead to the appearance of a miscibility gap in the solid phase below 367 K in the calculated phase diagram. Beyond this would-be miscibility gap, which is not amenable to experimental confirmation, the short-range order does not have any significant influence on the melting transition curves. From a more fundamental point of view we have demonstrated the applicability of a DFT-based approach to calculate the relatively small excess free energies that determine the phase diagram of a pseudobinary fluoride system. The SAM proves to be both flexible enough to accommodate the subtlety of interactions in the solid phase and quite efficient in terms of the amount of input DFT data it requires. According to the literature the SAM has been used extensively in the past to rationalize measured macroscopic thermodynamic data. We show here that SAM and DFT make up an ideal combination since they are both based on configurational energies—which are not accessible experimentally. As for DFT-based MD with polarizable ions, the technique used here had already been validated in several instances and the present work shows that it has become a routine and reliable technique.
Downloaded 08 Apr 2009 to 193.1.172.166. Redistribution subject to AIP license or copyright; see http://jcp.aip.org/jcp/copyright.jsp
134716-13
ACKNOWLEDGMENTS
O.B. acknowledges the European Commission for support given in the frame of the program “Training and Mobility of Researchers.” The ACTINET network for actinide sciences, supported by the European Commission in the 6th Framework Programme 共Contract No. FP6-508836兲, is thanked for the fellowship provided in order to perform this study 共JRP 06-020兲. M.S. acknowledges financial support of PCR-RSF 共Programme concerté de recherches—Réacteur à sels fondus兲. 1
J. Chem. Phys. 130, 134716 共2009兲
Investigation of the RbF–CsF phase diagram
A. L. Zherebtsov and V. V. Ignatiev, “Experimental mock-up of accelerator-based facility for transmutation of radioactive waste and conversion of military plutonium,” Russsian Research Center Technical Report No. 1606, 2006兲. 2 O. Beneš and R. J. M. Konings, J. Nucl. Mater. 377, 449 共2008兲. 3 O. Beneš and R. J. M. Konings, CALPHAD: Comput. Coupling Phase Diagrams Thermochem. 32, 121 共2008兲. 4 R. M. Martin, Electronic Structure Basic Theory and Practical Methods 共Cambridge University Press, Cambridge, 2004兲. 5 J. C. Mathieu, F. Durand, and E. Bonnier, J. Chim. Phys. Phys.-Chim. Biol. 62, 1289 共1965兲. 6 W. L. Bragg and E. J. Williams, Proc. R. Soc. London, Ser. A 145, 699 共1934兲. 7 E. A. Guggenheim, Mixtures 共Clarendon, Oxford, 1952兲. 8 M. Salanne, C. Simon, P. Turq, R. J. Heaton, and P. A. Madden, J. Phys. Chem. B 110, 11461 共2006兲. 9 M. Salanne, C. Simon, P. Turq, and P. A. Madden, J. Phys. Chem. B 112, 1177 共2008兲. 10 M. Salanne, C. Simon, P. Turq, and P. A. Madden, J. Fluorine Chem. 130, 38 共2009兲. 11 R. G. Samuseva and V. E. Plyushchev, Russ. J. Inorg. Chem. 10, 688 共1965兲. 12 O. Beneš, R. J. M. Konings, “A DSC study of the KNO3-NaNO3 system using a new encapsulation technique,” Thermochimica Acta 共submitted兲. 13 S. J. Clark, M. D. Segall, C. J. Pickard, P. J. Hasnip, M. J. Probert, K. Refson, and M. C. Payne, Z. Kristallogr. 220, 567 共2005兲. 14 J. P. Perdew, K. Burke, and M. Ernzerhof, Phys. Rev. Lett. 77, 3865 共1996兲. 15 H. J. Monkhorst and J. O. Pack, Phys. Rev. B 13, 5188 共1976兲. 16 MATERIALS STUDIO v. 4.3, Accelrys Software Inc. 共http:// www.accelrys.com兲. 17 CYGWIN, a Linux-like environment for Windows 共see http:// www.cygwin.com兲. 18 D. Vanderbilt, Phys. Rev. B 41, 7892 共1990兲. 19 J. D. Cox, D. D. Wagman, and V. A. Medvedev, CODATA Key Values for Thermodynamics 共Hemisphere, New York, 1989兲. 20 Inorganic Crystal Structure Database 共ICSD兲, Fachinformationszentrum 共FIZ兲, Karlsruhe. 21 V. Milman, B. Winkler, J. A. White, C. J. Pickard, M. C. Payne, E. V. Akhmatskaya, and R. H. Nobes, Int. J. Quantum Chem. 77, 895 共2000兲.
22
J. C. Mathieu, F. Durand, and E. Bonnier, J. Chim. Phys. Phys.-Chim. Biol. 62, 1297 共1965兲. 23 It can be shown that the configurational energies are only sensitive to the sum ␣1 + 1. We may thus arbitrarily set ␣1 = 0 but we keep it in the algebraic formulas to preserve the symmetry. 24 The proof in Ref. 5 is a bit difficult to follow but can also be obtained simply as follows. Considering ¯a in Eq. 共38兲 as an independent 共set of兲 variable共s兲 and writing down formally the differential of F in variables ¯a and T, it is easy to recognize that due to the Guggenheim approximation ¯ in dF includes the logarithm of leading to Eq. 共36兲 the term 共F / ¯a兲da the left side of Eq. 共35兲, so that this part of the differential vanishes identically. Therefore the entropy S = −F / T can indeed be computed from Eq. 共38兲 as if ¯a did not depend on T. 25 The polynomial denoted S共兲 by Mathieu et al. 共see Ref. 5兲 is denoted here by Z共兲 to avoid confusion with entropy. 26 SCILAB, an open source platform for numerical computation 共see http:// www.scilab.org兲. 27 As an example, let us consider a configuration with NRb = NCs and M 12 = NRb. Then on the model side Eqs. 共14兲 and 共15兲 are compatible with P12 = NCs, but on the other side reality is not: Some Cs cations, due to the fact that they are near neighbors of an Rb cation fully surrounded by Cs, have at least three Cs near neighbors—which implies P3 ⫽ 0. This leads to the contradiction P3 + P12 ⬎ NCs. 28 J. M. Cowley, Phys. Rev. 138, A1384 共1965兲. 29 When SRO= 0, i.e., 2 = 0, there remains a slight short-range order according to . The explanation of this paradox is that ␣2 is then slightly different from zero and in fact both ␣2 and 2 play a role in short-range order. ␣2 and 2 would cancel simultaneously only if the solution was symmetric but this is not quite the case here, and on the other hand if there was a large difference between ␣2 and 2 we would even have to change the definition of SRO to reliably account for the short-range order. 30 P. A. Madden and M. Wilson, Chem. Soc. Rev. 25, 339 共1996兲. 31 K. T. Tang and J. P. Toennies, J. Chem. Phys. 80, 3726 共1984兲. 32 A. J. Stone, Theory of Intermolecular Forces 共Oxford University Press, Oxford, 1996兲. 33 A. Aguado, L. Bernasconi, S. Jahn, and P. A. Madden, Faraday Discuss. 124, 171 共2003兲. 34 R. J. Heaton, R. Brookes, P. A. Madden, M. Salanne, C. Simon, and P. Turq, J. Phys. Chem. B 110, 11454 共2006兲. 35 G. J. Martyna, D. Tobias, and M. L. Klein, J. Chem. Phys. 101, 4177 共1994兲. 36 J. Kieffer and C. A. Angell, J. Chem. Phys. 90, 4982 共1989兲. 37 M. Salanne, C. Simon, P. Turq, and P. A. Madden, J. Phys.: Condens. Matter 20, 332101 共2008兲. 38 M. Salanne, C. Simon, P. Turq, and P. A. Madden, J. Phys. Chem. B 111, 4678 共2007兲. 39 A. D. Pelton, P. Chartrand, and G. Eriksson, Metall. Mater. Trans. A 32, 1409 共2001兲. 40 P. Chartrand and A. D. Pelton, Metall. Mater. Trans. A 32, 1397 共2001兲. 41 P. Chartrand and A. D. Pelton, Metall. Mater. Trans. A 32, 1385 共2001兲. 42 M. W. Chase, Jr., J. Phys. Chem. Ref. Data Monogr. 9, 1 共1998兲. 43 FACTSAGE 5.3, software for thermochemical calculations 共see http:// www.factsage.com兲.
Downloaded 08 Apr 2009 to 193.1.172.166. Redistribution subject to AIP license or copyright; see http://jcp.aip.org/jcp/copyright.jsp