Depicting urban boundaries from a mobility network of spatial interactions: A case study of Great Britain with geo-located Twitter data Junjun Yin1, 2, 3, Aiman Soliman1,2, 4, Dandong Yin1, 2, 3 and Shaowen Wang1, 2, 3, 4, * 1. CyberGIS Center for Advanced Digital and Spatial Studies 2. CyberInfrastructure and Geospatial Information Laboratory 3. Department of Geography and Geographic Information Science 4. National Center for Supercomputing Applications University of Illinois at Urbana-Champaign, IL, 61801, USA * To whom correspondence should be addressed. Email:
[email protected]
Abstract: Existing urban boundaries are usually defined by government agencies for administrative, economic, and political purposes. However, it is not clear whether the boundaries truly reflect human interactions with urban space in intraand inter-regional activities. Defining urban boundaries that consider socioeconomic relationships and citizen commute patterns is important for many aspects of urban and regional planning. In this paper, we describe a method to delineate urban boundaries based upon human interactions with physical space inferred from social media. Specifically, we depicted the urban boundaries of Great Britain using a mobility network of Twitter user spatial interactions, which was inferred from over 69 million geo-located tweets. We define the nonadministrative anthropographic boundaries in a hierarchical fashion based on different physical movement ranges of users derived from the collective mobility patterns of Twitter users in Great Britain. The results of strongly connected urban regions in the form of communities in the network space yield geographically cohesive, non-overlapping urban areas, which provide a clear delineation of the non-administrative anthropographic urban boundaries of Great Britain. The method was applied to both national (Great Britain) and municipal scales (the London metropolis). While our results corresponded well with the administrative boundaries, many unexpected and interesting boundaries were identified. Importantly, as the depicted urban boundaries exhibited a strong instance of spatial proximity, we employed a gravity model to understand the distance decay effects in shaping the delineated urban boundaries. The model explains how geographical distances found in the mobility patterns affect the interaction intensity among different non-administrative anthropographic urban areas, which provides new insights into human spatial interactions with urban space. Keywords: mobility pattern, urban boundary, spatial interaction, spatial network, community structure
Introduction Official urban boundaries are defined by government agencies for political and administrative purposes. Urban environments are conceptualized as spaces that are recreated and formed by human activities (Schliephake 2014). A fundamental question when using the administrative, “top-down”, approach to defining urban boundaries is
whether the outcome respects spatial interactions of humans. These interactions can take the form of trade, commerce, social connections, and political activities across borders. Urban boundaries that respect human interaction space are important to city planning, traffic management and resource allocation (Gao et al. 2014, Jiang and Miao 2015, Liu et al. 2015, Long et al. 2015). Many studies adopt a “bottom-up” approach to urban boundary delineation, where the geographical space is partitioned into small units and each unit is represented as a node within a network structure. A suitable community detection algorithm was applied to partition the network and associated geographical space based on the strength of human interactions between the nodes (Lancichinetti and Fortunato 2009). Different social and spatial human interactions were considered to establish the edges of the network connecting the nodes. For example, a large set of telephone call records were used to represent the network of human interactions across space to delineate urban boundaries in Great Britain (Ratti et al. 2010). Extending the previous method to different countries (Sobolevsky et al. 2013), the authors argued that this method yields cohesive geographical divisions following socio-economic boundaries. While other researchers use social ties of Twitter users to identify cohesive regions for different countries across the world (Kallus et al. 2015), they found evidence for dividing the urban space due to local conflicts and cross-country unifying trends that further support the “bottom-up” approach to mapping non-administrative anthropographic boundaries. A common finding from the aforementioned studies is that strongly connected urban regions in the form of communities in the network space yield geographically cohesive areas, despite different community detection methods and various forms of social and spatial human interactions were used. A general consensus is that those geographically cohesive areas are instances of the spatial proximity effects, where the
interaction strength between two urban regions decreases as the geographical distance between them increases (Fotheringham 1981). Spatial proximity is closely related to Tobler's First Law of Geography: “everything is related to everything else, but near things are more related than distant things” (Miller 2004). While it is intuitively logical, limited research has been carried out to quantitatively explain how the spatial interactions shape the forms of connected geographical areas (i.e., urban boundaries). One major reason is that while geographical distance may affect the interaction strength, it is not explicitly expressed in “virtual” human interactions, such as social ties or phone call initiation. In this study, we describe a novel approach to delineating non-administrative anthropographic urban boundaries from a mobility network of spatial interactions. Specifically, the spatial interactions refer to actual movements of Twitter users, which were derived from more than 69 million geo-located tweets. Geo-located Twitter data are proven to be a useful source for studying human mobility patterns at large geographical scales (e.g. the national level) (Hawelka et al. 2014, Cao et al. 2015, Jurdak et al. 2015). Our approach provides a novel view of non-administrative units based on physical commutes rather than social ties or phone call initiation. A unique advantage is that non-administrative anthropographic urban boundaries can be delineated in a hierarchical fashion based upon different ranges of physical movement, which are inferred from mobility patterns of Twitter users. We delineated the geography of urban boundaries in Great Britain by imposing a virtual fishnet over the islands of Great Britain. Twitter user movements were used to establish the connections between the fishnet cells to form a connectivity network, where each cell acts as a node within the network. We applied the map equation algorithm (De Domenico et al. 2015) to partition the network and associated geographic
regions. We found that the collective mobility patterns of Twitter users in Great Britain are divided into several distance ranges ranging from short, intra- to inter-city movements with clear distinction points. The identification of connected regions at each of these distance ranges yielded hierarchical boundaries of urban spaces in Great Britain. As the depicted urban boundaries exhibited an evident instance of spatial proximity, we employed a gravity model to understand the distance decay effects in shaping the delineated urban boundaries. The model explains how geographical distances found in the mobility patterns affect the interaction strength among different non-administrative anthropographic urban areas. Our study connects human mobility research with the delineation of non-administrative anthropographic urban boundaries based on Twitter user spatial interactions, and provides new insights into human spatial interactions with urban geographical structures.
2. Background and Related Work Urban regions are discrete components in a greater set of regions, with or without physical boundaries separating them (Jiang and Miao 2015). For political and administrative purposes, government agencies define various boundaries to partition urban space into spatial units at different scales, for instance: counties, census tracts and electoral districts. However, the spatial extents of these units often overlap and agglomerate depending how citizens perceive their activity space and interact with their urban environments (Lynch 1960). As connections are made between these units via various human activities, such as social-economic relations and commute patterns of citizens, certain units become more strongly connected than others. The boundaries of the agglomeration of these units are argued to reflect how people naturally interact with the geographical space, which is important for city planning (Hollenstein and Purves 2010), urban growth evaluations (Jiang and Miao 2015, Long et al. 2015), and traffic
management (Gao et al. 2014). Empirical studies have attempted to delineate such boundaries using a variety of methods and data. These methods can be generalized into two types: spatial clustering and network-based approaches. Spatial clustering approaches determine the boundaries based on the intensity of human activities anchored to geographic locations, for instance, locations of social media check-ins (Cranshaw et al. 2012, Sun et al. 2016), place descriptions from crowd-sourced Web content (Vasardani et al. 2013), and geotagged Flickr data (Stefanidis et al. 2013, Hu et al. 2015). While notable boundaries of urban areas were delineated, dynamic connections between different spatial units were not captured in spatial clustering approaches, where findings are discrete and independent areas reflect a high intensity of human activities. On the other hand, network-based approaches delineate urban boundaries based on the intensity of human interactions between different spatial units, where each spatial unit is represented as a node and an edge is modeled by human interactions between two nodes. Such human interactions can take physical or virtual forms, such as trade, commerce, social connections, and political activity across geographical borders. For example, social ties of Twitter users were used to identify cohesive regions for different countries across the world (Kallus et al. 2015). Another example is a map of Great Britain redrawn based the communication network of phone call initiations (Ratti et al. 2010). In contrast, physical interactions form connections between nodes by individuals physically relocating from one node to another, which is referred to as a mobility network of spatial interactions in this study. Many studies have attempted to extract mobility networks from various data sources, such as census migration data (Rae 2009), GPS traces of moving vehicles (Rinzivillo et al. 2012) and taxi trip records (Liu et al. 2015), mobile phone call data (Sobolevsky et al., 2013; Zhong et al., 2014), social
media check-ins (Liu et al. 2014), and geo-located Twitter data (Gao et al. 2014, Hawelka et al. 2014). These networks of human spatial interactions are then further explored to reveal clusters of interaction intensity, for example, using visual-analytics (Rae 2009) or community detection methods (Liu et al. 2015). Researchers argued that those geographically cohesive areas taking the form of communities in the network space are related to the distance decay effect, which implies the interaction strength between two urban regions decreases as geographical distance between them increases (Liu et al. 2014). However, limited research explored the linkages between such effects and the characteristics of the underlying spatial interactions, which is critical for explaining how spatial interactions affect the shapes of connected geographical areas (i.e., urban boundaries). While geographical distance is not explicitly expressed in “virtual” human interactions, we argue that seeking insights from the mobility network of spatial interactions with the characteristics of underlying mobility patterns can help to explain how distance decay effects affect interaction intensity and the form of depicted urban boundaries.
2.1. Large-scale mobility network from geo-located Twitter data To construct a large-scale mobility network of human spatial interactions, capturing human movements with fine-grained spatial and temporal granularity is desirable. Lowresolution mobility data collected from census records are estimated and aggregated at census tract level and do not necessarily reflect movements of the same individuals (Rae 2009). To collect detailed mobility data of individuals, using GPS trackers tends to produce the most accurate records of individuals’ movements, which means a high degree of recording accuracy of user locations and update frequency. However, the data often have limited spatial extent with a small group of people. For example, 182 and 226 volunteers participated in such mobility data collection in Zheng et al. (2008) and
Rhee et al. (2011), respectively. Other than tracking people directly, GPS data based on tracked vehicles (e.g. taxi) may only be accessible to a certain group of people (Kung et al., 2014). Another popular mobility data source found in literature is mobile phone call data in the form of Call Detail Records (CDR), where users’ locations are estimated by cell tower triangulation with accuracy in the order of kilometers (González et al. 2008, Kung et al. 2014, Zhong et al. 2014). Such a dataset can cover a relatively large spatial extent (e.g., national level) (Sobolevsky et al. 2013) and a large population sample (Kung et al. 2014). However, due to privacy concerns, the mobile phone call data are not publicly accessible, which is not ideal for achieving scientific reproducibility. On the other hand, it has become increasingly popular for researchers to exploit publicly accessible mobility data derived from Location-Based Social Media (LBSM) platforms (e.g., Foursquare and Twitter). However, there are limitations and challenges when directly extracting and using mobility data from LBSM data. For example, compared to GPS traces, the update frequency of an individual’s location varies depending on when a user is posting a new geo-located tweet or check-in at a new place. LBSM data have also been criticized for lacking population representativeness, as not all people use social media or send geo-located messages (Kung et al. 2014). Another research challenge is to identify social media users, as a social media account is not equivalent to a real person in the physical world. A number of studies have looked into the demographic aspect of LBSM data, in particular, Twitter data (Steiger et al. 2015, Luo et al. 2016). While their methods are diverse, these studies suggest stricter criteria for filtering and extracting individuals’ movements. In this research, geo-located Twitter data are chosen as the source for constructing large-scale mobility networks of human spatial interactions and investigating detailed mobility patterns. A geo-located tweet is a Twitter message with
an additional geo-tag expressed as a pair of geographical coordinates that represent the location of posting the tweet. Twitter provides a publicly accessible streaming API (http://dev.twitter.com/streaming) for open data access. The geo-located Twitter data present some unique advantages for our research. Specifically, the high-resolution location information enables researchers to identify multiple travel modes in user mobility patterns (Jurdak et al. 2015) while the large spatial coverage allows to compare mobility patterns (Hawelka et al. 2014) across many urban areas.
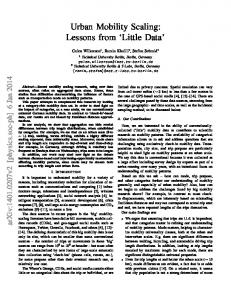
3. Materials and Methods 3.1. Geo-located Twitter Data and Data Processing For this study, data were collected using the Twitter Streaming API by specifying a geographical bounding box to retrieve all geo-located tweets that fall in the box. To ensure complete coverage of Great Britain, the bounding box covered the British Isles uses the lower left and upper right geographic coordinates (49.49, -14.85) and (61.18, 2.63) in the WGS84 datum. We implemented a data crawler to continuously collect data for seven months (June 1st – December 31st, 2014) resulting in over 101.8 million tweets with a total data volume of 60 GB. The data crawler managed to download all the geolocated tweets for the given bounding box, as it did not encounter any issue of exceeding the data quota by the 1% policy mentioned by Hawelka et al. (2014). To showcase the overall spatial coverage of the collected geo-located tweets, the locations of all the collected tweets are shown in Fig. 1. The collective point-based visualization reveals the geography of cities (Leetaru et al. 2013). Notice the clusters with higher densities of tweets correspond to the locations of major cities.
Figure 1. The spatial coverage of the collected geo-located Tweets for Great Britain (left) and London (right). Each point corresponds to an individual geo-located tweet. Note that Twitter activities are most active in urban areas.
The original location information embedded in every geo-tag includes both latitude and longitude coordinates. We examined “geo” attributes in each raw tweet and kept the one with location information derived from GPS recording rather than from geocoding. The points were projected into the British National Grid coordinate system to reduce the complexity in distance calculation. The geographical boundary of Great Britain was derived from the Office for National Statistics of UK (http://www.ons.gov.uk/ons) to further restrict the remaining tweets to be “domestic”. Based on these restrictions, the filtered dataset contained 69,847,497 tweets made by 1,153,891 Twitter users. To remove tweets from non-human users, the raw tweets were further filtered using the following steps. First, duplicated messages were removed. We
then removed non-human users based on unusual relocation by examining all of the consecutive locations of each user and excluded those with relocating speeds in excess of the threshold of 240 m/s, as suggested in Jurdak et al. (2015). Furthermore, to reflect the spatial interactions of residents rather than tourists, we imposed a condition that the time interval between a user’s first and last recorded tweets should be more than 30 days. In other words, a user is identified as a resident only if he/she has stayed in the study region more than 30 days. The filtered dataset for our analysis contains 60,209,778 tweets from 824,712 Twitter users. At this stage, each geo-located tweet is represented as a tuple !"#$_&', )*+, ,, - , where !"#$_&' is an anonymous Twitter user’s ID; )*+ is the recorded location of the tweet as a coordinate pair; , is the timestamp of the tweet; and - is the actual content of the tweet. We constructed a trajectory for each Twitter user by appending all the recorded locations (with the same !"#$_&') in chronological order based on the timestamps. To protect Twitter users’ privacy, the ID field was replaced with a randomly generated unique number and the message content was removed. The actual location of each geo-located tweet is only used for distance calculation and determining the geographical unit to which it belongs.
3.2. Mobility network of Twitter user spatial interactions A Twitter user’s movement is defined as the individual’s geographical relocation or displacement (González et al. 2008). This is not equivalent to a “trip” taken by an individual, because, displacement includes situations where the time interval between two consecutive recorded locations is more than several days. To identify clusters of urban regional connectedness, Twitter users’ movements are used to derive a connectivity network, where two urban regions connect when at least one user’s
movement begins in one and ends in another. These connections can be represented by an origin-destination (OD) matrix based on collective Twitter user displacements. This OD matrix is essentially a mathematical representation of a weighted directed graph / ≡ ⟨2, 34 ⟩, where 2 is a set of spatial nodes corresponding to the underlying urban regions, 34 is a set of edges each representing the connection between a pair of nodes, and the weights are assigned by the accumulated volume of Twitter users’ movements. To build a spatial network at the national level, the basic units need to be determined to serve as spatial nodes of the connectivity network. Previous studies have suggested equidistant spatial tessellation to generate nodes, which uses Voronoi polygons for spatial partitioning (Rinzivillo et al. 2012, Zhong et al. 2014). One limitation of this tessellation approach is that it would decrease the spatial resolution of aggregated geo-located tweets, because Twitter users’ location information is derived from embedded GPS within mobile devices. Another approach is to partition the study area into a grid of spatial pixels (Ratti et al. 2010, Liu et al. 2015). However, the grid size could potentially cause biases due to the Modifiable Area Unit Problem (MAUP) (Openshaw 1984, Wong 2009). To compare our investigation with the findings from similar studies, and avoid subjectively deciding the cell size, we performed statistical analysis of Twitter user mobility patterns in Great Britain and measured the distribution of collective Twitter user displacements and the radius of gyrations of individuals (González et al. 2008, Jurdak et al. 2015). The radius of gyration is a metric to distinguish mobility patterns of individuals, which is defined by Eq. (1):
$6 =
8 9
9 10 T- (Fig. 3(c)). We found that the gravity model indicates a strong linear correlation between the observed versus the estimated interaction strength with xE = 0.89 and ; − {\)!# < 0.01. This confirms that the depicted urban areas are instances of spatial proximity effects, where the strength of
human (in this case, Twitter user) spatial interactions between two urban regions decreases as the geographic distance between them increases. The well-fitted gravity model provides support that the depicted urban areas are not just random artifacts but reflect how people naturally move across geographic regions. More importantly, since we have used a mobility network to delineate the boundaries, the distance decay effects are well related and explained by the distance decay parameters found in the underlying mobility patterns. To elaborate, the spatial interaction strength decreases along with the decay for the probability of longer distance Twitter user movements, and eventually stops at certain spatial extent, which leads to more geographically cohesive cluster of urban regions.
Figure 7. The observed interaction strength versus the estimated ones from the adopted gravity model with } = ~. Note that the β value is taken from the probability density function of radius of gyration when $6 > 10 T-. The red dash line indicates strong linear correlation between the estimated and observed interaction strength with x E = 0.89 and ; − {\)!# < 0.01.
Since we used different physical movement ranges of users in delineating the urban boundaries, the description length J(K) appeared to get larger when longer displacements were used, which corresponded to less and larger geographically cohesive, non-overlapping urban areas. We believed that different movement ranges of users changed the weights of this graph and affected the interaction strength between two fishnet cells. As the employed gravity model suggested that the interaction strength between two fishnet cells decreases as the geographical distance increases, the longer displacements were used, the larger J(K) were produced from the map equation algorithm.
5. Conclusion and Discussion This paper developed a novel method for delineating non-administrative anthropographic urban boundaries by constructing a mobility network of Twitter user spatial interactions. In contrast to administrative urban boundaries, our “bottom-up” approach constructed a virtual fishnet over the islands of Great Britain. Twitter users’ movements were used to establish a connectivity network of the fishnet cells. We applied the map equation algorithm to partition the network and associated geographical regions. The strongly connected communities within the network space yielded geographically cohesive, non-overlapping urban areas that provided a clear delineation of the urban boundaries in Great Britain. By performing a statistical analysis of the distribution of collective Twitter user displacements, we found multi-scale and multimodal urban movements that were divided into several distance ranges starting from short intra-city to inter-city movements with clear destination points. Identifying the connected regions at each of these distance ranges revealed hierarchical boundaries of the urban space in Great Britain.
Using Twitter users’ mobility to delineate non-administrative anthropographic boundaries enables urban representation at different mobility ranges inferred objectively from individual-based collective mobility patterns. Such urban boundaries capture physical commutes to reflect human spatial interactions in a geographical space. Importantly, as the depicted urban boundaries exhibit a strong instance of spatial proximity, we further employed a gravity model to connect human mobility research to understand the distance decay effects in shaping the delineated urban boundaries. This well-fitted gravity model explains how geographical distances found in the mobility patterns affect the interaction strength among different non-administrative anthropographic urban areas, gaining new insights into the interactions between human activities and urban geographic space. It is worth noting that constructing a mobility network of spatial interactions using geo-located tweets has some potential limitations. First, the geo-located Twitter data do not represent the entire population. As the demographic information of Twitter users cannot be precisely identified, the results of delineated urban boundaries may not reflect a complete real-world image based on actual human movements. Related studies have examined this representation limitation (Steiger et al. 2015, Huang and Wong 2016, Luo et al. 2016), which emphasized the importance of carefully interpreting findings based on appropriate contexts and questions as done by our research. Second, regarding the spatial sparseness of geo-located Twitter data (Steiger et al. 2015), the urban regions that do not have any, or limited, Twitter coverage could be missed. To investigate whether this limited the ability to capture the connections made through Twitter user movements between urban regions, we visualized the flows of Twitter user movements using the method suggested by Rae (2009) (see Supplement Materials section 1). The outcome showed that Twitter users’ movements in our research
connected most urban areas in Great Britain and clearly captured long and short distance movements, which was essential for investigating the connection strength between urban regions. Third, since the collective radius of gyration was used to determine the fishnet cell size, we examined the temporal stability of this parameter. The probability distributions of the radius of gyration for Twitter users in Great Britain are verified to be consistent across different monthly time spans (see Supplement Materials section 2), which indicates the desirable stability. As geo-located tweets are openly accessible, our method can be applied to other countries and regions. A major underpinning of the method is that geographical distance plays an important role in affecting human mobility patterns and the strength of human spatial interactions across urban space. The method can be considered to assist in understanding human spatial interactions from the mobility perspective, which is applicable based on detailed geo-located Twitter data in many countries, as well as future mobility datasets with location information of individuals and large spatial coverage.
Acknowledgements We would like to thank the three anonymous reviewers for their constructive comments that helped improve the paper. We are grateful for insightful inputs to the manuscript received from Austin Davis and Ben Liebersohn in the CyberInfrastructure and Geospatial Information Laboratory at the University of Illinois at Urbana-Champaign. This material is based in part upon work supported by the U.S. National Science Foundation (NSF) under grant numbers: 1047916 and 1443080. Any opinions, findings, and conclusions or recommendations expressed in this material are those of the authors and do not necessarily reflect the views of NSF. The computational work used the ROGER supercomputer, which is supported by NSF under grant number: 1429699.
References Brockmann, D., Hufnagel, L., and Geisel, T., 2006. The scaling laws of human travel. Nature, 439 (7075), 462–465.
Cao, G., Wang, S., Hwang, M., Padmanabhan, A., Zhang, Z., and Soltani, K., 2015. A scalable framework for spatiotemporal analysis of location-based social media data. Computers, Environment and Urban Systems, 51, 70–82. Coscia, M., Giannotti, F., and Pedreschi, D., 2011. A classification for community discovery methods in complex networks. Statistical Analysis and Data Mining, 4 (5), 512–546. Cranshaw, J., Schwartz, R., Hong, J.I., and Sadeh, N., 2012. The livehoods project: Utilizing social media to understand the dynamics of a city. In: International AAAI Conference on Weblogs and Social Media. 58. De Domenico, M., Lancichinetti, A., Arenas, A., and Rosvall, M., 2015. Identifying Modular Flows on Multilayer Networks Reveals Highly Overlapping Organization in Interconnected Systems. Physical Review X, 5 (1). Fotheringham, A.S., 1981. Spatial structure and distance-decay parameters. Annals of the Association of American Geographers, 71 (3), 425–436. Gao, S., Yang, J.A., Yan, B., Hu, Y., Janowicz, K., and McKenzie, G., 2014. Detecting Origin-Destination Mobility Flows From Geotagged Tweets in Greater Los Angeles Area. In: Eighth International Conference on Geographic Information Science (GIScience’14). González, M.C., Hidalgo, C.A., and Barabási, A.-L., 2008. Understanding individual human mobility patterns. Nature, 453 (7196), 779–82. Hawelka, B., Sitko, I., Beinat, E., Sobolevsky, S., Kazakopoulos, P., and Ratti, C., 2014. Geo-located Twitter as proxy for global mobility patterns. Cartography and Geographic Information Science, 41 (3), 260–271. Hollenstein, L. and Purves, R., 2010. Exploring place through user-generated content: Using Flickr tags to describe city cores. Journal of Spatial Information Science, (1), 21–48. Hu, Y., Gao, S., Janowicz, K., Yu, B., Li, W., and Prasad, S., 2015. Extracting and understanding urban areas of interest using geotagged photos. Computers, Environment and Urban Systems, 54, 240–254. Huang, Q. and Wong, D.W.S., 2016. Activity patterns, socioeconomic status and urban spatial structure: what can social media data tell us? International Journal of Geographical Information Science, 30 (9), 1873–1898. Jiang, B. and Miao, Y., 2015. The Evolution of Natural Cities from the Perspective of Location-Based Social Media. The Professional Geographer, 67 (2), 295–306. Jurdak, R., Zhao, K., Liu, J., AbouJaoude, M., Cameron, M., and Newth, D., 2015. Understanding Human Mobility from Twitter. PLoS ONE, 10 (7), e0131469. Kallus, Z., Barankai, N., Szüle, J., and Vattay, G., 2015. Spatial Fingerprints of Community Structure in Human Interaction Network for an Extensive Set of Large-Scale Regions. PLoS ONE, 10, 5. Kung, K.S., Greco, K., Sobolevsky, S., and Ratti, C., 2014. Exploring universal patterns in human home-work commuting from mobile phone data. PLoS ONE, 9, 6. Lancichinetti, A. and Fortunato, S., 2009. Community detection algorithms: A comparative analysis. Physical Review E, 80 (5), 56117. Leetaru, K., Wang, S., Cao, G., Padmanabhan, A., and Shook, E., 2013. Mapping the global Twitter heartbeat: The geography of Twitter. First Monday, 18 (5). Liu, X., Gong, L., Gong, Y., and Liu, Y., 2015. Revealing travel patterns and city structure with taxi trip data. Journal of Transport Geography, 43, 78–90. Liu, Y., Sui, Z., Kang, C., and Gao, Y., 2014. Uncovering Patterns of Inter-Urban Trip and Spatial Interaction from Social Media Check-In Data. PLoS ONE, 9 (1), e86026.
Long, Y., Han, H., Tu, Y., and Shu, X., 2015. Evaluating the effectiveness of urban growth boundaries using human mobility and activity records. Cities, 46, 76–84. Luo, F., Cao, G., Mulligan, K., and Li, X., 2016. Explore spatiotemporal and demographic characteristics of human mobility via Twitter: A case study of Chicago. Applied Geography, 70, 11–25. Lynch, K., 1960. The image of the city. MIT press. Miller, H.J., 2004. Tobler’s first law and spatial analysis. Annals of the Association of American Geographers, 94 (2), 284–289. Openshaw, S., 1984. The modifiable areal unit problem. Geo Abstracts University of East Anglia. Rae, A., 2009. From spatial interaction data to spatial interaction information? Geovisualisation and spatial structures of migration from the, 33 (3), 161–178. Ratti, C., Sobolevsky, S., Calabrese, F., Andris, C., Reades, J., Martino, M., Claxton, R., and Strogatz, S.H., 2010. Redrawing the Map of Great Britain from a Network of Human Interactions. PLoS ONE, 5 (12), e14248. Reynolds, A., 2012. Truncated levy walks are expected beyond the scale of data collection when correlated random walks embody observed movement patterns. Journal of The Royal Society Interface, 9 (68), 528–534. Rhee, I., Shin, M., Hong, S., Lee, K., Kim, S.J., and Chong, S., 2011. On the levy-walk nature of human mobility. IEEE/ACM transactions on networking (TON), 19 (3), 630–643. Rinzivillo, S., Mainardi, S., Pezzoni, F., Coscia, M., Pedreschi, D., and Giannotti, F., 2012. Discovering the Geographical Borders of Human Mobility. KI Künstliche Intelligenz, 26 (3), 253–260. Rosvall, M., Axelsson, D., and Bergstrom, C.T., 2010. The map equation. The European Physical Journal Special Topics, 178 (1), 13–23. Schliephake, C., 2014. Urban Ecologies: City Space, Material Agency, and Environmental Politics in Contemporary Culture. Lexington Books. Simini, F., González, M.C., Maritan, A., and Barabási, A.-L., 2012. A universal model for mobility and migration patterns. Nature, 484 (7392), 96–100. Sobolevsky, S., Szell, M., Campari, R., Couronné, T., Smoreda, Z., and Ratti, C., 2013. Delineating Geographical Regions with Networks of Human Interactions in an Extensive Set of Countries. PLoS ONE, 8, 12. Stefanidis, A., Cotnoir, A., Croitoru, A., Crooks, A., Rice, M., and Radzikowski, J., 2013. Demarcating new boundaries: mapping virtual polycentric communities through social media content. Cartography and Geographic Information Science, 40 (2), 116–129. Steiger, E., Westerholt, R., Resch, B., and Zipf, A., 2015. Twitter as an indicator for whereabouts of people? Correlating twitter with uk census data, 54, 255–265. Sun, Y., Fan, H., Li, M., and Zipf, A., 2016. Identifying the city center using human travel flows generated from location-based social networking data. Environment and Planning B: Planning and Design, 43 (3), 480–498. Vasardani, M., Winter, S., and Richter, K.-F., 2013. Locating place names from place descriptions. International Journal of Geographical Information Science, 27 (12), 2509–2532. Wong, D., 2009. The modifiable areal unit problem (MAUP). SAGE Publications: London, UK. Zhao, Z., Shaw, S.-L., Xu, Y., Lu, F., Chen, J., and Yin, L., 2016. Understanding the bias of call detail records in human mobility research. International Journal of Geographical Information Science, 30 (9), 1738–1762.
Zheng, Y., Li, Q., Chen, Y., Xie, X., and Ma, W.Y., 2008. Understanding mobility based on GPS data. In: the 10th international conference on Ubiquitous computing. ACM. 312–321. Zhong, C., Arisona, S.M., Huang, X., Batty, M., and Schmitt, G., 2014. Detecting the dynamics of urban structure through spatial network analysis. International Journal of Geographical Information Science, 28 (11), 2178–2199.
Supplement Materials 1. Visualization of movement flux of Twitter users across Great Britain In this study, our method relied on extracting Twitter user displacements/movements to build the mobility network of Twitter user spatial interactions across the Great Britain. To investigate the spatial coverage of the extracted Twitter user movements, we employed the visual-analytics method developed in (Rae 2009), where we plotted a flow map of the Twitter user displacements at the national level in Figure 1. In this figure, each yellow line represented one displacement/movement from a particular Twitter user. To achieve better visualization effects, this figure did not simply plot all the movements at once but highlighted those urban areas based on the density of movement flux. This visualization showed that the extracted Twitter user movements connected most urban areas in Great Britain and clearly exhibited long and short distance movements for connecting urban regions at different spatial scale, which was essential for building the mobility network.
Figure 1: Visualization of the Twitter user movement flows across the Great Britain
2. Radius of gyration of Twitter users in Great Britain The measurement of collective radius of gyration for individual Twitter users in the Great Britain was important for choosing the cell-size of the virtual fishnet. As the collected geo-located Twitter data in this study was from June 1st to December 31st, 2014, to investigate whether there were temporal fluctuations that would affect the consistency of such a measurement, we summarized the probability distribution of the radius of gyration for Twitter users in the Great Britain with a monthly interval. Figure 2 showed that the probability distributions of the radius of gyration for Twitter users were consistent throughout the 7month time span, which indicated the stability of using such measurements in this study. Note that in these calculations, we did not apply the criteria to filter out “tourists” as we had suggested in this study.
Figure 2: The probability distribution of the radius of gyration for Twitter users in each month
3. Mobility network based on ward divisions of the Great Britain We imposed a virtual fishnet to partitioning the geographical space in the Great Britain. Such partition does not consider the underlying population information in each fishnet cell, therefore, it is worth to compare an alternative approach that does consider population information when partitioning the geographical space. In this study, we also carried out an experiment to partition the geographical space using a ward division of the Great Britain, which is the finest/smallest administrative boundary at the national level. This choice of using finest administrative boundary was also considered to minimize the conflict that administrative boundaries may not reflect natural human spatial interactions across space. The strongly connected communities also yielded geographically cohesive, non-overlapping urban areas shown in Figure 3. The delineated urban boundaries were visually similar to the ones derived from using a fishnet approach. In particular, in the greater London region, the separate geographic areas that
include Heathrow Airport exhibited more connectivity to central London than its surrounding areas (light orange region in Figure 3 (c)). However, as ward division is geographically continuous, it is problematic in aggregating regions that do not have Twitter coverage into certain clusters. Aggregating Twitter user movements at the ward level imposed more apparent concerns of the mismatch of the overall population, as long as there was one Twitter user movement fell into the polygonal unit, the entire unit would be considered in the mobility network. In this case, less populated areas were overly represented and connected into large areas, in particular, the delineation in Scotland (green region in Figure 3 (b)).
4. Mobility network with different settings We chose a fishnet with 10 km cell-size to partition the geographical space of the Great Britain based on the statistical analysis of the probability distribution of the radius of gyration of Twitter users. Nevertheless, we also carried out an additional experiment by arbitrarily setting the fishnet cell-size to 5 km. The fishnet with smaller cell-size (i.e., 5 km) produced more and smaller strongly-connected communities within the network space as shown in Figure 4 (left). It suggested that the spatial resolution of the fishnet cells does affect the outcome from the community detection method employed in this study, where fishnet with smaller cell-size leads to more discrete and locally connected (i.e., smaller) clusters of urban areas. Such an effect can be explained by the probability distributions of the radius of gyrations of individual Twitter users. The probability of distance that deviates from a user's center location decays with a stretched-exponential function from [50m, 10km], which means the movements from Twitter users with smaller spatial coverage dominate the strength in connecting neighboring urban regions. Finally, we also illustrated that constructing the mobility network as an undirected graph did not lead to any meaningful delineation of the urban boundaries that reflect Twitter user spatial interactions, which is shown in Figure 4 (right).
(a)
(b)
(c) Figure 3: The community structure from collective Twitter user displacements based on the ward division in the Great Britain. (a) The delineation for England and Wales (b) The delineation for Scotland (c) The delineation for the greater London region
Figure 4: The community structure from collective Twitter user displacements with fishnet cell-size set to 5 km (left); and the community structure when the mobility network configured as undirected graph with fishnet cell-size of 10 km (right).
Reference: Rae, A., 2009. From spatial interaction data to spatial interaction information? Geovisualisation and spatial structures of migration from the 2001 UK census. Computers, Environment and Urban Systems, 33(3), pp.161178.