2166
IEEE TRANSACTIONS ON GEOSCIENCE AND REMOTE SENSING, VOL. 51, NO. 4, APRIL 2013
Description and Validation of an Automated Objective Technique for Identification and Characterization of the Integrated Water Vapor Signature of Atmospheric Rivers Gary A. Wick, Paul J. Neiman, and F. Martin Ralph
Abstract—An automated, objective tool for identifying and characterizing the integrated water vapor (IWV) signature of atmospheric rivers (ARs) based on satellite-observed or modelderived IWV fields has been developed, demonstrated, and validated. ARs are narrow plumes of intense water vapor transport that have been found to be an important contributor to major flooding events in the western U.S. and to seasonal water supply. Previous results demonstrated that the associated IWV signature is an effective proxy for the ARs themselves and that signature is used in this work to characterize the features. The technique employs basic objective criteria for the length (> 2000 km), width (< 1000 km), and IWV content (> 2 cm) of the plumes and standard image processing techniques including thresholding and skeletonization to identify the ARs. Extracted characteristics for the identified plumes include their position, width, core IWV content, orientation, lifetime, and propagation speed. The performance of the AR detection tool (ARDT) was validated over five cool seasons by comparing the AR IWV signature identified by the tool with visually identified events from an existing landfalling AR climatology. The ARDT performed extremely well with a critical success index of 92.4% and a 98.5% probability of detection. Differences were largely the result of subjective decisions in visual classification and tradeoffs in the tool sensitivity between missing actual ARs and inclusion of non-AR features. Future improvements include refined computations of the length and width of AR features and extension of the technique to apply directly to measurements of the water vapor transport. Overall, the ARDT appears well suited for the development of extended AR climatologies and the comparison and verification of forecasts of ARs. Index Terms—Atmospheric river, automated detection, forecast verification, integrated water vapor, meteorology, pattern recognition, passive microwave remote sensing.
I. I NTRODUCTION
A
TMOSPHERIC rivers (ARs) are long, narrow, constantly evolving regions of intense water vapor transport within the lower atmosphere. The filamentary bands comprise a subset corridor within a broader region of generally poleward heat transport in the warm sector of extratropical cyclones [1], [2]. Manuscript received September 26, 2011; revised May 11, 2012; accepted June 29, 2012. Date of publication September 14, 2012; date of current version March 21, 2013. This work was supported by the National Oceanic and Atmospheric Administration under the THORPEX program and from the California Energy Commission through the CalWater Project. The authors are with the NOAA Earth System Research Laboratory, Physical Sciences Division, Boulder, CO 80305 USA (e-mail:
[email protected];
[email protected];
[email protected]). Color versions of one or more of the figures in this paper are available online at http://ieeexplore.ieee.org. Digital Object Identifier 10.1109/TGRS.2012.2211024
In a numerical modeling study, Zhu and Newell [3] found that ARs were responsible for more than 90% of the total horizontal water vapor flux in the midlatitudes while occupying less than 10% of the zonal circumference. When they make landfall, the events can be responsible for significant precipitation along the west coast of North America and in many other parts of the globe including the Atlantic Basin and Gulf Coast. Recent studies demonstrated that ARs are an important contributor to recent major winter flooding events both in California [4] and the Pacific Northwest [5], [6]. Neiman et al. [2] further showed that winter storms corresponding with AR conditions produced roughly twice as much precipitation along the west coast as all storms. The events contribute significantly to the seasonal water supply in the western U.S. [7], [8]. As a result, it is important to understand how well these events are predicted and represented in current numerical weather prediction (NWP) models and reanalysis products, both for characterizing the global water cycle and predicting extreme precipitation. ARs are formally identified and characterized using measures of the water vapor transport. While this is possible for model analysis and forecast products, current satellite sensors are unable to quantify the water vapor transport due largely to a lack of information on the vertical wind profile. To validate how well the models are able to replicate ARs, it is necessary to utilize fields common to both the models and observations. Through comparisons with aircraft observations, Ralph et al. [1] demonstrated that satellite-based observations of the vertically integrated water vapor (IWV) content could be successfully used as a proxy for the detection of ARs over the ocean and developed objective criteria for identifying events using IWV data. Regions with IWV > 2 cm, greater than 2000 km in length, and less than 1000 km in width were categorized as ARs. When referring to ARs in this current paper, it is this definition of the IWV signature that will be used rather than the formal definition based on water vapor transport from [3]. Using these criteria, Neiman et al. [2] derived a climatology of ARs making landfall along the west coast of North America between 1997 and 2005 through visual inspection of satellite-derived IWV retrievals. This climatology has since been extended to run through the winter of 2010–2011 and has proven instrumental in documenting the hydrologic impact of ARs in the west coast states [2], [5], [6], [8]. The work further validated the use of IWV data to detect ARs during the cool season through comparison with reanalysis data. The updated climatology through 2008 appears in [7].
U.S. Government work not protected by U.S. copyright.
WICK et al.: IDENTIFICATION AND CHARACTERIZATION OF WATER VAPOR SIGNATURE OF ATMOSPHERIC RIVERS
While the manual approach to AR identification has been highly successful for examining one geographic region (the northeastern Pacific) in a single satellite-based IWV product, extension of the analyses to additional regions, to the development of real-time hazard indicators, or to verification of ARs in forecasts from multiple weather or climate models (e.g., [9]) at numerous different lead times, would benefit from a more automated technique, particularly if moisture flux measurements can be included. Moreover, while the visual approach is based on simple objective criteria, it incorporates subjective choices that could potentially complicate verification studies. One such automated detection approach using thresholding and a connected component labeling procedure has been developed in parallel with our present approach by Byna et al. [10]. Their approach was found to accurately detect 92% of the landfalling AR events in the climatology in [7]. To our knowledge, other existing objective meteorological analysis packages have not yet demonstrated an ability to identify AR plumes with such a specific signature. For example, promising real-time tools such as the Method for Object-based Diagnostic Evaluation [11], [12] provided in the Model Evaluation Tools developed by the National Center for Atmospheric Research are able to identify objects such as regions of precipitation or high IWV, but are not currently able to distinguish the specific characteristic shapes of ARs from other general moisture anomalies. Beyond identifying ARs, automating the extraction of their key characteristics is also desirable. Important elements of assessing how well NWP models forecast the features include determining how accurately the models reproduce their intensity, width, and landfall location, as well as their frequency of occurrence. As forecasters rely heavily on the model guidance, a tool facilitating comparison of run-to-run forecasts of these AR characteristics would have potential operational benefits. Issuance of warnings of their potential to result in extreme precipitation also requires measurements of the AR’s intensity and propagation. Estimating the distribution of maximum IWV content in landfalling ARs in the Pacific Northwest presented in Neiman et al. [5] required time-consuming manual analysis of the IWV fields for each of the identified ARs. Manual extraction of the position, width, and intensity of AR plumes in multiple forecast models at multiple lead times would be almost prohibitive over any extended period. To address these needs, an automated, objective technique for identifying and characterizing the IWV signature of ARs in products derived from either observations or NWP models was developed. This paper describes the technique, illustrates its application, and validates its performance against previous visual identifications of ARs. The functionality of the technique, description of its outputs, and illustration of its application are presented in Section II. The accuracy of the procedure is then validated against the landfalling AR climatology of Neiman et al. [2] as updated in [7] in Section III. Potential future refinements of the technique are discussed in Section IV followed by the summary and conclusions. II. D ESCRIPTION OF THE T ECHNIQUE The objective, automated procedure for identifying and characterizing the IWV signature of ARs (the AR detection tool for IWV or ARDT-IWV) was designed initially to operate
2167
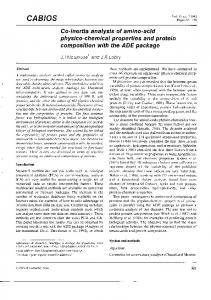
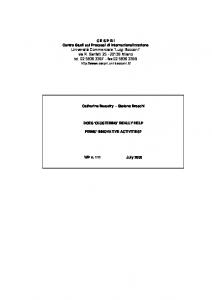
Fig. 1. Composite satellite-derived image of IWV constructed from Special Sensor Microwave Imager Sounder data obtained between 0000 and 1200 UTC on 15 January 2010. The image shows multiple water vapor plumes extending poleward into the midlatitudes corresponding to atmospheric rivers. Areas of missing data are shown in dark gray.
on fields of the IWV content obtained from either satellite observations or atmospheric models. This enables the technique to be fundamentally based on the criteria developed by Ralph et al. [1] and employed in the generation of the landfalling AR climatology by Neiman et al. [2]. Not only does this provide a sound basis for the identification of the events, it also facilitates validation of the performance of the ARDT-IWV as presented in Section III. This approach remains, however, a proxy for identification of ARs. For formal detection of the moisture transport associated with ARs, additional information on the vertical wind profile is required. Planned future refinements will extend the technique to identify ARs based on the moisture transport. At its most basic level, therefore, the ARDT-IWV is very simple. Its underlying function in identifying AR plumes is to isolate coherent regions of IWV content with the appropriate length (> 2000 km), width (< 1000 km), and magnitude (> 2 cm) criteria. The key challenge of the ARDT-IWV (or simply ARDT if not otherwise noted) is to automate what the eye does implicitly. The eye, in particular, is very good at assessing continuity of regions, handling small discontinuities in the data, and distinguishing regions that potentially satisfy the IWV criteria but are clearly not ARs. These steps are accomplished in the automated ARDT using a combination of well-established image processing techniques. The fundamental problem is highlighted in the example passive-microwave satellite-based IWV field shown in Fig. 1. In the northeastern Pacific the signature of an AR making landfall in western Washington is visible. This feature would be easily captured using the existing objective criteria. Moving further to the west, however, another water vapor plume characteristic of an AR is apparent. Occurring in a moister region, the core IWV content is large, and the width is sufficiently narrow only at IWV values in excess of 2 cm. Identification of this AR would require criteria beyond those in [1]; namely, distinguishing the core region from a broader IWV high. Further south along about 10◦ N, the intertropical convergence zone (ITCZ) also contains narrow extended extremely moist regions that could complicate analysis at larger IWV threshold values. Gaps in the satellite coverage are also visible. Though not in a critical region in this
2168
IEEE TRANSACTIONS ON GEOSCIENCE AND REMOTE SENSING, VOL. 51, NO. 4, APRIL 2013
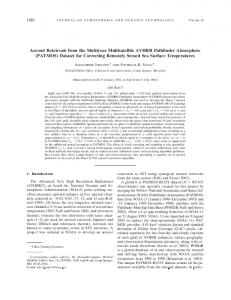
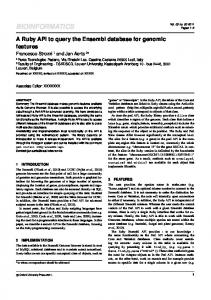
Fig. 2. Illustration of application of the ARDT to satellite-derived IWV observations from 7 November 2006. (a) Composite of retrieved IWV generated from SSM/I observations between 1200 and 2400 UTC. (b) First stage of processing (steps 1–5 in Fig. 3) showing IWV thresholded areas at 2.0, 2.33, 2.67, and 3.0 cm in grayscale, and positions with positive (red) and negative (blue) cross-AR IWV gradients exceeding the defined thresholds. The panel also shows the southernmost region excluded due to detection of the tropical water vapor reservoir. (c) Second stage of processing (steps 6–8 in Fig. 3) showing extracted skeletons (red), potential AR axis locations satisfying the width criteria (blue), and corresponding AR width estimates (green). (d) Final result showing the extracted axis location (blue) and multiple estimates of the AR edge. The red points correspond to 0.3679 times the difference between the peak and mean IWV values, while the orange, green, and purple correspond to thresholds of 2.67, 2.33, and 2.0 cm, respectively.
example, at other times, gaps between satellite swaths can occur in the middle of potential ARs. While application of the objective criteria is relatively straightforward for some of the highimpact cases presented in previous publications, on other days, the patterns are very complex, making automation challenging, but also emphasizing the need for fully objective procedures. To address one challenge in automating the technique, the definition of the IWV signature of ARs from Ralph et al. [1] was revisited and extended. Visual observation of large numbers of cases shows many events of significance where, as with the feature at about 180◦ W, 30◦ N in Fig. 1, a clear, narrow core region is apparent at IWV thresholds greater than 2 cm but within a broader region of IWV content in excess of 2 cm that is wider than 1000 km. To include these plumes and enable the tracking of AR signatures further into the central and western Pacific, the criteria were extended to include core regions at larger thresholds. For this study, plumes with regions less than 1000 km in width where the IWV content exceeded multiple thresholds between 2.0 and 4.0 cm over lengths in excess of 2000 km were identified as ARs. A. Processing Steps The ARDT applies a sequence of successive processing steps to the IWV fields being analyzed. All computations are performed on a geographic grid corresponding to the input IWV field. An equally spaced grid is assumed, so any model inputs on a Gaussian grid must first be mapped to a regular grid. The
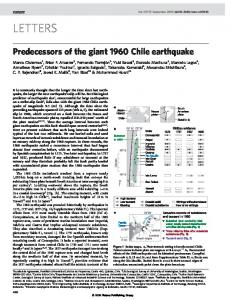
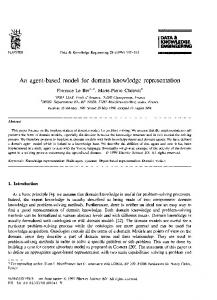
Fig. 3. Flow chart highlighting the fundamental processing steps of the AR tool.
overall flow of the procedure from initial input IWV field to final identified AR is illustrated with a sequence of images in Fig. 2, and Fig. 3 presents a flow chart highlighting the specific steps in the processing. The example application is for an AR in the northeastern Pacific off the west coast of the U.S. where the bulk of our previous AR analyses has been conducted. In this section, the general approach is described for each step first, followed by discussion of any specific parameters used in applications to date. The first preparatory step in the processing is to slightly smooth the input IWV fields to minimize measurement noise and remove small data voids. This is accomplished with a median filter. A box size of 175 km is currently used for satellite retrievals with a resolution of 25 km. Missing values are filled in through this process with the median of valid retrievals within the selected box. No attempt is made to interpolate across larger gaps. NWP model fields are inherently smoother, and no additional smoothing is needed. The next step is to identify and exclude the tropical regions with large background IWV contents. While connections between AR events and tropical water vapor are highly significant, ARs are primarily a component of extratropical weather systems. Since the technique is highly dependent on thresholding regions of enhanced water vapor, removing broad tropical moist regions not associated with the AR structure significantly simplifies the later processing steps. The boundary
WICK et al.: IDENTIFICATION AND CHARACTERIZATION OF WATER VAPOR SIGNATURE OF ATMOSPHERIC RIVERS
of the moist tropical region is found by determining the mean equator-most latitude for which the IWV content of the adjacent poleward region is consistently less than the 2-cm threshold. For application to the northern Pacific over the domain shown in Fig. 2, the computation is performed for the region from 120 to 150 W. The southernmost latitude for which the IWV in each of the 15 grid cells (375 km for 25-km resolution) to the north is less than 2 cm is determined along individual meridional grid lines and the values averaged. While this computational domain was not optimized, the approach provided good results. The impact of this step is visible in Fig. 2(b) where there is a clear line at about 18 N to the south of which no thresholded points are extracted. The foundational step in estimating the location and extent of potential ARs is to identify regions with IWV values in excess of thresholds at multiple levels. Thresholds of 2.0, 2.33, 2.67, and 3.0 cm were used in the initial application and validation of the ARDT. The thresholded regions are shown in Fig. 2(b) with different levels of grayscale shading. In later testing, additional thresholds of 3.33, 3.67, and 4.0 cm were also employed. This step addresses the fundamental criterion that an AR possesses a region with an IWV content in excess of 2 cm. The thresholded regions will, by one aspect of the definition of the IWV signature of an AR, encompass the extent of ARs but clearly can incorporate other features. Including higher IWV thresholds allows improved estimates of the AR core position. To help filter out poorly defined or amorphous regions particularly in areas with enhanced background moisture, we require that the regions of enhanced IWV content be bounded by sufficiently steep gradients in the IWV or have a highly linear shape to qualify as an AR. Observations show that the boundaries of actual ARs are marked by well-defined IWV gradients, helping to distinguish them from other areas with IWV contents in excess of 2 cm which can occur in the absence of AR conditions. A gradient is computed in directions normal to the preferred orientation of ARs in the selected region, and positions with positive or negative gradients in excess of an absolute threshold are noted. These points are indicated with the red and blue symbols in the example in Fig. 2(b). For the present application to the northern Pacific where ARs commonly have a southwest-northeast orientation, gradients are computed at 45◦ angles in both the southeast to northwest and northeast to southwest directions, and the largest magnitude values are retained. The magnitude of the gradient threshold varies slightly with the spatial resolution of the IWV field but is approximately equal to 1 cm/degree of latitude. The threshold value was obtained through visual experimentation with best distinguishing ARs and was selected to not be overly limiting. The regions thresholded by IWV are grouped into individual clusters of contiguous points, and each cluster is checked for adequate size and either the presence of sufficiently strong gradients or a linear correlation in excess of 0.4. If a cluster contains only a few points that would obviously not satisfy the length criteria for an AR based on the product resolution, the cluster is discarded. For a previously IWV thresholded region to continue to be considered as a potential AR, the region is required to have at least one positive and negative gradient value in excess of the gradient threshold. If a region exhibits a high linear correlation but does not satisfy the gradient criteria,
2169
it is also retained. While not critically required to ultimately distinguish ARs, this step helps increase the efficiency of the procedure. A critical parameter for characterizing any identified AR is the position of its axis. To obtain a first estimate of the axis of an AR feature, we employ the image processing technique of skeletonization (e.g., [13] and [14]). This technique reduces a shape to a single-pixel width spine equidistant to the boundaries. The skeleton is computed for each contiguous thresholded region (for all IWV thresholds) that satisfies the size and gradient requirements. In Fig. 2(c), the computed skeletons are indicated with red points plotted over the thresholded regions. The multiple red lines correspond to the overlapping regions at multiple IWV thresholds. For linear-type features, the skeletons can be seen to provide a good first approximation of the axis, at least away from the ends of the features. To further refine the axis and extent of potential ARs, we then loop through each identified skeleton point checking to see if the width criterion is satisfied along some segment passing through that location. At each point, we loop through angles of 180◦ at 15◦ steps to determine the minimum width of the feature relative to each of the IWV thresholds. If the minimum width in any direction for any of the thresholds is less than 1000 km, the corresponding transect is assumed to be normal to the axis of a possible AR, and a refined estimate of the axis location is taken as the geographic center point of that transect. The resulting refined axis estimates for our example are indicated with blue points in Fig. 2(c). Note how the computations for multiple distinct skeletons converge to a common refined axis. The geographic center of the transect is used rather than the IWV maximum to facilitate tests on continuity as described in the following paragraph. The primary remaining step is to determine if the potential axis points comprise a continuous feature over a sufficient length. Assessing continuity of the axis points is particularly challenging for observational fields with some level of noise and for transitions between axis locations defined based on different discrete IWV thresholds. To fill small gaps and allow for slight jumps that would break up otherwise continuous AR segments, the spatial extent of the potential axis points on the processing grid is enlarged slightly using the process of dilation (e.g., [13] and [14]). The selected degree of dilation represents a balance between filling small desired jumps while not joining separate features or introducing small “branches” off the main AR axis. The amount of dilation is controlled by the size and configuration of the structural element. The structural elements utilized in the initial testing and validation of the ARDT vary with the resolution of the input IWV field and are shown schematically in Fig. 4 for grid resolutions of 0.25, 0.5, and 1◦ . For each potential axis point, the structural element is centered on that grid cell, and the surrounding cells corresponding to a 1 in the structural element are also assumed to be potential axis points for the sake of continuity. The most relevant feature of the selected elements is the reduction in the amount of dilation at coarser resolution. Any directionality implicit in the structural element is not critical for this application as we are only addressing continuity. The dilated center points are then clustered into continuous segments, and segments greater than 2000 km in length are identified. The length is currently estimated as the maximum
2170
IEEE TRANSACTIONS ON GEOSCIENCE AND REMOTE SENSING, VOL. 51, NO. 4, APRIL 2013
Fig. 4. Structural elements for dilation of potential AR axis locations for inputs at: (a) 0.25◦ , (b) 0.5◦ , and (c) 1.0◦ spatial resolution. The shaded central pixel corresponds to the pixel in the input grid to which the element is applied.
linear distance between any three points along the segment. Using three points allows for a certain degree of curvature along the segments, but the full path length along a curved segment is not computed. A tightly curved AR with a total length near 2000 km could potentially not be identified. Future refinements of the technique will break the clusters down into additional segments to better estimate the total path length. The extracted segments correspond to the final number of detected AR features from the original field. To define the final AR position and extent, the axis and width are recomputed from the dilated center points as for the original points in the skeletons. The minimum-width normal segment relative to each of the IWV thresholds is again determined. If segments of less than 1000 km in length are found relative to more than one IWV threshold, the normal segment corresponding to the largest IWV threshold is taken to define the normal to the AR at that location. For this segment, the geographic center is taken as a revised estimate of the AR axis location. The location of the peak IWV value along the segment is also determined and stored as an alternate estimate of the axis location. Multiple estimates of the edge and width of the AR are also computed from this segment. Edges are defined on either side of the axis where the IWV first falls below each of the IWV thresholds and drops to 0.37 times (the e-folding scale) the difference between the peak and mean values along the segment. The AR width relative to each of those criteria is computed as the distance between the two edge points. For the example case, the final AR axis and edge estimates are shown in Fig. 2(d). The axis is indicated with blue points, and the various edge estimates are shown with the different colors. A final test is performed to determine whether each identified AR segment is making landfall. To determine if the AR extends up to any continental coastal boundary, the final AR axis points are dilated once again and the extended points checked to see if they overlap a coastal land mask. Most islands are excluded from this land mask to emphasize major land masses. A flag is set to indicate landfall status and facilitate analysis of those events. An additional flag is set if any potential AR segment was found to contact any gaps in the IWV fields, as these could result in the failure to identify actual events.
Fig. 5. Extracted estimates of the (a) core IWV content, and (b) AR width along the axis of AR detected in the example in Fig. 2. Width estimates are shown for multiple criteria as described in the legend. The properties are extracted in terms of an index position along the AR axis where the indexing begins at the southwest end of the AR.
B. Key Outputs The ARDT returns several different output parameters to characterize the identified AR plumes. The parameters were selected with a focus on enabling the evaluation and verification of NWP forecasts of ARs. The individual quantities can be divided into those obtained from the analysis of a single IWV field and those derived from analysis of several successive products. The primary outputs from individual IWV fields are the number of identified ARs and their location. The location is provided as a latitude/longitude listing of each extracted axis point. For each axis point, the estimated width (for each criteria), the core IWV value along the axis, and the peak IWV value across the corresponding normal segment are also returned. The extracted core IWV values and width estimates for the example case in Fig. 2 are shown plotted in Fig. 5 as a function of the index along the AR axis, where the index begins at the equatormost end of the segment. From the individual core IWV values and width estimates, average core IWV, and width estimates are computed both over the entire AR extent and for the 100 km closest to land in the case of landfall. The estimate of core strength in the vicinity of landfall is particularly valuable for ranking the intensity of events, as was explored in Neiman et al. [5]. An example of extracted distributions of the core IWV values and AR width near land for five winter seasons of landfalling AR events along the west coast of North America (data discussed in detail in Section III) is shown in Fig. 6. Based on the identified normal segments for each axis point, an orientation angle of the AR axis relative to north is also
WICK et al.: IDENTIFICATION AND CHARACTERIZATION OF WATER VAPOR SIGNATURE OF ATMOSPHERIC RIVERS
2171
which define appropriate read routines and parameters such as the gradient thresholds, and structural elements. Since all of the image processing routines are well established, it is possible to migrate all of the procedures into a common, broadly supported, programming language to promote operational and more widespread application of the technique. Execution of the ARDT presently requires ∼25 s when applied to a 40◦ × 50◦ domain at 0.25◦ resolution using a typical Linux workstation. No attempts have been made to parallelize or optimize performance of the computations. While significant performance increases are possible, the procedure is still readily applicable to many seasons of observational and forecast fields. The most inefficient step is looping through all the potential axis points identified with the skeletonization procedure. Further reduction of the number of points prior to the directional search is desirable. III. VALIDATION OF THE P ROCEDURE
Fig. 6. Histograms of the (a) peak IWV value, and (b) average AR width in the 100 km closest to land for landfalling AR events along the west coast of North America during the October–March cool seasons from 2003–2004 to 2007–2008. Further information on the data utilized is provided in Section III.
derived. Finally, the flags indicating landfall or potential gaps in coverage are returned. The output is supplied as an ascii file. The structure of the file is to give the number of identified ARs, then list for each AR the number of extracted axis points followed by the location, core IWV value, width, and orientation for each of these points. At the end of this segment, the average core and width values and flags are provided. Through combining the output from multiple successive scenes, it is possible to define several additional characteristics representative of distinct ARs over their lifetime. These include estimates of their total lifetime, their propagation speed (expressed, for example, at different latitudes), time over specific locations at landfall, any changes in mean orientation, and their regions of formation and dissipation. From numbers of distinct events, it is also possible to compute frequency of occurrence over specified periods. C. Software Implementation The ARDT is currently coded using a combination of IDL and Matlab routines to take advantage of their built-in image processing routines. The bulk of the processing is performed using IDL with the exception of the skeletonization which is conducted in Matlab. While generally similar, the Matlab skeletonization routines provided results more consistent with our desired objectives than those in IDL. The overall execution of the procedure is driven by a shell script run in a Linux environment. The shell script incorporates command line specification of multiple quantities such as the IWV product source and resolution. Based on these inputs, configuration files are accessed for supported observational and model products
To validate the performance of the ARDT in accurately identifying the IWV signature of ARs, its detection of landfalling events along the west coast of North America was compared with the visual identification of ARs employed in the climatology of Neiman et al. [2]. In constructing their climatology of landfalling AR events, Neiman et al. [2] visually identified ARs using retrievals of IWV from the Special Sensor Microwave/Imager (SSM/I) and Special Sensor Microwave Imager Sounder flying on the Defense Meteorological Satellite Program (DMSP) satellites. Twice daily composites of IWV corresponding to the ascending and descending passes, respectively, of the DMSP satellites were formed from all the available data. ARs striking either the northern or southern portions of the coast were then identified in each composite field using the objective criteria of Ralph et al. [1]. The climatology was originally developed for the period between 1997 and 2005 but has been extended through the winter of 2010–2011 using the same procedures (with results through 2008 presented in [7]). Various standard measures of the skill of the ARDT were computed based on its application to a portion of the same data. The ARDT was applied to the composite IWV fields for all days between October and March during the five cool seasons from 2003–2004 to 2007–2008. While present in other seasons, the hydrologic impact of ARs, and hence the need to accurately forecast their occurrence, is greatest during the cool season [2]. The five-year duration represents a good compromise between a large number of events and a reasonable period to manually examine the results. The selected years were chosen based on the availability of good spatial coverage from SSM/I on multiple satellites. The spatial domain utilized in the automated application extended between 15–55◦ N and 110–160◦ W as shown in Fig. 2. The quantity upon which the skill assessment was based was the number of days in which a landfalling AR was found to impact either the north or south coast regions in either of the ascending or descending orbit 12-h composite fields. A total of 911 days were analyzed for the specified period. Since assessing the continuity of features is a key element of the ARDT, the IWV field must be spatially continuous for the tool to function reliably. Even though the IWV product is derived from multisatellite composites, occasional gaps exist
2172
IEEE TRANSACTIONS ON GEOSCIENCE AND REMOTE SENSING, VOL. 51, NO. 4, APRIL 2013
TABLE I C ONTINGENCY TABLE FOR V ERIFICATION OF THE AUTOMATED D ETECTION OF L ANDFALLING AR P LUMES ACROSS THE W EST C OAST OF N ORTH A MERICA OVER THE F IVE C OOL S EASONS F ROM 2003–2004 TO 2007–2008
in the fields due to data outages and gaps between successive orbits of the satellites. Forty-two days on which gaps were found to border potential AR features were discarded from the analysis, leaving 869 days for the skill assessment. Analyses were performed initially using thresholds at 2.0, 2.33, 2.67, and 3.0 cm. The full contingency table and accuracy measures are summarized in Table I. The results are extremely positive, confirming that the ARDT is performing very successfully. The overall accuracy is reflected in the critical success index (CSI, 92.8%) which is defined as the number of correct AR identifications (a in Table I) divided by the number of occasions on which an AR was identified and/or observed (a + b + c). Notably, only five events observed visually in the climatology were not detected by the ARDT, resulting in a very high probability of detection (POD) of 98.1%. The number of “false positive” identifications (15) is perhaps more problematic, but the resulting probability of false detection (POFD) is still only 2.5%. The bias, defined as the ratio of AR plumes detected with the automated technique to the number of plumes detected visually, in excess of 1 further reflects the slight tendency for the ARs to be overidentified. This slight tendency for overidentification has also been observed in testing with data in near real time. It is perhaps most informative to examine the cases in which the ARDT produced different results than in the visual climatology. Three representative cases in which the ARDT identified a landfalling AR where one was not included in the visual climatology are shown in Fig. 7. The majority of these “false positive” cases occur when narrow core regions of IWV in excess of larger thresholds occur within broader regions at thresholds near 2 cm [Fig. 7(a) and (b)]. In these cases, the ARDT is performing as programmed and AR-type features are indeed apparent at larger IWV thresholds. The results reflect the addition of width testing at thresholds not explicitly considered in the visual classification. Visual identification of ARs becomes highly subjective under these conditions, and these are not viewed as significant failures. The third example [Fig. 7(c)] shows an instance where a small finger of IWV in excess of 2 cm extended into the coastline and was deemed to have a connection to the main AR axis. The visual interpretation of
Fig. 7. Example “false alarm” cases where the ARDT detected a landfalling AR that had not been identified in the visual landfalling climatology. The imagery shows composites of SSM/I-derived IWV content for: (a) 0000–1200 UTC on 7 October 2005, (b) 1200–2359 UTC on 6 November 2007, and (c) 0000–1200 UTC on 14 November 2007. Detected AR axis locations are indicated by the gray circles.
cases like this is also subjective, and the failure of the ARDT is again viewed to be insignificant. Similarly, three cases in which the ARDT failed to detect an interactively defined event are shown in Fig. 8. Several different circumstances are responsible for the missed events. For the case in Fig. 8(a), landfall of a major AR is missed because the AR core in the vicinity of the coast exists at larger threshold IWV values than the 3.0 cm maximum threshold employed in initial testing. The indicated detected axis locations show that widths relative to IWV thresholds up to 3.0 cm were sufficiently narrow only over a small central portion of the extent of the AR. This case is in direct contrast to the false positive cases and highlights the tradeoffs involved in the selection of the threshold values. Inclusion of an additional larger threshold
WICK et al.: IDENTIFICATION AND CHARACTERIZATION OF WATER VAPOR SIGNATURE OF ATMOSPHERIC RIVERS
2173
TABLE II R EVISED C ONTINGENCY TABLE I NCORPORATING A DDITIONAL IWV T HRESHOLD L EVELS AT 3.33, 3.67, AND 4.0 cm
Fig. 8. Example “miss” cases where the ARDT failed to detect a landfalling AR that had been identified in the visual landfalling climatology. The imagery shows composites of SSM/I-derived IWV content for: (a) 1200–2359 UTC on 6 November 2006, (b) 1200–2359 UTC on 24 October 2005, and (c) 1200–2359 UTC on 26 February 2006. Detected AR axis locations are indicated by the gray circles.
value is desirable to capture events like that in Fig. 8(a), but this can result in the inclusion of other events that might otherwise be subjectively judged to be false positives. Missed events also resulted from discontinuities between the AR core position derived using different IWV thresholds as in Fig. 8(b). Since the AR axis is defined based on the midpoint of transects relative to discrete IWV thresholds, discontinuities can occur when narrow regions at a larger threshold come to an end within broader regions at a smaller threshold. The dilation of the axis point estimates handles most of these jumps, but there can be extreme cases where continuity is not detected. The final case [Fig. 8(c)] shows an example where a primarily north-southoriented feature was not identified due to broader width and weaker directional gradients. While the visual identification of
this plume is largely subjective, it does illustrate a case where inclusion of additional directional gradient calculations might be required. Since the failure to identify the AR in the case of Fig. 8(a) is so significant due to the hydrologic impact of that event, the analyses were repeated using additional IWV thresholds at 3.33, 3.67, and 4.0 cm. The tests also enable better quantification of the tradeoffs between missed events and false alarms. With the additional thresholds, the AR in Fig. 8(a) was correctly identified using the automated technique. In so doing, two additional features were falsely identified as ARs relative to the visual climatology due again to the existence of narrow core regions of IWV within broader regions at thresholds near 2 cm. The complete contingency table and summary statistics for application with the additional thresholds is shown in Table II. The changes are reflected in small increases in both the POD and POFD. While the CSI is reduced, the reduction (92.8% to 92.4%) is largely insignificant and the importance of identifying an event like that in Fig. 8(a) implies that inclusion of the additional thresholds is desirable. In general, manual inspection of all the cases where AR features were not identified appropriately in comparison to the visual climatology did not reveal any fundamental problems with the performance of the ARDT. While some minor modifications are desirable, such as inclusion of additional directional gradients, the majority of the missed events corresponded to subjective decisions in visual identification or tradeoffs between missed events and false alarms. The objective nature of the technique appears to be well suited for direct comparison of observational and model data where the same set of classification rules will be applied to each product. IV. P OTENTIAL M ODIFICATIONS AND F UTURE E XTENSIONS The construction of the ARDT is modular in nature allowing for easy modification and extension of the procedures. The multiple thresholds, in particular, can be readily adjusted for different applications and data products to obtain the desired level of sensitivity. These include thresholds for the required gradient strengths and the IWV levels at which the skeleton and AR width computations are performed. The degree of dilation
2174
IEEE TRANSACTIONS ON GEOSCIENCE AND REMOTE SENSING, VOL. 51, NO. 4, APRIL 2013
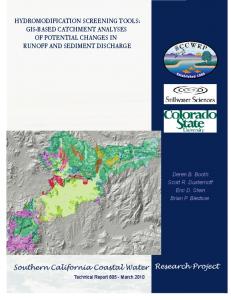
used to help assess continuity can similarly be modified to attain different sensitivity. It is important to emphasize, however, that any selection represents a potential tradeoff between missed events and false alarms as noted above. For any selection of parameters, the ARDT should be tested for a reasonable number of cases to evaluate how well the parameters function for a diverse set of conditions and ensure a suitable balance. Ongoing refinements to fundamental components of the ARDT are anticipated. Improvements in the calculation of the length of features to better account for curvature are planned. The optimum way to define the width of identified AR plumes in the presence of changes in their core IWV content along their length is yet to be determined. Depending on the desired application, additional definitions of the AR width can be implemented in the ARDT. Improved techniques for extracting characteristics within specific portions of an AR such as the region in the immediate vicinity of landfall are also desired. Further modifications can be implemented as the ARDT is increasingly applied to different geographic regions. In areas where ARs have different preferred orientation, additional directional gradients can be employed. All the thresholds will need to be examined to confirm their applicability in other regions. The basic definition of the IWV signature of ARs introduced by Ralph et al. [1] was developed for events in the northeastern Pacific Ocean. While the basic definition is expected to apply in other regions, some modification of the thresholds used in the procedure may be required in the western Pacific or other basins depending on the mean background IWV values. Some seasonal variations in the thresholds may also be desirable to account for changes in the mean background IWV state. Representative thresholds have previously been derived by looking at a large number of ARs in satellite imagery, but, depending on the desired application, thresholds could be optimized to isolate conditions associated with significant societal impacts. To expedite processing, additional procedures can be developed to distinguish any independent regional features like the ITCZ, whose signature has similarities to ARs and would otherwise complicate the characterization of AR features. A major planned extension is to apply the automated AR detection approach directly to estimates of the water vapor transport as opposed to the IWV content. The integrated vapor transport (IVT) most directly characterizes the strength, extent, and potential impact of ARs upon landfall and enables the formal detection of ARs as opposed to the proxy IWV signature. While direct measurements of the IVT are not available from current satellite sensors, an ARDT based on water vapor transport (ARTDT-IVT) could be immediately applied to the analysis and comparison of model-based forecast and analysis products as well as to climate change projections. An example illustrating similarities and differences between the IWV and IVT is shown in Fig. 9 for an AR occurring on 3 April 2012. The first two panels compare the AR IWV signature and detected AR axes for satellite-based observations and the corresponding analysis from the operational Global Forecast System (GFS) NWP model. The third panel shows the IVT derived from the GFS analysis with the AR axis derived from IWV in panel b overlaid. This example demonstrates how the IWV signature can indeed provide a good proxy for the water vapor transport within an AR and how the extension of the ARDT to IVT should be relatively straightforward.
Fig. 9. Comparison of the ARDT applied to satellite-derived IWV observations and the corresponding GFS IWV analysis and derived IVT. (a) Satellitederived IWV composite from 0000–1200 UTC on 3 April 2012 with the detected AR axis overlaid with the gray circles. (b) Corresponding 00 UTC IWV analysis from the GFS model run on 3 April with the extracted AR axis location in the model-derived field. (c) Derived IVT from the GFS analysis in (b) with the AR axis location derived from the IWV analysis in (b) overlaid. The coloring in (c) corresponds to the magnitude of the IVT while the vectors highlight the orientation of the transport in addition to its magnitude.
Moreover, the comparison illustrates how the ARDT can give a forecaster confidence that features identified in the model fields match observations from satellites. The ability to compare the consistency of features between different model runs is also of importance for building confidence in forecasts. Modification of the automated detection approach for IVT will primarily entail identification of appropriate thresholds for the strength and width of ARs. These can be obtained through examination of model-derived transport fields in conjunction with the existing IWV-based AR climatology. The other functionality including characterization of continuity and orientation is expected to be nearly identical as for IWV. The performance of the ARDT-IVT is expected to be even better for
WICK et al.: IDENTIFICATION AND CHARACTERIZATION OF WATER VAPOR SIGNATURE OF ATMOSPHERIC RIVERS
classification based on the IVT because background values in the absence of AR features are small, making definition of the events sharper. V. S UMMARY AND C ONCLUSION A new automated, objective tool for identifying and characterizing ARs in fields of the IWV content has been developed, implemented, and validated. The ARDT-IWV can be applied to IWV fields of arbitrary resolution obtained from direct observations or NWP model analyses or forecasts. The fundamental basis of the technique is simple objective criteria for the length (> 2000 km), width (< 1000 km), and IWV content (> 2 cm) of water vapor plumes published previously by Ralph et al. [1]. Applied interactively, these criteria have been shown to accurately capture ARs and have been used to construct a comprehensive climatology of landfalling AR events [2]. Automation of the technique has been accomplished utilizing several standard image processing techniques. Critical steps include thresholding of regions based on IWV content, determining continuity of features, and estimation of the AR axis using skeletonization and directional searches to identify the minimum-width cross section of the features. The ARDT is currently implemented using a combination of IDL and Matlab routines driven by a shell script interface. The output parameters characterizing the identified ARs can be divided into those obtained from the analysis of individual IWV fields and those derived from analysis of successive fields. From individual fields, the ARDT provides estimates of the AR axis position along with the width, core IWV value, and orientation along the AR extent. Average and peak values of the IWV content and width are also computed. Combining results from successive fields provides estimates of the lifetime, propagation speed, and formation and dissipation regions of distinct ARs. These outputs were largely optimized for the verification of NWP forecasts of events at multiple lead times. The performance of the ARDT was validated by comparing ARs identified by the tool with visually identified events from five winter seasons of the landfalling AR climatology of Neiman et al. [2]. The results were extremely positive with critical success indices between 92.8% and 92.4% and PODs between 98.1% and 98.5% depending on the IWV thresholds employed. The comparisons did not reveal any fundamental problems with the performance of the ARDT. Differences between the objectively and visually identified events were primarily the result of subjective decisions in visual classification and tradeoffs involved with the classification of events at larger core IWV values. Application of the procedure could be more problematic in the warm seasons due to the presence of larger background water vapor values. Overall, the ARDT appears very well suited for automated, direct comparison of observational and model data. The ARDT is modular in structure and can be easily modified and refined. Individual thresholds can be optimized for sensitivity within specific applications. All selections, however, will represent a tradeoff between missing some actual events and including other features that might not otherwise be considered ARs. Applied uniformly to multiple products, this should not be a significant issue. Planned improvements include refined computations of the length and width of AR features and
2175
extension of the technique to apply directly to measures of the water vapor transport. The ARDT was developed with the goal of enabling the creation of extended climatologies of ARs in multiple arbitrary geographic regions and facilitating the assessment of the predictability of the features. While the occurrence and impacts of landfalling events in the northeastern Pacific have been extensively studied, it is desirable to extend these analyses to encompass the entire Pacific and Atlantic Oceans. Broader climatologies will allow improved investigation of possible links between ARs and climatic variability such as associated with the state of the El Niño-Southern Oscillation or the Madden-Julian Oscillation. Studies in other regions will help demonstrate if ARs have as important a hydrological impact as has been found in the western United States. Ongoing applications include evaluation of the accuracy with which ARs are reproduced in current forecast and reanalysis models. The results should help forecasters interpret the model results and facilitate improvement of present-day forecasts of the events and associated precipitation. Similar evaluations of the representation of ARs in climate models will help determine to what degree projections of changing AR activity in a changing climate might be reliable. ACKNOWLEDGMENT The authors thank M. Hughes and W. Clark of the Physical Sciences Division of NOAA ESRL for useful discussions on the function and application of the AR tool. The extremely constructive comments of two anonymous reviewers are also greatly appreciated. R EFERENCES [1] F. M. Ralph, P. J. Neiman, and G. A. Wick, “Satellite and CALJET aircraft observations of atmospheric rivers over the eastern North Pacific Ocean during the winter of 1997/98,” Mon. Weather Rev., vol. 132, pp. 1721– 1745, 2004. [2] P. J. Neiman, F. M. Ralph, G. A. Wick, J. D. Lundquist, and M. D. Dettinger, “Meteorological characteristics and overland precipitation impacts of atmospheric rivers affecting the West Coast of North America based on eight years of SSM/I satellite observations,” J. Hydrometeorol., vol. 9, no. 1, pp. 22–47, Feb. 2008. [3] Y. Zhu and R. E. Newell, “A proposed algorithm for moisture fluxes from atmospheric rivers,” Mon. Weather Rev., vol. 126, pp. 725–735, Mar. 1998. [4] F. M. Ralph, P. J. Neiman, G. A. Wick, S. I. Gutman, M. D. Dettinger, D. R. Cayan, and A. B. White, “Flooding on California’s Russian River: The role of atmospheric rivers,” Geophys. Res. Lett., vol. 33, p. L13 801, 2006. [5] P. J. Neiman, F. M. Ralph, G. A. Wick, Y.-H. Kuo, T.-K. Wee, Z. Ma, G. H. Taylor, and M. D. Dettinger, “Diagnosis of an intense atmospheric river impacting the Pacific Northwest: Storm summary and offshore vertical structure observed with COSMIC satellite retrievals,” Mon. Weather Rev., vol. 136, no. 11, pp. 4398–4420, Nov. 2008. [6] P. J. Neiman, L. J. Schick, F. M. Ralph, M. Hughes, and G. A. Wick, “Flooding in Western Washington: The connection to atmospheric rivers,” J. Hydrometeorol., vol. 12, no. 6, pp. 1337–1358, Jul. 2011. [7] M. D. Dettinger, F. M. Ralph, T. Das, P. J. Neiman, and D. Cayan, “Atmospheric rivers, floods, and the water resources of California,” Water, vol. 3, no. 2, pp. 445–478, Mar. 2011. [8] B. Guan, N. P. Molotch, D. E. Waliser, E. J. Fetzer, and P. J. Neiman, “Extreme snowfall events linked to atmospheric rivers and surface air temperature via satellite measurements,” Geophys. Res. Lett., vol. 37, p. L20 401, 2010. [9] M. D. Dettinger, “Climate change, atmospheric rivers and floods in California—A multimodel analysis of storm frequency and magnitude changes,” J. Amer. Water Resources Assoc., vol. 47, pp. 514–523, 2011.
2176
IEEE TRANSACTIONS ON GEOSCIENCE AND REMOTE SENSING, VOL. 51, NO. 4, APRIL 2013
[10] S. Byna, Prabhat, M. Wehner, and K. Wu, “Detecting atmospheric rivers in large climate datasets,” in Proc. 2nd Int. Workshop PDAC, Seattle, WA, 2011, pp. 7–14. [11] C. Davis, B. Brown, and R. Bullock, “Object-based verification of precipitation forecasts. Part I: Methods and application to mesoscale rain areas,” Mon. Weather Rev., vol. 134, pp. 1772–1784, 2006. [12] C. A. Davis, B. G. Brown, R. Bullock, and J. Halley-Gotway, “The Method for Object-Based Diagnostic Evaluation (MODE) applied to numerical forecasts from the 2005 NSSL/SPC Spring Program,” Weather Forecast., vol. 24, no. 5, pp. 1252–1267, Oct. 2009. [13] A. K. Jain, Fundamentals of Digital Image Processing. Englewood Cliffs, NJ: Prentice-Hall, 1989. [14] R. C. Gonzalez and R. E. Woods, Digital Image Processing. Upper Saddle River, NJ: Prentice-Hall, 2002.
Gary A. Wick received the B.S., M.S., and Ph.D. degrees in aerospace engineering sciences from the University of Colorado at Boulder, Boulder, in 1988, 1990, and 1995, respectively. He has worked at the NOAA Earth System Research Laboratory since 2000 where he is primarily responsible for the application of infrared and microwave satellite remote sensing data to studies in oceanography, meteorology, and air–sea interactions. His interests also include the development of physical models of small-scale process at the air–sea interface. Recently, he has contributed to the NOAA Unmanned Aircraft Systems program where he has coordinated demonstrations and participated in the development of new instrumentation for atmospheric sampling from unmanned aircraft.
Paul J. Neiman received the B.S. degree with distinction from Cornell University, Ithaca, NY, in 1984, and the M.S. degree in meteorology from Pennsylvania State University, University Park, in 1987. His research interests lie in synoptic-scale and mesoscale meteorology, with a focus on orographically modulated flows and precipitation systems, extratropical frontal cyclones, and the weather–climate connection. His work has included the analysis and interpretation of numerous data sets from disparate sources, with an emphasis on combining observations recorded by state-ofthe-art remote sensing instruments including wind profilers, land-based and airborne cloud and precipitation radars, GPS integrated water vapor units, radio acoustic sounding systems, Doppler lidars, and space-based radiometric and microwave sensors. During the last decade, his research has focused on the meteorology along the West Coast of the United States.
F. Martin Ralph received the B.S. degree in meteorology from the University of Arizona, Tucson, in 1974, and the M.S. and Ph.D. degrees in atmospheric sciences from the University of California at Los Angeles, Los Angeles, in 1987 and 1991, respectively. He is a Research Meteorologist who has studied mesoscale and synoptic-scale phenomena and how they are affected by climate variability. A key area of interest is exploring how to best observe the atmosphere, with an emphasis on advancing the physical understanding of extreme precipitation processes as well as related hydrometeorological predictions and climate projections. Scientific understanding of atmospheric rivers, which are critical to both the global water cycle and to the distribution of precipitation and flooding in key parts of the world, is a major thrust. Currently, he is the Chief of the Water Cycle Branch at NOAA’s Earth System Research Laboratory/Physical Sciences Division.