of this program is to monitor earthquake shaking in hospital buildings. ... component of the monitoring system includes sensors, recorders, servers and all other.
Design and Implementation of A Structural Health Monitoribg Monitoring Monitoring and Alerting System for Hospital Buildings in the United States H. S. Ulusoy 345 Middlefield Road, Menlo Park, CA, USA
for
E. Kalkan & J. P. B. Fletcher United States Geological Survey, Menlo Park, CA, USA
P. Friberg Instrumental Software Technologies, Inc., NY, USA
in the United States W. K. Leith
United States Geological Survey, Reston, VA, USA
K. Banga Department of Veterans Affairs, Washington, DC, USA
SUMMARY: This paper describes the current progress in the development of a structural health monitoring and alerting system to meet the needs of the U.S. Department of Veterans Affairs to monitor hospital buildings instrumented in high and very high seismic hazard regions in the U.S. The system, using the measured vibration data, is primarily designed for post-earthquake condition assessment of the buildings. It has two essential components – sensing and analysis. The sensing component includes all necessary firmware and sensors to measure the response of the building; while the analysis component consists of several data processing modules integrated into an open source software package which compresses a large amount of measured data into useful information to assess the building’s condition before and after an event. The information can be used for a rapid building safety assessment, and to support decisions for necessary repairs, replacements, and other maintenance and rehabilitation measures. Keywords: Structural health monitoring, Instrumentation, Condition assessment, Earthquakes, Vibration
1. INTRODUCTION In 1971, an earthquake with magnitude of 6.6 hit San Fernando Valley in southern California, and resulted in collapse of Olive View and San Fernando Department of Veterans Affairs (VA) Hospitals. The VA hospital buildings had been built in 1925, before building codes were in effect. This catastrophe is a reminder that the integrity of nation’s hospital buildings is vital for the survival and functioning of the society in the aftermath of a catastrophic event. Following the 1971 earthquake, the VA’s current Seismic Vulnerability Assessment Program was established to identify and strengthen hospital buildings that needed to be brought up to seismic safety standards. An important component of this program is to monitor earthquake shaking in hospital buildings. In collaboration with the VA, United States Geological Survey’s National Strong Motion Project (NSMP) installed analog accelerographs in 60 VA medical buildings across the country immediately after the 1971 event. Later, in 2003, 45 of these instruments were upgraded to modern digital ones. In the last four years, VA buildings have been instrumented with dense arrays of seismic sensors to better understand their response to strong ground shaking. To date, the NSMP works closely with VA to monitor earthquake shaking in more than 70 VA medical buildings across the country. This effort helps the VA to better assess their building inventory and respond during future earthquakes (Kalkan et al. 2012a). While it is expected that the hospitals to remain open and ready to cope with illness and injury no matter the nature, size, or scope of a given disaster, it is critical for the hospital management to make a decision on continuing functionality or evacuation of patients and personnel considering the integrity of the hospital buildings affected by the same event. Therefore, there is a need for assessment of a hospital building’s state of health immediately after an event to help with deciding in the building
safety. For resilience and sustainability of nation’s hospitals, it is also necessary to assess their conditions periodically on the basis of measured data and visual inspections in order to facilitate necessary repairs, replacements and other maintenance and retrofitting measures. Vibration based structural health monitoring (SHM) and damage detection has emerged as a quantitative approach for assessing the integrity of structures. Considerable effort has been made in developing analysis techniques for SHM in the last three decades. System identification techniques and algorithms developed for SHM and damage detection vary depending upon available measured data, structural type and damage indicator—a parameter sensitive to damage in the structure. The selection of appropriate algorithms is critical for successful damage diagnosing in structures. Numerous methods and algorithms exist for damage detection using measured vibration data (Doebling et al. 1996, Sohn et al. 2001). While some of these methods are tested in small-scale laboratory experiments using simple structural models, the majority of them are verified with computer simulations. Despite all these efforts and developments, no single method has yet been found that identifies every type of damage in every type of structure. Thus, multiple methods are needed for reliable damage detection. A large number of methods in the literature fall into two groups. The first group contains model-based methods, where a preliminary computational model of the intact/reference structure is available beforehand. For the purpose of detecting possible changes with respect to the preliminary model, the model parameters are adjusted by optimization so that the updated model correlates with measured data reasonably well. Several issues hamper practical implementations of these methods as such they are computationally expensive, time consuming, and often suffer from divergence and non-uniqueness of the solution (Mottershead and Friswell 1993). Also, the uncertainties in modelling structural systems need to be investigated in detail when using model-based methods (Çatbas et al. 2011). The methods in the second group rely on the measured data only, and do not require a prior computational model of the structure. The system described herein utilizes damage detection methods falling into the second category (i.e., based on measured vibration data from the instrumented buildings). The system has two components: Sensing and analysis. Sensing component is composed of a dense array of accelerometers installed permanently at each floor of the building, and rapid data transmission and acquisition. Its analysis component consists of several data processing modules integrated into an open source software package, which compresses a large amount of measured data into useful information to assess the building’s condition before and after an event. In this system, probable structural damage is detected and alarm messages are sent upon agreement of different damage detection algorithms. 2. THE MONITORING SYSTEM AND ITS IMPLEMENTATION The sensing component of the monitoring system includes sensors, recorders, servers and all other necessary firmware to measure the response of the building, collect the data and transmit it to an onsite server in real-time. The analysis component consists of several data processing modules integrated into a software package called “Earthworm” (Johnson et al. 1995), which is an open source waveform and automated earthquake data processing software written primarily in the C programming language. Four separate algorithms are adopted and implemented here to detect probable damage in buildings. These algorithms are technically sound and easier to implement compared to their model-based counterparts. These algorithms compute time variations in natural frequencies of structures, inter-story drift ratio, shear-wave travel time between consecutive floors, and exceedance of base shear capacity. Each algorithm is implemented in a separate module. In addition to these damage detection modules, several other modules help data flow through the monitoring system, archive the data, and perform other intermediate data processing (explained later). The modules use configuration files, where computational parameters and settings of the data acquisition and firmware can be set. All modules of the monitoring system are listed and briefly described in Appendix A.
2.1. Instrumentation In collaboration with the U.S. Department of Veterans Affairs, the United States Geological Survey’s National Strong Motion Project has completed new multi-channel instrumentation of 21 hospital buildings all across the United States, and such instrumentation of seven more hospital buildings is in progress. As sensors, uniaxial and triaxial force balanced accelerometers (FBAs) are permanently deployed in hospital buildings to measure their motion. The number of the accelerometers deployed in each building varies depending on the floor area, the number of stories and the number of the blocks the building has. For instance, Fig. 2.1 shows a seismic array of 24 sensors in the 5-story Bed Tower, a recently instrumented hospital building in the Memphis, Tennessee VA Medical Center. These sensors are strategically located in the building to measure building’s translational motions.
Figure 2.1. In the Memphis, Tennessee VA Medical Center, the 5-story Bed Tower (left) building now has a sophisticated structural health monitoring system. As shown in the schematic (right), motion sensors have been deployed permanently on each floor. Arrows indicate the locations of sensors from ground level to roof and their orientation. These sensors are connected to the central data transmission and acquisition system (Kalkan et al. 2012b).
From the analysis point of view, half of the total degrees-of-freedom in modelling structural system is associated with rotation and other half is associated with translation. Both are equally important in analysis and design. However, from the sensing point of view, the direct measurement of the rotational degree-of-freedom has been still not practical due to high cost of rotational sensors that are reliable and accurate. This fact significantly reduces the scope of SHM applications. The measured quantity used in this project is only the acceleration of the translational degree-of-freedoms associated with floor motions in two orthogonal directions. Each hospital building is instrumented in a similar way: The accelerometers are deployed permanently at the locations where the maximum response is expected, mostly the edges of the buildings. Every story in each building has at least three accelerometers oriented horizontally in two orthogonal directions to detect building motion along the reference east-west and north-south directions. Floor rotation around the vertical axis can be computed from the recordings of the two accelerometers located at different points and oriented in the same directions. Each building also has a triaxial accelerometers located on the ground floor, which provides the input ground motion in three orthogonal directions. Additionally, some buildings have multiple accelerometers oriented in the vertical directions, which allows one to compute the building’s rocking motions. The instrumentation within these buildings is aimed to record floor accelerations, and to compute relative displacement between adjacent floors, as well as overall building roof displacement, floor torsion, building rocking, travel time of transmitted seismic waves between consecutive floors, and building’s modal parameters (vibration periods, mode shapes and modal damping values). The accelerometers used in this project are primarily designed for structural engineering applications, and can measure acceleration up to 4 g. Having an adjustable full-scale recording range of ± 0.25 to ± 4 g makes these instruments also suitable for use in low-level ambient vibration tests. The
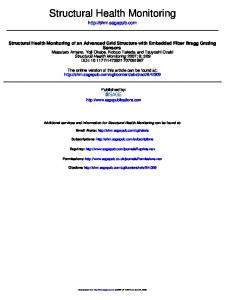
accelerometers are connected to the 24-bit IP-based digital recorders (digitizers) by wires. The digitizers work both in continuous recording mode and event-triggered mode. The digitizers run an earthworm module rock2ew, which pushes the data into an on-site Linux server in real-time. The server and the digitizers are on the same local area network. The server runs earthworm software package, which archives the data in the Winston Wave Server (WWS) and Earthworm Wave Server V (WVS). 2.2. Data Acquisition, Transmission and Archiving Fig. 2.2 shows the general data flow of processing. The digitizers run the rocktoew module, which exports acceleration waveforms to an on-site Linux server, where an earthworm import module writes data into an earthworm ring named the wave ring. Ring is a shared dynamic memory, where the data and messages flow through in real-time. For redundancy, the data are archived both in the WWS and WVS. The earthworm waveform data are stored as Tracebuf2 packets identified by SEED (Standard for the Exchange of Earthquake Data) convention SCNL (Station, Channel, Network, and Location), and stamped by the start and end time. SEED is an international standard format for the exchange of digital seismological data. SEED was designed for use by the earthquake research community, primarily for the exchange between institutions of unprocessed earthquake motion data. It is a format for digital data measured at one point in space and at equal intervals of time. The Tracebuf2 waveform packets for the digitizer sent from rocktoew are one second in length and have a sampling frequency of 200 Hz. The acceleration data are then integrated using the earthworm ewintegrate module and placed into a ring named velocity ring. A second ewintegrate module takes data from the velocity ring and filters and integrates it. Then, the same module places it into a displacement ring. Finally, the Earthworm module ewdrift, which computes inter-story drift (differencing of displacement of like oriented sensors on the same vertical axis separated by a single story of the building), reads displacement data and writes inter-story drift values (also asTracebuf2 packets) to a new ring named drift ring. Each of the velocity, displacement and drift ring are archived into a WVS module. Each WVS can store several days worth of data. The WWS module is configured to store a few months of acceleration data. If desired, remote clients may access to the WVS and WWS thorough the IP address to retrieve the archived data through a computer running earthworm. 2.3. Damage Detection Algorithms This section briefly describes four different damage detection algorithms implemented; a flow-chart showing the analytical procedure including these algorithms is shown in Fig. 2.3 2.3.1. Waveform Deconvolution The use of the wave propagation phenomenon in a building has been proposed as an alternative damage diagnostic approach for SHM applications (Todorovska and Trifunac 2008). This approach, known as seismic interferometry in seismology, is based on the correlation of waves recorded at different locations in the building (Snieder and Safak 2006). The deconvolution of the waveforms at different receivers in the frequency domain leads to a Green’s function, also known as Impulse Response in engineering. The wave travel time can be obtained from Impulse Response. The approach is appealing because it is easy to implement for real-time applications without demanding significant computational power, and it requires data from only two sensors at a time. The approach decouples the building from the ground, which minimizes the soil-structure interaction effect on the building frequencies. Some issues however arise when implementing this approach for SHM applications: First, the building dynamic behaviour is assumed to be linear. When the building is damaged, the linear behaviour assumption is no longer valid. In such cases, processing the data piecewise would provide a wave travel time for an equivalent linear structure. Second, since the approach is based on onedimensional wave propagation, it may lead to misleading results for buildings with significant torsional mode contribution to response. This technique has been successfully applied to the hotel building in Van Nuys, California (Todorovska and Trifunac 2008). This building suffered damage from the 1971 San Fernando and 1994 Northridge earthquakes. The wave travel times are measured
from impulse response function computed from seismic response data recorded within three time windows – before, during and after the earthquake to locate the damage since the travel time between two points depend on the stiffness changes between them. Accelerometers
Earthworm module Shared memory ring
Digitizers
Wave server import
WVS 16023
WVS 16024
WAVE RING
export
ewintegrate
importEW
VEL. RING
ewintegrate
WVS 16025
WVS 16026
MySQL
WWS 16022
DISP. RING
ewdrift
importEW
DRIFT RING
export
swarm
Figure 2.2. Real-time data flow of the monitoring system [WSV = Earthworm wave server (short term archive); WWS = Winston wave server (long term archive); ewintegrate = real-time integration module; ewdrift = drift computation module; swarm = real-time waveform visualization module]
An earthworm module called ewdeconvolution makes use of the wave propagation phenomenon in buildings. The module takes the raw acceleration data from the wave ring and computes the shear
wave travel times between the sensors specified in the configuration files using the consecutive data time windows. Then, the relative changes in the wave travel time are monitored to detect stiffness and/or strength changes in the structure. WAVE RING
ewaccel
ewdeconvol
WVS 16023
gmew
ewspectra
ewmodal
SPECTRA RING
RSA files
FFT files
Modal files
DRIFT RING
ewthreshold
ALARM RING
ewnotify
Earthworm module
Shared memory ring
Wave server
Figure 2.3 Flowchart showing real-time data analysis for damage detection; dash line shows on-demand processes [RSA: Response spectral acceleration; FFT: Fast-Fourier Transformation; ewaccel = computes inertial forces and check for base shear capacity exceedance; ewdeconvol = computes shear-wave travel time; gmew = computes peak acceleration and response spectral acceleration; ewspectra = computes FFT or deconvolved spectra of waveforms; ewmodal = estimates modal parameters; ewthreshold = reviews waveforms and tests for threshold exceedance, and issues alarm messages; ewnotify = Notifies alarm messages via email/SMS]
2.3.2. Base Shear Capacity This damage detection module computes inertial base shear by adding all floor inertial forces above the base of the building (Fig. 2.4). The inertial force at a floor is computed as the product of floor acceleration and floor mass (e.g., Jennings 1997, Naeim 1997). The inertial base shear computed using this procedure is denoted by VbxI in the longitudinal direction and VbyI in the transverse direction. It is useful to emphasize that this procedure is an approximate method to obtain an estimate (not necessarily an exact value) of the base shear demand during an earthquake without the need for detailed structural analysis (Goel 2011). The inertial base shear demand is compared with the base shear capacity, estimated from either pushover analysis (e.g., Kalkan and Kunnath 2006, 2007) or the code design base shear (e.g., Naeim 2004) for exceedance. The base shear capacity from pushover analysis or the code base shear is indicative of the sum of shear forces in all columns at the building’s base. Exceedance of base shear capacity during an earthquake excitation may indicate a probable damage in the building.
Figure 2.4. Computation of inertial base shear computed from summation of inertial floor forces [NF = Number of Floors] (Figure is modified from Goel (2011))
2.3.3. Inter-story Drift Ratio The relative displacement between two consecutive floors is defined to be the inter-story drift, and the drift normalized by story height is the drift ratio. In practice, the inter-story drift ratio, enforced to be smaller than the predetermined values in the building codes, is one of the design parameters for multistory structures. For example, the 2010 California Building Code (ICBO, 2010) states that structural system shall be designed to have adequate stiffness to limit deformation and lateral drift due to earthquake loading, and refers to the Seismic Design Requirements for the Building Structures of ASCE/SEI 7-10 for drift limits. Table 12.12-1 of ASCE/SEI 7-10 provides the allowable story drift limits for different type of structures in four risk categories. The inter-story drift ratio is also an important parameter used in the performance evaluation and rehabilitation of existing structures. FEMA 356 (FEMA, 2000) defines four performance levels of buildings under earthquake loads: (1) Operational, (2) Immediate occupancy, (3) Life safety, and (4) Collapse prevention. In ASCE 41-6 (ASCE, 2007) these performance levels are linked to drift values for different types of structures in order to describe them quantitatively. The drift limits in ASCE 41-6 are not intended to be used for design or performance evaluation of structure; nonetheless, they provide general insights into the damage level in the structure due to an earthquake. In monitoring system being developed, the ewdrift module implements the inter-story drift ratio computation in realtime. Fig. 2.3 shows the data flow for drift computation. Once the apparent drift is computed, the ewthreshold module compares the inter-story drift ratios to the threshold values set previously in the configuration file, and sends the threshold exceedance messages into alarm ring where the messages can be sent to remote clients or can be archived. 2.3.4. Modal Parameters The modal parameters (i.e., natural periods, damping ratios and mode shapes) have been extensively used in SHM primarily because of two practical reasons (Doebling et al. 1996 and Salawu 1997). First, there exist reliable techniques to extract these parameters from the measured vibration data. The techniques utilize the ambient data where the excitation is not measured and forced vibration data where both the excitation and response are measured, for example the earthquake-induced data.
Second, the modal parameters of a structure depend on its physical properties (i.e., mass, stiffness, strength and damping). Any change in these properties results in the change in the modal parameters. Therefore, tracking the possible changes in the modal parameters can be used as a tool for detecting the change in the global condition of the structure. Often, a set of modal parameters is identified for the intact structure as a-priori. This set is used as a baseline for tracking the possible changes in the structure. A new set of modal parameters is computed using the measured data. Then, these two sets are compared to detect changes in the structure. An issue of using modal parameters for health monitoring of structures in practice is that the modal parameters vary with the environmental factors (temperature, wind etc). While making condition assessment, one needs to account for the fluctuations in modal parameters as a result of such external effects. It is also known that these parameters are time and amplitude dependent (Ulusoy et al. 2011). Structural members may lose their strength and stiffness gradually over years due to ageing and degradation. The natural frequencies of a structure due to ambient excitation drop significantly when the structure is subjected to an earthquake excitation. The frequencies recover back to the initial values before earthquake if no permanent change happens to the structure due to contribution of nonstructural components into the global stiffness/strength of the structure. A comparison between the modal parameters obtained due to an ambient excitation and those obtained due to an earthquake excitation is very likely to be inconclusive. The soil-structure interaction also may considerably affect the modal parameters. It has been shown that monitoring changes in modal frequencies can lead to false alarms (Todorovska 2009). Therefore, a reasonable comparison is valid only if the structure is subjected to similar excitations in both cases. Taking the aforementioned issues into considerations, a comparison of the two sets of the modal parameters of the buildings identified before and after an earthquake provides a more reliable judgement regarding possible permanent changes in the building caused by the earthquake. The complex mode identification method (Shih et al. 1988) is adopted and implemented in earthworm module ewmodal for the identification of the building’s modal parameters. This method requires both the excitation and response measurement data so that Frequency Response Function (FRF) can be computed. FRF can be replaced by cross power spectral density for the cases where the excitation is not measured and assumed to be a white noise process (Brincker et al. 2001). 3. VALIDATION AND VERIFICATION A great number of the methods proposed for damage detection in the state-of-the-art have been validated using computer-generated data. In such validation procedure, damage is introduced in a structure by reducing the stiffness of certain structural members or by removing some redundant structural members (Johnson et al. 2004). For actual structures, however, when certain members of a structure are damaged, the internal forces developed in these members are redistributed in accordance with the remaining stiffness of these members. Also, the uncertainties in modelling structures and in measurement are greatly underestimated or totally ignored. Therefore, using computer simulated damage scenarios in that way is not quite realistic to validate damage detection algorithms. The best way to validate a damage detection algorithm is to use response data of actual structures subjected to damaging forces, for example earthquakes. Due to lack of such data, one needs to use experimental validations. The functionality of the monitoring system presented here has already been tested and verified in an actual building (VA Hospital Building in Palo Alto in California). What remains is to validate damage detection algorithms to be implemented. For this purpose, an experimental setup is prepared. This setup imitates the one monitoring the Palo Alto VA Hospital, and consists of a uni-directional shake table, a 12-channel digitizer, a Linux server running earthworm, and a small-scale structural model. The shake table is driven by a servomotor, and can produce up to 2.5 g acceleration at 15 kg loading. The frequency range of the excitation is 0 to 20 Hz. The model is a three-dimensional aluminium frame structure with 4 stories. The model is instrumented with five force-balanced accelerometers; the
same instruments used for the buildings. The column and beam members of the frame are connected with the joints of adjustable rotational stiffness. The damage is introduced by changing the joint stiffness by torque wrench. Adjustable rotational joints stiffness will enable one to change the global stiffness of the model, thus simulate damage in the structure. In order to validate the damage detection methods, the effect of damage on the natural frequencies, mode shapes and the wave travel time will be investigated using different damage configurations. Further validations will be performed using data from large-scale shake table experiments. 4. CONCLUSIONS Presented in this paper is a system for damage detection and alerting, which has been under development in collaboration with the U.S. Department of Veterans Affairs to monitor hospital buildings instrumented in high and very high seismic hazard regions in the U.S. It has two essential components – sensing and analysis. The sensing component includes all necessary firmware and sensors to measure the response of the building; while the analysis component consists of several data processing modules integrated into an open source software package which compresses a large amount of measured data into useful information to assess the building’s condition before and after an event. One of the unique features of this system is that it does not require a finite element model of the structure. Probable structural damage is detected and alarm messages are sent upon agreement of different damage detection algorithms. These algorithms check variation in the inter-story drift, modal frequencies, mode shapes and damping values, shear-wave travel time between consecutive floors, and exceedance of base shear capacity at any time. In the aftermath of a disaster, the information can be used for a rapid building safety assessment, and to support decisions for necessary repairs, replacements, and other maintenance and rehabilitation measures. In the long term, this system monitors the structural components against deterioration and fatigue to achieve more resilient and sustainable urban environments. APPENDIX A: STRUCTURAL HEALTH MONITORING SYSTEM MODULES rocktoew import export WVS WWS ewintegrate ewdrift ewthreshold gmew ewspectra ewacceleration ewdeconvolution ewnotify
Exports acceleration waveforms to a Linux server Imports data into Earthworm rings Exports data to Winston Wave Server (WWS) Archives module for saving waveforms in a ring buffer on disk Archives module for saving waveforms in a MySQL database Integrates waveform data in real time Computes inter-story drift ratio in real time Reviews waveforms and tests for threshold exceedance, issues alarm messages Computes peak acceleration on demand Computes response spectral acceleration on demand Computes inertial forces and check for design base shear exceedance Computes shear-wave travel time Notifies alarm messages via email/SMS
AKCNOWLEDGEMENT We wish to thank Drs. Necati Catbas, Robert Nigbor and Maria Todarovska for their review and providing their comments and suggestions, which were helpful in improving the technical quality of the paper. Funding for this project has been generously provided by the U.S. Department of the Veterans Affairs. REFERENCES American Society of Civil Engineers (2010). ASCE/SEI 7-10: Minimum design loads for buildings and other structures. American Society of Civil Engineers, Reston, VA. American Society of Civil Engineers (2007). Seismic Rehabilitation of Existing Buildings, Report No. 41–6: American Society of Civil Engineers, Reston, VA. Brincker, R., Zhang, L. M. and Andersen, P. (2001). Modal identification of output-only systems using
frequency domain decomposition. Smart Materials and Structures. 10:3, 441–445. Çatbas, F. N., Gokce, H. B. and Frangopol, D. M. (2011). Predictive Analysis by Incorporating Uncertainty through a Family of Models Calibrated with Structural Health Monitoring Data. Journal of Engineering Mechanics–ASCE, 2011. (doi:http://dx.doi.org/10.1061/(ASCE)EM.1943-7889.0000342) Doebling, S. W., Farrar, C. R., Prime, M. B. and Shevitz, D. W. (1996). Damage identification and health monitoring of structural and mechanical systems from changes in their vibration characteristics: a literature review. Technical Report LA–13070–MS, Los Alamos National Laboratory, Los Alamos, NM. Federal Emergency Management Agency (2000). FEMA 356-Prestandard and Commentary for the Seismic Rehabilitation of Buildings. Federal Emergency Management Agency, Washington, DC. International Conference of Building Officials (ICBO-2010). California Building Code, Whittier, CA. Jennings, P.C. (1997). Use of strong motion data in earthquake resistant design, in Proceedings of SMIP97 Seminar on Utilization of Strong-Motion Data, Strong Motion Instrumentation Program, CDMG, Sacramento, CA. Johnson, C. E., Bittenbinder, A., Bogaert, B., Dietz, L. and Kohler, W. (1995). Earthworm: A flexible approach to seismic network processing. IRIS Newsletter. 14:2, 1–4. Johnson, E. A., Lam, H. F., Katafygiotis, L. S. and Beck, J. L. (2004). Phase I IASC–ASCE Structural Health Monitoring Benchmark Problem Using Simulated Data. Journal of Engineering Mechanics–ASCE 130:1, 3–15. Goel, R. (2011) Comparison of Base Shears Estimated from Floor Accelerations and Column Shears, Earthquake Spectra, 27:3, 939-946. Kalkan, E. and Kunnath, S.K. (2006). Adaptive Modal Combination Procedure for Nonlinear Static Analysis of Building Structures. Journal of Structural Engineering–ASCE.132:11, 1721–1732. Kalkan, E. Kunnath, S. K. (2007). Assessment of Current Nonlinear Static Procedures for Seismic Evaluation of Buildings. Engineering Structures. 29, 305–316. Kalkan, E., Banga, K., Ulusoy, H.S., Fletcher, J.P.B., Leith, W.S., and Blair, J.L. (2012a). Helping safeguard Veterans Affairs' hospital buildings by advanced earthquake monitoring: U.S. Geological Survey Fact Sheet 2012-3094, 2 p. available at http://pubs.usgs.gov/fs/2012/3094/. Kalkan, E., Fletcher, J. P. B., Leith, W. S., McCarthy, J. and Krishna, B. (2012b). Real-time seismic monitoring of instrumented hospital buildings: U.S. Geological Survey Fact Sheet 2012–3028, 2 p., available at http://pubs.usgs.gov/fs/2012/3028/. Mottershead, J. E. and Friswell, M. I. (1993). Model updating in structural dynamics: a survey. Journal of Sound and Vibration. 167:2, 347–375. Naeim, F., (1997). Performance of Extensively Instrumented Buildings During the January 17, 1994 Northridge Earthquake. An Interactive Information System, Report No. 97–7530.68, John A. Martin & Associates, Los Angeles, CA. Naeim, F., Lee, H., Bhatia, H., Hagie, S., and Skliros, K., (2004). CSMIP instrumented building response analysis and 3-D visualization system (CSMIP–3DV), in Proceeding of SMIP04 Seminar on Utilization of Strong-Motion Data, Strong Motion Instrumentation Program, CDMG, Sacramento, CA. Salawu, A. S. (1997). Detection of structural damage through changes in frequency: a review. Engineering Structures. 19:9, 718–723. Shih C. Y., Tsuei Y. G., Allemang R. J. and Brown D. L. (1988). Complex mode indication function and its application to spatial domain parameter estimation. Mechanical Systems and Signal Processing. 2:4, 367– 377. Snieder, R. and Safak, E. (2006). Extracting the Building Response Using Seismic Interferometry: Theory and Application to the Millikan Library in Pasadena, California. Bulletin of the Seismological Society of America. 96:2, 586–598. Sohn, H., Farrar, C. R., Hemez, F. M., Shunk, D. D., Stinemates, D. W. and Nadler, B. D. (2003). A review of structural health monitoring literature: 1996-2001. Technical Report LA–13976–MS, Los Alamos National Laboratory, Los Alamos, NM. Todorovska, M.I. and Trifunac, M.D. (2008). Impulse response analysis of the Van Nuys 7-story hotel during 11 earthquakes and earthquake damage detection. Structural Control and Health Monitoring. 15:1, 90–116. Todorovska, M. I. (2009). Soil-structure system identification of Millikan Library North-South response during four earthquakes (1970-2002): what caused the observed wandering of the system frequencies? Bulletin of the Seismological Society of America. 99:2A, 626–635. Ulusoy, H. S., Feng, M. Q. and Fanning, P. J. (2011). System identification of a building from multiple seismic records. Earthquake Engineering & Structural Dynamics. 40:6, 661–674.


![[PDF] Bridges: Analysis, Design, Structural Health Monitoring, and ...](https://m.moam.info/img/260x300/pdf-bridges-analysis-design-structural-health-moni_6477d80b097c4786708c2918.jpg)