Design and Implementation of Visualizers for TinyOS
Recommend Documents
We present design patterns used by software components in the TinyOS sensor network oper- ..... and C# the standard technique is to use an interface or class.
We instrument the original node software to signal asynchronous atomic events to a local nesC component running a runtime verifica- tion algorithm; this checks ...
4) Low Power: Demands of size and cost, as well as untethered operation make low- .... program (application plus operating system) analysis and inlining.
Additional Key Words and Phrases: Design Patterns, embedded systems, nesC,
TinyOS .... 2003] is a C-based language with two distinguishing fea- tures: a ...
design patterns by including a few simple language ... are a significant departure
from C programming ... ented design patterns for embedded and real-time.
sensor routing protocol, using TinyOS and nesC. TinyOS ... nesC. SPIN protocol is a data-centric routing protocol for. Wireless Sensor Network (WSN). SPIN fits ...
This is expected to foster the use of intelligent agents and to aid both humans and programs in finding ...... [30]: M.R. Garey, and D.S. Johnson. âCrossing number ...
inheriting their design premisses, including Petri nets translation [9]. 2.1 From ...... Lecture Notes in Computer Science (CBSE'2005), 3489:90â108, 2005. 20.
and post-conditions for Modula-3 [17] and Java programs. [18]. However, there ...... Jass supports detection of hierarchy errors in the spirit of Contract Java. [14].
occurrence of coordination events (indeed, slice activation in protocols), the #- ... In the current implementation of HPE, only one back-end has been devel- oped ...
Nov 30, 2017 - A mobile portal is an internet gateway that provides online services primarily .... and managing the portal's database, tomcat for converting JSP ...
Apr 16, 2010 - Reliable sensor software is difficult to program. Inter- rupt-driven code has unrestricted access to the microcon- troller's mapped memory, and a ...
Dec 8, 2003 - This makes it a main memory steam processing system. ..... The key advantage of Fjords is that they allow distributed query plans to use a ... implements an intelligent lottery scheme for variable selectivity, which is simple to.
This paper aims to present an application of ECOGRAI method to a surfwear company. This application is specific in the sense that the company has no .... Products are also distributed using remote sale companies as in France ... products from subcont
This will provide the complete freedom for ... The universal reader for the blind is a device that helps .... implementation is indicated in the form of the flow chart.
May 28, 2010 - CC2520 [25] is the second generation of TI's Zigbee SoCs, released in ...... acquisition, vision, and motion control devices, as well as GPIB, PXI, ...
International Journal of Computer Applications (0975 â 8887). Volume 157 â No ... are used and managed by the proposed mobile application. This application ... special section, this paper was proposed to make life easy for those who are in .....
Jan 12, 2015 - 1. Introduction to database development. 10. 1.1. Conceptual data modelling. 11. 1.2. The Entity Relation
12 Jan 2015 - Similarly, people who are commissioning a database may ...... a) Produce a list of entity types then draw
ner that will make the design significantly easi- er? .... but modern business phones that can hold, transfer ..... programming, but C++ has no graphics primi-.
Abstract. As embedded sensing systems are central to developing per- vasive ... programming of embedded context-aware applications, one needs tools for soft-.
implementation approach used for programming and ... methodology used by the authors for developing .... Since the application development is independent.
Sep 1, 2014 - KEYWORDS: Online Registration; Web design; Internet; E-Commerce; Online stores; Online Application Forum. 1 INTRODUCTION. By the turn ...
Design and Implementation of Visualizers for TinyOS
In sensor network graphical simulators play significant role in above ..... 3D application, which monitors any data packet on sf (port 9003) reads and displays this ...
International Conference on Computational Intelligence: Modeling Techniques and Applications (CIMTA) 2013
Design and Implementation of Visualizers for TinyOS Atrayee Guptaa,∗, Sarbani Royb a School
of Mobile Computing and Communication, Jadavpur University, Salt Lake Campus, Kolkata-700 098, India b Department of Computer Science and Engineering, Jadavpur University, Kolkata-700 032, India
1. Introduction Modern day research in the area of wireless sensor networks (WSNs) has shown a considerable growth. WSN field has improved in both hardware and software technologies. The platforms have become more sophisticated in terms of resource conservation and have become intelligent with respect to the environment. One such platform is TinyOS [1]. It provides a light weight, modular and concurrency driven architecture solely for the WSN. The former versions of TinyOS (1.x) was built for mica family. As the hardware evolved from mica to telos family, the versions of TinyOS also improved. TOSSIM is a code level simulator in TinyOS to simulates nesC [2] application. TOSSIM [3] considers hardware as component and replaces some low level hardware interrupts with events. These events (hardware interrupts, packet send receive,tasks) are queued up in event-queue of TOSSIM in timely fashion and are executed. Each event is run at virtual time. Each nodes follow a sequence at random times to prevent artificial synchronization. Like TinyOS, TOSSIM model provides bit-level radio object, byte level mac object and also can simulate data link layer sending-receiving of AM packets. All the instantiated objects provide different methods by which we can add link, create noise model from a topology file, or can inject packets. However TinyOS 2.x framework lacks proper visualization approach for simulator and also for real-time network. TOSSIM library has no GUI based implementation. ∗
Atrayee Gupta and Sarbani Roy / Procedia Technology 10 (2013) 409 – 416
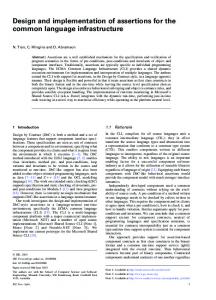
Since year 2000 the use of TinyOS has increased significantly. A statistical report showed that yearly download of the software reached 25000 on average with a peak rise in usage graph of this operating system [4]. Contribution for such a popular operating system from the developers community towards academics and industry is worth mentioning. However there are still some opportunities yet to be explored in this field and hence its still a research issue. The energy utilization space for such small, distributed and self-configured device is optimum and all nesC applications are devised with this consideration. However researchers need to explore the possibilities of advanced algorithms (with or without mobility) on these resource constrained platforms which are different from ordinary wired network. Study in this area requires experimentation, implementation of new protocols and proposal of better solutions. As new architecture needs to be tested, the management of cost and time in real world becomes a serious issue. Hence implementing protocols in simulators is considered more feasible and smarter approach. Simulation is a process by which natural systems can be studied by means of models and their behaviour can be well examined before implementing them in real life operations. Its a scientific abstraction of system(s). It helps to focus on ”whatif scenario” before actual implementation and also helps to anticipate some modified behaviour of the system. In graphical simulations users can visualize and interact with a virtual network easily. Some test environment can also be abstracted in graphical simulation. In sensor network graphical simulators play significant role in above terms. TinyViz was Java based visualizer for TOSSIM in TinyOS 1.x. As graphical user interface helps to study the environment in user friendly way and as TinyOS older versions used to support a graphical simulator TinyViz, but recent versions does not, we tried to extend the existing command line based TOSSIM into a graphical display. Tools for displaying sensor data in user friendly way is being devised for many years. Among these tools 3D display has gained popularity over 2D displays. 3D virtual environment not only provides the user a look and feel of actual environment but also provides an interface to interact with the background real network. In recent years there has been a huge development in 3D user interface. Although small academic tools for TinyOS include store and read sensed data to and from database, display readings in a table or graph for comparative study are known but a 3D user interface for real-time network solely for TinyOS is still not covered. Comparing with real-world scenario 3D applications for TinyOS has to be developed for a user friendly display. In this paper we present approaches to add support for two visualizers in TinyOS framework. One such graphical addition is for simulator TOSSIM and another is for real-time network. This paper also provides an insight to improve its static model to incorporate various mobility models. A simple approach to integrate a 3D virtual network environment with TinyOS to obtain readings of sensor data from real-time network is also shown. The main contributions of this research work are 1) Visualizer for TOSSIM 2) 3D visualizer for real time data. This paper also demonstrates a simple 3D application which fetches current readings from real-network for TinyOS 2.x. The paper has been organized in the following way. Design and implementation of visualizer for TOSSIM is discussed in Section 2. Section 3 describes the 3D visualizer for real data collection in WSN. Section 4 briefly discusses related work in this field. Section 5 concludes the paper. 2. Visualizer for TOSSIM This section presents the design and implementation of visualizer for TOSSIM. 2.1. User Interface Design When we start the application a user interface shows up. It is a simple model and easy to follow. Left side of the window contains basic instructions about how to run the simulation. User needs to choose either a static or a mobile model, hence a radio button option is provided. Default selection for mobile wsn (MWSN) is random waypoint mobility model. Second the user needs to slide the scale to select number of motes and the communication range. Then after starting the application a window shows the simulation for that particular nesC application. The interface has been designed with the help of glade [5] and pyGTK [6]. While glade is used for graphical display, pyGTK is used to make the underlying function call. The whole application uses TOSSIM and TosVis python libraries. Figure 1 shows the interface. To distinguish between static wsn and mobile wsn simulations we have separated the color codes for send and receive tasks.
Atrayee Gupta and Sarbani Roy / Procedia Technology 10 (2013) 409 – 416
Fig. 1. User interface of visualizer for TOSSIM
2.2. Implementation According to the internal architecture of our proposed framework, the interface and the TinyOS runs above general OS. TOSSIM executes the nesC applications on top of TinyOS framework. The events generated in the event queue are read by the GUI application through intermediate buffer provided by the system calls of the OS. The proposed user interface class uses the concept of TosVis library and adds some features to it. The main application starts, and user supplies range and number of nodes. The main application creates a separate window. It calls TOSSIM object and creates same number of nodes as supplied by user and boots them separately. It draws those nodes on canvas window. The interface adds green colored radio links between neighbours and abstracts radio communication by adding noise model. Noise trace has been already provided in a separate file. The application creates a noise model by reading noise traces from that file and simulates a radio model in TOSSIM. The application is also designed to add mobility on individual motes based on random way point model. The proposed architecture make uses of the event queue of TOSSIM and appends file descriptor objects to addChannel method of TOSSIM. If any message arrives at write end of the pipe, the read end immediately reads it and sends it for further processing. Depending on what the underlying operating system has read from the pipe, a regular expression pattern match is applied on the objects and the canvas is updated accordingly. Simulation starts and application watches for debug messages. When dbg messages generate at the pipe end, the information is processed accordingly. AM messages are decoded and creates appropriate circle in the canvas. Led messages are decoded and the proposed GUI application is set to change color on the window. The debug messages are also saved in external text file for further study. Figure 2 depicts the activity sequence diagram of the entire system. 2.3. Demonstration The proposed framework provides a visual display of the virtual static and mobile sensor network in a user friendly way. In a static wsn simulation with some given number of nodes sending process creates pink circle around respective node and receiving creates red circle as shown in Figure 3. Three Leds (0,1,2) red, green, blue has been shown with groups of pixels. Neighbour links are drawn with green lines. In MWSN the same effect of send and receive tasks are encoded with green and red circles. Figure 4 shows static sensor nodes in the GUI for TOSSIM for collection tree protocol (CTP)[1] as EasyCollection application[1] in TinyOS. Mobile sensor nodes are shown in Figure 5. This is the simulation of RadioSenseToLeds nesC application. RadioSenseToLeds samples a platform’s default sensor-DemoSensor at 4Hz and broadcasts this value in an AM packet. Other node that hears a broadcast displays the bottom three bits of the value it has received. In Figure 5, green circle denotes send, and red circle denotes receive. Three leds blink, shows that no packet is dropped. A node has emerged from the top left corner and all nodes have random waypoint motion (rwp). It also shows overlapping of communication area (hence more interference) of different nodes due random motion.
411
412
Atrayee Gupta and Sarbani Roy / Procedia Technology 10 (2013) 409 – 416
Fig. 2. Activity Diagram of the above
Fig. 3. Static wsn simulation
Fig. 4. Simulation of CTP as easy collection application
Atrayee Gupta and Sarbani Roy / Procedia Technology 10 (2013) 409 – 416
Fig. 5. Visualizer for simulator TOSSIM showing mobile sensors
3. 3D Visualizer for Real Data This section presents the design and implementation of 3D visualizer for real data collection in WSN. 3.1. Design or Top Level Architecture of 3D interface We used scene graphs [7] which are well known for game engine applications to model a 3D environment. A scene graph is a data structure with collection of nodes, arranged hierarchically in a graph or tree structure. The parentchild relationship of nodes helps to manage the behaviour in group. Each node behaves as entity or object in the scene, and automatically inherits the attributes and behaviours of parent as specified in object oriented programming (OOP). The main architecture uses link lists, arrays in sequential way to show the change of behaviour in child when parent is affected. There are also methods to handle systems input-output events in most efficient ways. For example, linear search algorithm is used in single interaction of an object with an input/output event. In more complex forms hierarchical-object structure is used (like in Alice) [8]. We developed our 3D framework using this technique. The GUI interface developed in Alice consists of hierarchical collection of objects with world as root node. Each shape (example of a virtual sensor) is viewed as object with its own set of attributes and methods and also has some property inherited from its parent. The proposed 3D scheme presents a virtual network, which mimics the behaviour of realnetwork, to the users. Users can take a tour of the entire network, take readings from any particular graphical sensor object, which fetches current-reading (like temperature, pressure, light, vibration, humidity, etc) from real sensor in background network. As the whole network is displayed in 3D, the acceptance is more than 2D usual display. 3.2. Lower Level Architecture The internal connection with proposed 3D interface and the underlying sensor network occurs in sequential steps. At the WSN, application (nesC) obtains data from the sensor nodes, routes them to base station(BS). At BS, application transfers the byte stream to serial port of terminal computer. At terminal, packet sniffer applications transform byte stream into high-level language(Human readable)form. Then finally the proposed 3D interface application (patched with TinyOS) obtains the real time data. Thus, when user asks for readings from a particular sensor node object by a mouse click event, TinyOS in turn makes connection with the sensors, reads the data and sends it to upper layer. We installed sense application on iris motes (connected with mts 400/420 cc sensor board). A base station (connected with a mib520 gateway interface board) is used for terminal connection. At the lowest level the sense application module follows a sequence of action specified by components and interfaces of nesC application. Event boot starts the radio layer through SplitControl, which in turn starts sampling the X-axis and Y-axis accelerometer data. The ADXL202 sensor (which measures acceleration) is abstracted by read interface of generic component Accel202C(). After the accelerometer data is gathered, Intersema driver module is called for barometric pressure and temperature readings. This module in turn calls SensirionSht11 to gather humidity samples of data. The final read-
413
414
Atrayee Gupta and Sarbani Roy / Procedia Technology 10 (2013) 409 – 416
Done event packs the data in payload of Active Message and transfers it to BS. sendDone() method of AMSend again starts the entire cycle by calling read command of 2-Axis accelerometer. The Sense application is accompanied by header file AppsMessage.h. The significance of this file is that the variables defined here are converted to intermediate communication parameters which are used to obtain the sensed data later on. It contains variable of type nx uint16 t for temperature data (and also along with it, other variables to read sensed data). In the sense application we mention (Makefile) how to convert the AppsMessage.h to AppsMessage.java by mig tool of TinyOS. Thus when make iris is executed (compiled) a AppsMessage.java file is created from this file. AppsMessage.java acts as an interface that contains get and set methods to access or modify the sensed temperature (and other sensor data). The data read by the motes are raw ADC values which are to be transformed to actual temperature (humidity,light,vibration,etc) by a transfer function. We got the information of bit values of ADC (for example 10 bit, 12 bit etc) from data sheet and we converted the sensor readings (from voltage). At the next stage a message listener application listens to AppsMessage.java, read sensed values and pass it to our 3D java interface. An intermediate application (packet source) acts as a sniffer and listens for a byte stream from the BS. The proposed 3D user application can call the message listener to listen to packet source like simple serial interface (there are different types of packet source like simple serial interface or TCP/IP packet source in TinyOS). However serial interface packet source uses a single connection only. We have used serial forwarder in this case so that multiple client can log in and get the data. Serial forwarders can also be used to connect to network to access data. This packet source directly communicates with the serial port and buffer the data packets. Serial Forwarder is a strong java based tool, which connects to serial port on one hand (serial port receives all the binary data streams from Base Station) and in other hand connects to proposed 3D model. This proposed 3D model can also be connected over the Internet via Serial Forwarder. This underlying architecture finally creates a TCP socket, which in turn ultimately connects to WSN. 3.3. Implementation This section shows which modules and objects are interacting, when the application (3d display) starts, user asks for specific information by selecting a virtual sensor node object. When the main application starts, an instance of Program class calls Scene class (Alice), and a user GUI is created with predefined attributes and methods. The Scene class defines the look and feel of the environment and is activated by setActiveScene (Alice). The main executes and presents the environment. The object of Scene class creates objects of different shapes, that we see as a 3D display. Here the Scene.java (Alice) is modified to handle or call AppsMessage Listener. It instantiates an object (AppsMessageListener) which implements TinyOSs MessageListener [9] interface. It provides abstraction to handle the entire communication process. It calls Phoenix Source to create socket to connect to packet source - Serial Forwarder at port 9003. We started the Serial Forwarder with port 9003 as server port (example, java .net.tinyos.sf.SerialForwarder -port 9003 -comm serial@/dev/ttyUSB1:iris) and also started our 3D application. Communication framework of TinyOS forms layered abstraction where one layer hides the direct access of packets. Packet Source (serial port, TCP socket, serial forwarder) acts as source and sink as applications can send and receive packets to nodes. PhoenixSource built on top of it handles automatic reading, dispatching of the packets. Phoenix Sources are created by Build Source class. Together they create a socket which connects to the Serial Forwarder. MoteIF class sits on top of the Phoenix and provides an application-level Java interface for the communication purpose. Protocols are implemented in between two communicating parties by simple handshaking parameters, for e.g a simple string starts the communication. Hence, in short Serial Forwarder (sf) reads data from base station, 3D application, which monitors any data packet on sf (port 9003) reads and displays this sensed data. Our application which implements MessageListener interface provides mechanism to handle received messages. Implementing class AppsMessage defines messageReceived() method and it is meant to signal or read packets from received message(AppsMessage.java). Again, data read from Serial Forwarder port is raw data from ADC. This is converted in our application into a user accept able form by transfer functions. registerListener() method of MoteIF connects the message from node to a MessageListener, which in turn actually accesses the data. Everything is ultimately mapped to socket connection or serial communication to send and receive messages. Other important methods of Scene class (created in Alice), which listens and responds I/O event are MouseClickedOnObject() and getModelAtMouseLocation(). These two methods provide checking when user interacts and produces change in property. For example, when mouse clicked on a virtual sensor object on 3D application it ”says” humidity
Atrayee Gupta and Sarbani Roy / Procedia Technology 10 (2013) 409 – 416
percentage. Attributes of child objects can be varied accordingly and can provide data directly from sensor network. Figure 6 describes the entire process.
Fig. 6. Modular details of the entire approach
Hence when user generates an event with mouse click, appropriate event-handler responds and reports back with current data from network. This is how we created a simple 3D GUI interface (a shell script provided by Alice is generally used to run the entire application. It is modified to run our application) with TinyOS-2.1.1 with some real life application and a look and feel of real environment. 3.4. Demonstration Interesting feature of this 3D model is that we can create an application which monitors the data packet in WSN network and can get the data path like MViz application of TinyOS. This will be of immense importance, because it can show the real-time network graph in three dimension and also can facilitate research of wireless sensor network. Users can get the real time data in 3D. Figure 7 demonstrates an application using proposed 3D visualizer. 4. Related Work Previous works of similar kind include [10]. Authors of paper [11] provide a detailed description of 36 available simulators which included code level simulators like TOSSIM to application level simulators. Most of them have graphical user interface. A few [11] also supports the mobility feature. Some of them do not have cross platform support which is disadvantage and also the simulation is not fast enough. Features differ with their implementation language and some are crash prone well others are less maintained. Some of these simulators even provide three dimensional visualization. This paper not only vividly describes the internal architecture and gives a technique to facilitate the building of TOSSIM based GUI with mobility extension but also provides a method to integrate real-time network 3D visualizers with TinyOS 2.x.
415
416
Atrayee Gupta and Sarbani Roy / Procedia Technology 10 (2013) 409 – 416
Fig. 7. Data read from the real sensor in the lab
5. Conclusion As graphical simulators helps experimentation with the algorithm before actual implementation and also help to anticipate some modified behaviour of the system, we developed visualizer for TOSSIM. 3D display of information is important in determining weather-wind, soil erosion patterns and ground vegetation, thermal sensing, in study of under water ocean floors, and in surveillance and research of evolutionary map of earth for GIS projects. It is helpful for remote monitoring, determining obstacles in an area, and traffic movements. This kind of user friendly application can take a tour of the entire place, pick and select desired object, generate alert and display current data. Complex applications like a network monitor can also be created to study network parameters like path of data packet or a network graph. Considering all these cases, we devised a 3D visualizer to map real time data into virtual environment in TinyOS. Therefore, both the contributions are useful in the study of simulated and real time network behaviour for TinyOS based applications. References [1] TinyOS, http://tinyos.stanford.edu/ u tinyos-wiki/ i index.php/ p TinyOS Documentation Wiki [2] David Gay, Philip Levis, David Culler, Eric Brewer, ”nesC 1.3 Language Reference Manual”, July 2009. [3] Philip Levis, Nelson Lee, Matt Welsh, and David Culler, ”TOSSIM: Accurate and Scalable Simulation of Entire TinyOS Applications”, In Proceedings of the First ACM Conference on Embedded Networked Sensor Systems (SenSys 2003), 2003. [4] Philip Levis, ”Experiences from a Decade of TinyOS Development”, In Proceedings of the 10th USENIX Symposium on Operating Systems Design and Implementation (OSDI), 2012. [5] Glade, https://glade.gnome.org [6] Pygtk, http://www.pygtk.org [7] Tutorial in Scene Graph, http://docs.oracle.com/ m .../java3d / d/forDevelopers/j3dguide / e/SceneGraphOverview.doc.html [8] Alice, http://www.alice.org [9] TinyOS MessageListener, http://www.tinyos.net/ t dist-2.0.0/ 0 tinyos-2.0.0/ 0 doc/ c/javadocc/net/ t tinyos/message/ e MessageListener.html [10] Mahmood Safaei, Abdul Samad Haji Ismail, ”Visualization, Data Analyzing and Energy Usage Analysis in Wireless Sensor Network Based on TinyOS and PowerTossimZ”, In International Journal of Computer Communications and Networks (IJCCN), Vol 1, No. 1, December , 2011. [11] Bartosz Musznicki and Piotr Zwierzykowski, ”Survey of Simulators for Wireless Sensor Networks”, In International Journal of Grid and Distributed Computing, Vol. 5, No. 3, pp.23-50, September, 2012.