... end-of-life practices identifies improvements to product design that reduce the
impact of manufactured .... 2.2.3 Design for Environment as part of Design for X..
DESIGN FOR ENVIRONMENT: A METHOD FOR FORMULATING PRODUCT END-OF-LIFE STRATEGIES
A DISSERTATION SUBMITTED TO THE DEPARTMENT OF MECHANICAL ENGINEERING AND THE COMMITTEE ON GRADUATE STUDIES OF STANFORD UNIVERSITY IN PARTIAL FULFILLMENT OF THE REQUIREMENTS FOR THE DEGREE OF DOCTOR OF PHILOSOPHY
Catherine Michelle Rose November 2000
© Copyright by Catherine M. Rose 2001 All Rights Reserved
ii
Abstract The research seeks to develop methodologies that aid in formulating the end-of-life strategies across a wide range of products. The analysis of current end-of-life practices identifies improvements to product design that reduce the impact of manufactured goods on the environment. There are two core parts of this research. First, the methodology determines what end-of-life strategy is possible according to the products’ technical characteristics. Second, the research validates the method by comparing the proposed end-of-life strategies with current industry practice. The resulting software, the End-of-Life Design Advisor (ELDA), guides product developers to specify appropriate end-of-life strategies. The product end-of-life strategies include reuse, service, remanufacture, recycle (with disassembly) and recycle (without disassembly). Case studies from various industries detail the outcome of a product’s end-of-life (i.e., what happens to a cell phone when it no longer functions or is outdated?). These case studies came from Japan, Korea, United States, and Europe. The product characteristics that influence the end-of-life outcomes the most are product wear-out life, technology cycle, level of integration, number of parts, design cycle and reason for redesign. ELDA succeeded in classifying end-of-life strategies in agreement with industry best practices for 86% of the products. The research compares the strategies these companies have taken in implementing new environmental policies and to discover the most streamlined and cost-effective method for moving towards environmentally friendly product designs. By understanding better the end-of-life strategy appropriate for the product, the proposed method can help the company develop appropriate and profitable end-of-life strategies for their unique position, systematically.
iv
Acknowledgments In terms of actual subject matter, Kos Ishii and Ab Stevels, my doctoral thesis supervisors, gave me a great deal of support. They combined expertise, practical orientation, writing talents and thoroughness, thus forming the ideal team to help me obtain my doctorate degree. I was able to learn a great deal through my interaction with Kos and particularly appreciate his support of my working on my dissertation from as many countries as possible. I recognize and thank Ab profusely, for without his insight and perseverance, this dissertation might still be in rough draft form. I am also grateful to members of my committee, Sheri Sheppard and Rolf Faste. I thank Sheri for research guidance and leadership of the Mechanical Engineering’s Women’s Group. Rolf gave me the skills to exploit my ‘out-of-the-box’ ideas. I would like to acknowledge the guidance offered by my lab mates – Kurt, Larry, Shun, Shibata-san, Seung, Brent, Steve and Mark. Special thanks go to Venetia and Lin for their dedication and perseverance to software development. Special recognition goes to my overseas collaborators who provided value to my research and experiences to my life -Casper, Arjen, Jaco and many others at the Design for Sustainability Group at Delft University as well as Norm and KJ at MITI Mechanical Engineering Laboratory. Many thanks to my friends who offered friendship, love, encouragement and guidance: Nancy, Ali, Ajit, Mitch, Karin, Jason R., Khim, Jason I., Fig, Carlotta and Aubrey. Many thanks to my ‘moms-away-from home’ – Annet, Chris and Maria. A big hug of thanks goes to my ME women colleagues who helped me through the past couple of years of graduate school. Special appreciation goes to Dr. Johnson at North Carolina State University who pushed me to pursue a doctoral degree. Matt's encouragement was the biggest support that pulled me through this endeavor. His perspective and experience were a great help during some very challenging periods. I am grateful for his patience as I traveled everywhere except where he was. Hopefully, I will stay in one place for a while.
v
Finally, I want to acknowledge my family. The love and dedication they poured into my education is irreplaceable. I would like to thank my familial ‘role models’, the females earning doctoral degrees along side of me: Katherine ‘Winky’ Pasour, N. Meiki Rose and Laura Rose. You have all been sources of encouragement and support. My dearest thanks go to my parents, Nell and Bill Rose. I recognize my parents for raising me in a wonderful environment that continually fostered intellectual curiosity, work ethic and personal growth. Thank you so much for your unconditional support throughout my never-ending educational pursuits. Thank you all very much.
vi
Table of Contents 1
INTRODUCTION ..................................................................................................... 1 1.1 MOTIVATORS FOR ENVIRONMENTAL CHANGE.......................................................... 1 1.1.1
Customer Pressure.......................................................................................... 3
1.1.2
Competitive Forces......................................................................................... 5
1.1.3
Legislation Initiatives...................................................................................... 6
1.2 PURPOSE OF CURRENT RESEARCH ON END- OF-LIFE STRATEGIES ............................... 8 1.2.1
Issues and Challenges................................................................................... 10
1.2.2
Key Research Questions............................................................................... 12
1.2.3
Contribution made by this work .................................................................. 13
1.2.4
Research Approach....................................................................................... 14
1.3 FOCUS AND SCOPE.................................................................................................. 15 1.4 OUTLINE OF DISSERTATION .................................................................................... 16 1.5 CONCLUSION.......................................................................................................... 17 2
RESEARCH FOUNDATIONS................................................................................ 19 2.1 ENVIRONMENTAL FOUNDATIONS ........................................................................... 19 2.1.1
Industrial Ecology......................................................................................... 19
2.1.2
Life Cycle Engineering ................................................................................. 20
2.1.3
Life Cycle Analysis ....................................................................................... 22
2.2 ENGINEERING DESIGN F OUNDATIONS .................................................................... 23 2.2.1
Design ........................................................................................................... 23
2.2.2
Design for X .................................................................................................. 25
2.2.3
Design for Environment as part of Design for X.......................................... 27
2.3 BUSINESS STRATEGY FOUNDATIONS ....................................................................... 28 2.4 CONCLUSION.......................................................................................................... 31 3
PRODUCT END-OF-LIFE STAGE......................................................................... 32 3.1 PRODUCT END-OF-LIFE CONSIDERATIONS .............................................................. 32 3.1.1
End-of-life Definition and End-of-Life Strategies ........................................ 32
3.1.2
Justification of Hierarchy of End-of-Life Strategies ..................................... 35
vii
3.1.3
Knowledge of End-of-Life Strategies............................................................ 41
3.2 PRODUCT FOCUSED END- OF-LIFE RESEARCH .......................................................... 43 3.3 PROCESS AND T ECHNOLOGY FOCUSED END- OF-LIFE RESEARCH............................. 45 3.3.1
Remanufacturing.......................................................................................... 45
3.3.2
Disassembly .................................................................................................. 46
3.3.3
Recycling through mechanical methods ...................................................... 48
3.4 CONCLUSION.......................................................................................................... 49 4
END-OF-LIFE DESIGN ADVISOR ....................................................................... 51 4.1 BASIS FOR END- OF-LIFE DESIGN ADVISOR .............................................................. 51 4.1.1
Case Studies.................................................................................................. 54
4.1.2
Application of CART to build backbone for ELDA ..................................... 55
4.1.3
ELDA Internet Tool ...................................................................................... 57
4.2 EVOLUTION OF TECHNICAL PRODUCT CHARACTERISTICS....................................... 59 4.2.1
Preliminary factors influencing to end-of-life strategies.............................. 60
4.2.2
Original Technical Product Characteristics.................................................. 61
4.3 FINAL ANALYSIS..................................................................................................... 65 4.3.1
Case Studies.................................................................................................. 65
4.3.2
Final Technical Product Characteristics....................................................... 66
4.3.3
Resulting Classification Methodology ......................................................... 78
4.4 CONCLUSION.......................................................................................................... 81 5
EVALUATION AND VALIDATION .................................................................... 82 5.1 EVALUATION OF RESULTS....................................................................................... 82 5.1.1
Interpretation of Results............................................................................... 82
5.1.2
Robust Data Acquisition............................................................................... 84
5.1.3
Design control of product characteristics..................................................... 86
1.2 VALIDATION METHOD............................................................................................ 88 1.2.1
Comparison between ELDA and Industry Practice..................................... 91
1.3 ADDITIONAL CASE STUDIES .................................................................................... 97 1.4 LESSONS LEARNED FROM EVALUATION AND VALIDATION.....................................101 1.5 CONCLUSION.........................................................................................................103 6
ELDA AND OTHER PERSPECTIVES ..................................................................104 6.1 NEED TO ASSESS BUSINESS ISSUES ...........................................................................104
viii
6.2 ENVIRONMENTAL VALUE CHAIN ANALYSIS ..........................................................105 6.3 CASE STUDIES OF END-OF-LIFE SYSTEMS ................................................................108 6.3.1
Voluntary Take Back Systems .....................................................................110
6.3.2
Legislation Mandated Systems....................................................................114
6.4 MARKET BASED DEVELOPMENTS ...........................................................................117 6.4.1
Functionality-Time Diagram.......................................................................119
6.4.2
Effect on product end-of-life .......................................................................121
6.5 CONCLUSION.........................................................................................................123 7
IMPLICATIONS ON DECISION MAKERS ........................................................124 7.1 DECISIONS RELATING TO END- OF-LIFE SYSTEMS .....................................................124 7.1.1
Influencing these decisions..........................................................................125
7.2 PRODUCT DESIGN ..................................................................................................127 7.2.1
Focus on technical issues .............................................................................128
7.2.2
Focus on business issues.............................................................................131
7.3 RECYCLERS ............................................................................................................132 7.4 POLICY MAKERS ....................................................................................................134 7.5 CONCLUSION.........................................................................................................137 8
CONCLUSIONS AND FUTURE WORK ..............................................................138 8.1 CONTRIBUTIONS OF RESEARCH ..............................................................................138 8.1.1
Main Objective.............................................................................................138
8.1.2
Summary of End-of-Life Design Advisor ...................................................138
8.2 SIGNIFICANCE OF CONTRIBUTIONS ........................................................................140 8.2.1
Usefulness to Industry.................................................................................141
8.2.2
Usefulness to government and non-governmental institutions .................142
8.2.3
Usefulness to other design research............................................................143
8.2.4
Universal application ..................................................................................144
8.3 DIRECTIONS OF FUTURE RESEARCH .......................................................................145 8.3.1
Minor Changes to ELDA .............................................................................145
8.3.2
Reverse Application of ELDA .....................................................................145
8.3.3
Methodology for EVCA...............................................................................146
8.4 FINAL REMARKS ....................................................................................................146 BIBLIOGRAPHY ............................................................................................................147
ix
APPENDICES .................................................................................................................155 APPENDIX I. TERMINOLOGY...........................................................................................155 APPENDIX II. ADDITIONAL DATA FOR ENVIRONMENTAL IMPACT ..................................157 APPENDIX III. CLASSIFICATION ANALYSIS....................................................................159 APPENDIX IV. ELDA DEVELOPMENT ...........................................................................165 APPENDIX V. VALIDATION DATA ..................................................................................171 APPENDIX VI. SAMPLE INTERVIEW QUESTIONS ............................................................173 APPENDIX VII. BIOGRAPHICAL NOTES...........................................................................175
x
List of Tables Table 2-1.Ecodesign Matrix .............................................................................................. 30 Table 3-1. Definitions of End-of-Life Strategies................................................................ 33 Table 3-2. Impacts and bonuses identified by environmental impact analysis ............... 37 Table 3-3. Environmental Impact Reults for Television ................................................... 39 Table 3-4. Environmental Impact Results for Philips Products ....................................... 39 Table 4-1. Types of products studied (by year)................................................................ 55 Table 4-2. Evolution of Product Characteristics (considered for establishing ELDA)..... 59 Table 4-3. Original Factors influencing end-of-life strategies .......................................... 60 Table 4-4. Original Technical Product Characteristics..................................................... 62 Table 4-5. Complete List of Case Studies and Product Characteristics ........................... 65 Table 4-6. Final Technical Product Characteristics with input ranges............................. 67 Table 4-7. Product Wear-out Life and Technology Cycle ................................................ 70 Table 4-8. Product sector characteristics .......................................................................... 72 Table 4-9. Examples of possible design changes .............................................................. 75 Table 4-10. Variables used in CART................................................................................. 78 Table 5-1. Variation in Responses for Cell Phones........................................................... 85 Table 5-2. Robustness Validation ..................................................................................... 85 Table 5-3. Product characteristics and discipline that controls........................................ 86 Table 5-4. End-of-Life Strategies and Critical Product Characteristics............................ 87 Table 5-5. Definitions of End-of-Life Strategies................................................................ 89 Table 5-6. Strategy classified by ELDA and the observed industry practice................... 90 Table 5-7. Percent agreement between Original and Final and industry best practice... 91 Table 5-8. Degree of Agreement and Disagreement -- Number (Percentage) ................. 93 Table 5-9. Comparison of ELDA and best industry practice ........................................... 94 Table 5-10. Comparison of Best and Average .................................................................. 96 Table 5-11. Philips case studies and product characteristics............................................ 98 Table 5-12. ELDA and Best End-of-Life Treatment Results ............................................. 99 Table 5-13. Comparison of current end-of-life treatment and strategy recommended..100
xi
Table 6-1. Relationships among Players..........................................................................106 Table 6-2. Need for Mandatory and Voluntary end-of-life systems ...............................109 Table 6-3. Reasons for product obsolescence. .................................................................119 Table 6-4. Functionality of IT product .............................................................................121 Table 7-1. Efforts needed from Product Management, Recyclers, and Policy Makers...127 Table 7-2. Prioritization of Tool Usage............................................................................128 Table 7-3. Design Focus areas for End-of-life Strategies .................................................129 Table 7-4. Example Tools for Design Improvements ......................................................130 Table 7-5. Alignment of Recyclers...................................................................................133 Table 7-6. ELDA recommendation according to product sectors ...................................134 Table 7-7. Types of Incentives for End-of-life Systems ...................................................136
xii
List of Figures Figure 2-1. Generic representation of product life cycle .................................................. 21 Figure 2-2. Representation of design process................................................................... 23 Figure 2-3. Degrees of freedom in various stages of design (Design for Environment).. 24 Figure 3-1. Modified Ricoh Comet Diagram depicting product end-of-life strategies.... 34 Figure 3-2. Environmental impact of End-of-Life Strategies............................................ 40 Figure 3-3. Environmental impact of End-of-Life Strategies compared to disposal........ 41 Figure 4-1. Timeline of Research ...................................................................................... 53 Figure 4-2. Timeline of Research – Case Studies .............................................................. 54 Figure 4-3. Timeline of Research – CART Analysis.......................................................... 56 Figure 4-4. Example ELDA input screen.......................................................................... 57 Figure 4-5. Resulting classification................................................................................... 64 Figure 4-6. Product wear-out life and technology cycle with product sectors identified 72 Figure 4-7. Reason for Redesign Percentages................................................................... 76 Figure 4-8. Final Classification Tree ................................................................................. 80 Figure 5-1. Wear-out life and technology cycle with end-of-life strategies ..................... 83 Figure 5-2. Classification Results by end-of-life strategy................................................. 84 Figure 5-3. Percentage agreement between ELDA and industry practice....................... 92 Figure 5-4. Observations of End-of-Life Strategies .......................................................... 93 Figure 5-5. Comparison between ELDA and industry practice....................................... 94 Figure 5-6. ELDA, best and average industry practice .................................................... 96 Figure 5-7. Grouping of case products according to wear-out life and technology cycle99 Figure 5-8. Relationship between ELDA and actual practice .........................................102 Figure 6-1. Relationship between ELDA and actual practice .........................................104 Figure 6-2. Representation of relationships among players............................................107 Figure 6-3. Kodak Single Use Cameras...........................................................................111 Figure 6-4. HP Printers ....................................................................................................111 Figure 6-5. GE Aircraft Engines.......................................................................................112 Figure 6-6. Philips Medical Systems................................................................................113 Figure 6-7. Siemens Nixdorf IT equipment.....................................................................113
xiii
Figure 6-8. Dutch Television take back ...........................................................................115 Figure 6-9. IT equipment take back in Germany (Proposed)..........................................115 Figure 6-10. Packaging Take Back in Germany...............................................................116 Figure 6-11. Generic functionality changes over time.....................................................120 Figure 6-12. Influence of functionality over time............................................................122 Figure 8-1. Comparison between ELDA and LCA method ............................................141
xiv
1
INTRODUCTION
This chapter gives a short description of the motivators for including environmental initiatives in business decision making and practices. It then introduces objectives, focus and methodology of this research on design for environment. Finally, an explanation of the dissertation structure concludes Chapter 1.
1.1 Motivators for Environmental Change Concern for future generations and alarming rates of nonrenewable resource consumption provide the impetus for research on sustainability and improving our natural environment. Countries and companies are establishing goals for achieving sustainable development and reducing resource consumption in hopes of preserving the natural environment for future generations. The environmental problem is an extensive, complex problem, and some example areas of study are energy consumption, material/resources use, recycling, and environmentally relevant substance control. In the electronics industry, these are of particular concern because electronic products, by nature, consume energy. Waste management is crucial as landfills close and populations grow (Pohlen et al. 1992). Further, these products are being disposed of at higher rates than historically because of increasing speed of technology developments and changes in how consumers interact with products. Control of environmentally relevant substances for electronic products is critical because printed circuit boards are concentrating potentially toxic substances. Halogenated flame retardants are used in plastic housings as protection from the threat of electrical fires. However, incineration of these plastics can produce toxic dioxins (Taberman et al. 1995). All of these concerns combine to yield a crucial research subject – end-of-life treatment of electronic products. Possible solutions to the challenge of end-of-life treatment of electronic products must balance the positives and negatives of three partly conflicting goals: • • •
reducing landfilled material, maximizing recycling, and controlling hazardous materials
From the environmental perspective, many industrial activities have been regulated since 1970s. The main focus of legislation has been on production processes and industry 1
sectors involved in basic production (chemicals, materials like steel, paper, etc) (Stevels 2000b). The solutions to problems were sought through ‘end of pipe’ cleaning through investments in machinery and equipment. There has been extensive research into methods to reduce cost or environmental impact at processing or manufacturing stages. Recently, efforts have moved to eliminate the environmental problems in processes earlier by reducing environmentally relevant material use and processing steps, called cleaner production. During this same time, little or no regulation existed for products or the design of products. The only slight hint at product regulation are bans on landfilling of certain products (appliances or televisions, lead acid batteries, for example), and only recently the take back or recycling targets for certain products. Currently, the research for product improvement is lagging far behind process improvement work. The present work shows improvements and methodologies to help leaders make more knowledgeable decisions regarding product design and the effect at end-of-life. Learning from the past, end of pipe legislation had limited effect on improving environmental conditions. More successful solutions address the root causes or seek to address the causes instead of the effects, so for example taking them into account when the product is designed originally. End of pipe remediation was based on the ‘polluter pays’ principle. This was problematic because it is difficult to determine who was the polluter and many companies were incorrectly burdened with exorbitant costs. However, in recent developments, the ‘polluter pays’ principle has been altered to ‘producer pays’ principle, thus transferring the burden for many of the activities of modern society to manufacturers of products that may then be passed to consumers. In the long term, society has to bear the burden of environmental improvement and can help manage this through eco-efficiency concepts. The concept of eco-efficiency has changed the approach of many forward-thinking companies. Eco-efficiency means not only ecological efficiency, but also economic efficiency, making a direct connection between environmental targets and market opportunities (Cramer et al. 2000). Using eco-efficiency involves a chain-oriented approach, which requires more communication and cooperation between partners in the product chain (for instance, between suppliers and/or customers). The eco-efficiency 2
approach becoming a part of the strategic planning of the company is much more important than the more operational environmental management approach currently in place in most companies. Experiences gained in the application of eco-efficiency approach have shown that it is possible to create win-win situations. Eco-efficiency improvements can lead to cost reduction, strengthen the market position of existing products, extend products to new markets, avert criticism by external stakeholders, and increase the possibility of the company’s surviving in the long-run (Cramer et al. 2000). Instead of only relying on the ‘producer pays principle,’ a more realistic and appropriate option for future success is for joint responsibility by consumers, producers, governments, and recyclers. This joint responsibility should be distributed in such a way that those who are able to manage the most eco-efficiently take responsibility. It is important to understand the drivers behind the increase in research to increase ecoefficiency. The following sections outline the reasons why a company should take steps to address environmental concerns, more specifically end-of-life concerns. The reason for incorporating design for environment depends on the strategy for each company. Some companies are defensive, proactive or cost driven in their reactions to external developments related to environment (i.e., social pressures, additional legislation or taxes). The following three sections will briefly outline these motivators so that the reader can gain insight into why companies and organizations are involved in these efforts. Reasons pushing the focus on product end-of-life are consumer attention leading to increased market advantages, reducing potential costs and risks and anticipating pending legislation.
1.1.1
Customer Pressure
Recent surveys have shown that when a private consumer is purchasing a product the environment is placed further up their list of purchasing criteria (Ottman 1998). Research has shown that both in Europe and the United States attitudes of the buying public towards environment can be subdivided as follows (Stevels 2000a): •
Approximately 25%- strong environmental motivation; will pay higher prices for ‘demonstrated environmental improvement',
3
• •
Approximately 50%- positive for environment but are not prepared to pay higher price, and Approximately 25%- neutral or negative for environment; perceive products with same price as traditional products as products with lower performance.
Environment alone will not sell products but in combination with other improvements, at least 65% of consumers will be interested and chances to increase market share are good. Ottman expects that enhanced primary benefits in performance, convenience, price and safety, for example, that accompany environmental improvements to continue to propel the market for environmentally preferable products in the years and decades to come (Ottman 1998). Where competing companies' products are closely matched, the fact that a particular company has included environmental criteria into the product’s design may sway the customer to purchase that product over and above the product of competitors (Lucacher 1996). In this tough competitive climate, environmental compatibility breaks ties at the shelf, where pragmatic consumers purchase those products that can be recycled or otherwise safely disposed of in their communities (Ottman 1998). A new situation occurs where an increasing number of companies see the environmental aspect as an issue that could improve the market position of their products (Nilsson 1998). With the pressures on companies to ‘go green’ and the associated research and implementation costs, companies are looking for some kind of financial pay-back (Clegg et al. 1994). Efforts and pressure from industrial customers can have a great effect in bringing environmental improvements to the marketplace (e.g. U.S. government energy requirements bringing ‘Energy Star’). Environmental demands made by industrial customers are powerful drivers for the environmental improvement of the company approach and its products. Large companies cannot always make their suppliers liable for the environmental aspects of their products; therefore, companies increasingly request information from their suppliers. In general, an industrial customer is able to influence a company more than an end-user. Industrial customers want their suppliers to contribute to their environmental success (and image). On the other hand, boycotts of products organized by consumer organizations or environmental NGOs have considerable impact on company behavior. 4
Another important factor, relating to consumers and more broadly to stakeholders, is a concern for the company’s image. Many existing end-of-life systems were pushed or motivated by negative publicity directed at the company. As consumers and other stakeholders press for continued environmental improvements, firms competing in the external marketplace are stepping up their efforts to provide ‘environmental value’ to their customers through new products, services, and organizational arrangements. It is possible to improve the image of the product and company by communicating environmental quality of a product, good reports in consumer testing or better behavior of the company. It is also good publicity to demonstrate the company’s environmental goals and progress through publishing an annual environmental report (Stancyzk 1995).
1.1.2
Competitive Forces
Companies implement environmental initiatives that reduce operating costs or increase quality. Increasing its profitability is still a main driving force of a company. The increasing cost of materials, related to scarcity in natural ecosystem, means the manufacture of parts is more expensive and efforts to reduce part weights and size gives substantial reduction in manufacturing costs. As energy costs continue to rise, companies seek to eliminate product steps to reduce energy consumed. In addition, efficient management of water and other auxiliary materials during production can also achieve a considerable saving in costs. As a result of stricter legislation on disposal practices, the costs of disposal of hazardous and non-hazardous waste have risen over the last decade. A financial benefit can also be achieved in time by generating less waste and by reducing the fraction of hazardous waste. Business has opportunities to reduce cost by examining product end-of-life, by increasing market share and bringing insight to product usage and disposal. The risks associated with introducing products have increased because of consumer product safety obligations and fear of possible lawsuits. Companies must make investments during product development to prove products do not pose threats to consumers during use, do not emit toxins after product disposal. The responsibility for hazardous material control and worker safety encourages companies to eliminate hazardous substances in their product and processes. Inappropriate management of
5
these risks can prove costly for companies, causing them to lose to competitors who are better able to manage risks. Failing to take steps forward in environmental initiatives may mean loss of competitiveness in the market place. Competitors that make progress in environmental issues will put more pressure on the ‘fence-sitters’ to take steps to improve environmental performance. Within the companies, management is developing environmental strategies, roadmaps and programs (Stevels 2000b). The competitive field is now using environmental issues in marketing, quite successfully. Even environmental management systems are moving quite rapidly from an element of quality to a standard (Stevels 2000b). The development of new technology has allowed companies to reduce cost and improve environmental performance. The application of smart materials, with novel interlocking abilities, reduces manufacturing and disassembly costs. More powerful integrated circuits allow for smarter software and lower energy costs, reducing usage costs and environmental impact. The development of software has given designers more tools, such as Computer Aided Design (CAD), Finite Element Analysis (FEA), and Virtual Reality, to help expedite the detail design stage, reducing the development costs of products. New technology development is crucial to producers because in all of the years of producing products, this is the first time producers will have to manage what happens to a product at the end-of-life. Companies have experience in producing and releasing new products and providing customer service, it is a new paradigm for them to be responsible for products at the end-of-life stage. As changes are made, new models to understand and analyze these changes are needed.
1.1.3
Legislation Initiatives
In the middle of the 1970s, stricter environmental legislation was spurred by precipitating environmental crises. Legislation has increased from this time to constrain further environmental effects (Welford et al. 1993). The end of pipe regulation restricted types of materials that can be discarded, as well as how and where they can be discarded. Examples of regulation include Clean Air Act, Clean Water Act, and the
6
Resource Conservation Recovery Act. Much of this legislation has targeted activities by industry, has high cost penalties, and thus encourages companies to respond. Legislation is forcing industry to find alternative environmentally preferred ways of dealing with these problems (Matthews 1993). The most recent developments in environmental regulation target electronic products. Proposed legislation for extended producer responsibility, or product take back, would require producers to address the end-of-life stage of their products. The European Union’s proposal (to European parliament and Council of member states) requires producers to ‘take back’ electrical and electronic equipment (EU-DG-XI 2000). Many other countries are discussing, preparing or have already enacted take back legislation. U.S. companies, selling products in many European markets, are now required to establish systems to take back products from consumers. The currently operating Dutch take back system for large electronic appliances started in January 1999 and smaller products started in April 2000. The consumers pay a take back deposit to the stores when they purchase new products. The products are collected at collection centers, managed by the municipalities. There is curbside pick-up for some products. Most products are recycled by local recycling companies, who the share the profits or deficits with producers’ group. The general consensus in Japan is that to tackle environmental problems, industry, administration and the general public have to act together to achieve breakthroughs. Coming into effect in 2001, legislation in Japan seeks to achieve proper disposal of products with a united effort from organizations related to the production, manufacturing, distribution, consumption and disposal of products. The legislation requires the recycling percentages (by weight) for the following products: refrigerator (50%), air conditioners (60%), televisions (55%) and washing machines (50%) (Yamamoto 2000). The assumed logic is that if producers are financially responsible for end-of-life product management, producers will have a financial incentive to design their products with less hazardous and more recyclable materials. The logic does not always hold true. In many situations, the financial burden is passed on to the consumer. Many electronics companies are the global leaders in innovative design techniques that eliminate or 7
minimize adverse environmental impacts throughout the product life cycle, or that make the product easier to recycle at the end-of-life stage. This industry sector has also been a leader in the development of voluntary recovery programs to reuse, refurbish and recycle electronic products (EIA 1999). In the UK, the Industry Council for Electronic Equipment Recycling (ICER 1993) has been set up to develop a national waste strategy for electronic goods. The recycling organizations are Cycle for Germany, Suico for Switzerland and NVMP for the Netherlands. Companies such as IBM, DEC, Hewlett Packard, Rank Xerox and Grundig are already taking back used equipment, while Toshiba and Hitachi have research programs to reduce disassembly times (Copper 1994). While these are positive movements with respect to environmental improvement, there are many untold negative stories. Regulations are ‘leveling the playing field’ and offer therefore no opportunity for competitive advantage (Stevels 2000b). Competitors who can not comply with this sharpening government legislation are disadvantaged. Like earlier environmental regulations
that
prescribed
technological
responses,
mandates
on
producer
responsibility stifle innovative approaches and impose added costs on consumers (Scarlett 1999). It is necessary to understand the flow of tangibles (products and money) and intangibles in order to prevent unintended consequences of legislation and to develop regulation that is better adapted to the market forces.
1.2 Purpose of Current Research on End-of-Life Strategies Initially, Environmental Design (Ecodesign or Design for Environment) has been seen as a set of technical issues. For this reason, Ecodesign activities were positioned in product development departments of companies. Over the past decade, Design for Environment (DFE) has attracted steadily increasing attention throughout the world and in the United States (Ishii et al. 2000). Steps forward, in regards to environmental impact of products, are positive for the company. Inactivity is negative for the company, in terms of publicity and competitiveness. Inactivity or reluctance to change may result from lack of information about the future. Experience has shown that decisions must be made, even in the event of lacking information, in order to move forward. Companies do not realize that end-of-
8
life scenario can vary over time, but it is just because they do not have enough information to predict changes and how to deal with them (Boks 2000). Several studies are now describing end-of-life scenarios that yield benefit to the company on the basis of product end-of-life value. Companies should establish end-of-life systems out of self-interest. Managing product end-of-life treatment can be financially beneficial to a company, bring insight into product usage, and increase market share. Producers, such as Xerox, Kodak, Nike, Philips Medical Systems, are indeed making a profit on end-of-life systems. Collecting products at the end-of-life has given IBM an opportunity to examine usage and wear to improve product design. Kodak and Nike, not only make money through their end-oflife product programs, but also have improved company image and resulting market share for their contributions to the environment. As markets become more competitive, losing market share or stakeholder support can result from not establishing end-of-life treatment programs. Whether competitors move to set up programs earlier or only after it is required by legislation, starting a product end-of-life treatment program later could be more expensive. There are many reasons given for companies not establishing end-of-life systems, because they cost money, the retained risk of the product is too high, the competition is not doing it, and it is not part of the core business interests. Indeed establishing a product end-of-life take back system will cost money, but results have shown that it is possible to make substantial profits through this activity. Managing the risk of collecting and recycling the end-of-life products is a barrier to entry for smaller companies. A company’s reason for not implementing a program that a competitor is not doing it or it is not part of the core business interests are both contradicted when the program generates substantial revenues. The following section will outline the issues faced by companies establishing end-of-life programs for their products. These issues are addressed through this research and the proposed methodology given in section 1.2.2.
9
1.2.1
Issues and Challenges
In many companies, a strategy for developing end-of-life systems is lacking or could be enhanced. A systematic approach to incorporating the end-of-life concerns into product development needs to be developed. There are no approaches currently available that enable a systematic integration of the end-of-life concerns into all relevant phases of product development, in a holistic way. Product end-of-life management encompasses not only technical details, but it also requires a unified business approach. Building a strategy for end-of-life treatment of products is necessary in order to gain market share, adhere to legislation and maintain competitive advantage. 1. While successes in the field of Design for Environment have been made based on technical solutions, for example eliminating CFCs in manufacturing and use, reducing car pollution through adding catalytic converters; there are aspects of products that will require more than technical fixes. Previous research, described in detail in Chapter 2, has placed excessive emphasis on the designer and places responsibility on designers’ shoulders to fix items that are often out of their realm of responsibility. The research does not make recommendations to help product management
determine
appropriate
incentives
to
move
towards
better
environmental design. Most research, to this point, has been very fragmented. Depending on the particular researchers’ background, their work has focused on particular issues within the end-of-life system: for example, economics of recycling (Boks 2000), recycling percentages weighted by hazardous material content (Huisman et al. 2000b), remanufacturing guidelines (Das et al. 1999), CAD tools for disassembly assessment (Harper et al. 1998), disassembly line balancing operations (Gungor et al. 1999), end-of-life supply chain analysis (Uzsoy 1998), tools for nondestructive disassembly (Feldmann et al. 1996, Chiodo et al. 1999), and even tools for destructive disassembly (Masui et al. 1999). However, to date, few researchers are have looked at the picture from a holistic perspective. 2. Reuse, Service and Remanufacturing, as end-of-life strategies, have addressed relatively little in the research community (in fewer tools). Discussions concerning end-of-life systems have been very disjointed. A wide variety of perspectives and positions have been in conflict. The number of companies and organizations 10
involved in the take back discussions is large. For example, within the European Union discussions about consumer electronics product take back, involve over 30 organizations and companies. Managing and understanding the relationships and interactions between these entities is crucial for positive outcomes to the discussions. 3. Tailored solutions are not possible because of the differences in product characteristics. Most end-of-life recycling quotes have been based on industry sectors. Identifying the ideal strategy is necessary before outlining actions. This does not take into account that within sectors product technical characteristics vary greatly (e.g. the telecommunications sector that includes cellular phones, switching equipment and backup power systems). Recycling percentages to be realized depend not only on product characteristics but also end-of-life technology, industrial infrastructure and outlets for secondary materials. To optimize environmental gains and minimize costs, efforts in take back and recycling should be tailored to product sectors and types. Existing practice of end-of-life treatment does not obey sector divisions, but rather is based on the characteristics of products. By making legislation per industry sector, recycling companies will have to revamp their entire system, leading to inefficiencies. Understanding what is possible by current standards in recycling based on product characteristics will improve legislation, processing technology and design. 4. Much of the previous work makes recommendations on what companies should do, but no one has taken the opportunity to observe current company practices and improve and learn from their successes and failures. Observations of how business actually operates would reveal what is possible, what business struggles with and what business needs help with, rather than stating what business should do without seeking to understand what they already do. By examining company programs, research is able to learn from mistakes, understand problem areas, examine objectively the issues and combine these items into a structured methodology. 5. Some companies have developed eco-efficient end-of-life systems, to reclaim value from their products. However, some of these programs were developed in a defensive manner, reacting to consumer demands (Nike, Kodak); still others fell into the programs (HP, Xerox); and a small percentage established their end-of-life 11
systems based on historical observations (GE). However, replicating these systems to other products in their companies has not proven successful. A systematic method to develop end-of-life systems, taking into consideration the relationships existing within the company and outside the company is needed. Also by systematically analyzing the existing end-of-life systems, improvements can be made to increase profits, take back percentages and consumer satisfaction. 6. Circumstances outside the technical domain are hampering the goal of achieving the industry best practice for products. In some instances factors such as product cost, repair cost, functionality changes, recycled material prices, environmental regulations, availability of recycling facilities and feasibility of recycling technologies are limiting the wide-spread application of industry best practices. In depth examination of these factors will help achieve application of eco-efficient end-of-life strategies.
1.2.2
Key Research Questions
The research seeks to develop methodologies that aid in formulating the end-of-life strategies across a wide range of products. The analysis of current end-of-life practices identifies improvements to product design that reduce the impact of manufactured goods on the environment. There are two core parts of this research. First, the methodology determines what end-of-life strategy is possible according to the products’ technical characteristics. Second, the research validates the method by comparing the proposed end-of-life strategies with current industry practice. By better understanding the end-of-life strategy appropriate for the product, the proposed method can help the company develop appropriate and profitable end-of-life strategies for their unique position, systematically. The research approach is to: • •
use case studies to classify products’ end-of-life strategies and develop a methodology evaluate the current implementation of end-of-life systems in industry.
The ultimate goal is to communicate these results to (a) producers, (b) recycling companies and (c) policy makers.
12
1.2.3
Contribution made by this work
This research contributes to engineering knowledge by providing a design tool for use in industry; this tool is called End-of-life Design Advisor (ELDA). ELDA’s innovation focuses on using simple product characteristics to make end-of-life strategy decisions. ELDA succeeds in classifying products into end-of-life strategies in agreement with current best practices. ELDA links insights into product end-of-life based on recycling experiences with designers and product managers. This tool is applied in early stages of design when changes to the design are still possible. Product designers and managers might recognize that different products have different characteristics, but ELDA is the first to show that these differences control the possible end-of-life treatment of the product. ELDA considers the technical product characteristics controlled by product designers and managers, looking at the products as an issue conquered by technical solutions. Evaluation and validation of ELDA is through comparison between the classification method and the end-of-life treatment currently implemented by industry. The differences between the actual practice, both best and average, and the ELDA method shows that not all of the issues for end-of-life can be achieved by technical solutions, non-technical business items are also needed. ELDA is powerful, revealing in a very early stage of design that the end-of-life strategy of the product based on characteristics. ELDA looks objectively at the possible end-oflife strategies and reduces subjectively associated with developing product end-of-life systems. ELDA removes the product sector approach by removing function and emotional attachment to product (from ELDA’s perspective, electric generators are equivalent to cars; TVs are same as vacuum cleaners). An extension to ELDA is the functionality-time diagram that shows the influence of consumer behavior and market developments’ on product end-of-life strategies. A topic for future work in end-of-life treatment of products is through Environmental Value Chain Analysis (Rose et al. 2000c). Realizing that possible approaches for developing a product's end-of-life strategy are not dependent on technical considerations only, Environmental Value Chain Analysis addresses non-technical business considerations.
13
1.2.4
Research Approach
This section will describe the research methods that were used to develop ELDA. The research methods used include literature review, case studies and statistical analysis. The literature review is a research method that involves searching through books, journals, conference proceedings, newspapers, dissertations and CD-ROMs for published information on the field of research. The ecodesign research field is rapidly evolving and therefore this method of research continued throughout the entire period of work. Even though the research field is new, a substantial amount of literature already exists. The literature has been found comprehensive in some respects while incomplete in others. For example, reports on how current products are being recycled have been found limited in scope and number. Within design engineering, researchers prove hypotheses by extensive case studies. Most researchers examine product development teams before and after a change in design methodology to verify the efficacy of their approach. Typically this research is used for testing timesaving design methodologies or managing the creative design process. One strong area of the intended case studies is the diversity of products that will prove the wide application of the techniques and methodologies. A substantial amount of information has been collected through indirect and direct case studies. Indirect case studies include the case studies collected through the ELDA web tool, such as from ME217 graduate student projects and other professional contacts. Several direct case studies were collected during six months at Philips Consumer Electronics. Further information concerning product end-of-life treatment was gathered from reviewing corporate documents on the recycling of products, marketing and publicity documentation, organization documentation and others. The literature study has therefore been supplemented with interviews and discussions with people involved in the recycling business as well as through visits to recycling facilities around the world. ELDA has been built using a statistical technique, Classification and Regression Trees, to map the technical product characteristics to the end-of-life strategies. Classification is a type of cluster analysis, used to group items with similar characteristics into classes. 14
1.3 Focus and Scope The products studied in this work are mostly electronic products, whose functions include heating, cooling, lighting, generation of electricity, transmission of electricity, storage and treatment of information, transportation, motion, communication and ignition of flammable substances (Hedemalm et al. 1995). The research forming the basis for this thesis emphasizes consumer electronic products of a complex character. Products include small electric appliances, such as cellular phones, larger consumer products, e.g. cars and white goods, and large industrial or institutional products, such as medical systems or aircraft engines. The baseline of this thesis is the product development process into which the end-of-life aspects are to be incorporated. The discussion on how this could take place is not limited to any particular working procedure of designing. The way product development is referred to in this thesis is very broad and general. Therefore the integration of the endof-life aspect is also discussed from a broad and general perspective and not restricted to any specific type or structure of a company. From a geographical point of view, this thesis will focus on the application of the methodology to the United States. The suggestions on how to integrate the knowledge are not limited, in principle, to a certain geographical area. Wherever the waste is generated, the approach should be similar, with minor differences in legislation and structure of existing end-of-life treatment systems to be kept in mind. There are some minor differences in the specifics of how a product is used and the reasons for disposing of the product. A limitation of this research is that the end-of-life strategies were developed from observations of activities in the United States. This is mostly based on differences in legal systems and how politics are involved in this process. This challenge is most noticed by companies distributing products globally. There will always be differences in legislation and consumers will have different reactions to these regulations. However, it is encouraging that these systems are moving closer together rather than diverging in various aspects.
15
1.4 Outline of Dissertation Chapter 2 discusses the research foundations of the work. The work is based on engineering and design, environmental improvements, and business strategy. Chapter 2 presents research initiatives in each of the fields that have been integrated and form the basis of this work. Chapter 3 is devoted to describing Design for Environment, focusing solely on the endof-life concerns in product design. This chapter examines the different definitions of possible end-of-life treatment. The justification of the end-of-life strategy hierarchy is derived from life cycle analysis data. It also presents current end-of-life research, based on product and process perspectives. Understanding the basis and the current research in this field provides background for the research contributions outlined in other chapters. Chapter 4 focuses on the development of the End-of-Life Design Advisor (ELDA). The End-of-Life Design Advisor determines the appropriate end-of-life strategy based on technical product characteristics. This chapter describes the evolution of the technical product characteristics based on case studies and expert opinion. The statistical method of classifying products based on technical product characteristics is explained. This chapter describes the development of the end-of-life strategy categorization based on statistical analysis applied to six technical characteristics across thirty-seven products from the electronics and appliances industries. The dissertation presents the development of a web-based application, End-of-Life Design Advisor (ELDA). Chapter 5 demonstrates the validation and evaluation of the ELDA method. The products’ classified end-of-life strategy and industry practice are compared and analyzed. Agreement between ELDA and industry practice validates the method. It is shown that ELDA succeeded in classification of product end-of-life strategies in agreement with current industry practices. The mismatch between ELDA and current best practice identifies areas for improvement in design and business practices. The application of ELDA to the case studies provided by Philips Consumer Electronics yields interesting results that are relevant to the evaluation of the model and understanding the implications of the work.
16
Chapter 6 discusses other factors influencing ELDA’s recommendation including the Environmental Value Chain and market developments. Work that examines environmental value relationships that are particular to a company (internal value chain) and business in general (external value chain) is presented. The market developments, or changes of product functionality over time, are discussed as well. Chapter 7 describes the implications of this work on decision makers, including product designers, recyclers and policy makers. Chapter 7 explains the impact of these tools in application and the usefulness to decision makers. The focus is placed on product designers and managers, including a brief description of the impact of decisions made by recyclers and policy makers. Companies and other organizations, both governmental and non-governmental, seeking to establish product end-of-life treatment systems can learn from this research on product end-of-life strategies. Chapter 8 summarizes the main research points of this dissertation. It summarizes the crucial lessons and observations resulting from the research. In addition, this chapter identifies opportunities for future research. Chapter 8 presents new avenues for research through creating minor ELDA changes, applying ELDA 'in reverse' and developing a methodology for Environmental Value Chain Analysis.
1.5 Conclusion Motivation for this work was provided by pressure from consumers, competitiveness issues and legislation. Consumers typically target a particular company, whereas the legislation concerning end-of-life treatment targets entire sectors of products. The underlying common goals are to reduce landfilled material, maximize recycling and control environmentally relevant substances. The goals of this research are to help designers and product managers understand possible end-of-life strategies and to identify the strategy appropriate for their product. This research develops a method that relies on designer knowledge about the product and also presents necessary analysis on the end-of-life strategy. Understanding possible end-of-life strategies as well as their implementation can help address the environmental impact of the a product's end-of-life.
17
This research is based on three distinct areas of knowledge – engineering, environment and strategy. To date, there has been a lack of research and methods that link these three together as well to focus on product end-of-life. Previous research on product end-of-life has been excessively aimed at design, losing sight of environmental engineering metrics and lacking an underlying strategy.
18
2
RESEARCH FOUNDATIONS
Chapter 2 discusses Design for Environment in general, with a specific focus on product end-of-life phase. The work is based on three fundamental areas of research – environment, design and strategy. These individual research areas are described in the first three sections of this chapter. Chapter 2 presents research initiatives in each of the fields that have been integrated and form the basis of this work.
2.1 Environmental Foundations Design for Environment covers a wide range of product development activities including choosing appropriate materials, examining the product usage phase to reduce environmental impact, designing for energy efficiency, minimizing industrial residues during manufacturing, designing for end-of-life, improving packaging and reducing use of environmentally relevant substances. Design for Environment is a subset of the work done in Industrial Ecology as well as combining principles from Life Cycle Engineering. While Industrial Ecology supports efforts by scientists and researchers on such varied topics as global warming, nonrenewable resource depletion and Life Cycle Assessment, Design for Environment focuses on efforts by producers and manufacturers to reduce product or process impact on the environment. By incorporating more principles from Life Cycle Engineering, efforts can be made where and when they can have the most impact.
2.1.1
Industrial Ecology
Industrial Ecology is focused on management of resources. Industrial Ecology is a systems view of manmade environment in which activities are managed so as to optimize resource, energy, capital and use for sustainable development. Industrial Ecology examines all industrial processes as a system that interacts and influences the biological ecosystem. Graedel and Allenby (Graedel 1995) in their book state “this systems oriented vision accepts the premise that industrial design and manufacturing processes are not performed in isolation from their surroundings, but rather are influenced by them, and in turn have influence on them.” Industrial Ecology applies both to processes and products and aids in the evaluation and minimization of 19
environmental impact. Another research area is material flows or cycles, techniques for tracing material use and location over time. Topics at the latest Gordon Research Conference on Industrial Ecology include carbon cycle engineering, forestry management, product life cycle management, and moral, ethical, and cultural dimensions of earth systems engineering. Managing potential toxicity is a more important issue in managing products and the environmental impacts of products. Increasingly circuit boards and computer chips are concentrating environmentally relevant materials, presenting challenges at the end-oflife. As computer chips and electronics move from current applications to wider applications (i.e., hand-held devices, control systems, sensors, etc), more and more products contain electronics that will need to be disposed of. Therefore, better management of end-of-life and managing resources consumed is necessary in order to reduce environmental impacts. Biological studies have shown that increased industrial activity indeed impacts the natural ecosystem. Many chemicals have proven hazardous or toxic to animals and plants. Controlling these substances is essential to limiting further damage to the natural environment. There are chemicals that are banned by international treaties (i.e., CFCs). Metals frequently used in electronics or printed circuit boards have proven toxic when emitted to air, water or ground, finding their way to vegetation or animals. As companies take a more proactive role in providing a clean and safe environment, many have established lists of controlled substances, or substances that should not be used in products or processes. These initiatives have been well received by environmentalists, who continue to raise concerns for the protection of natural ecosystem.
2.1.2
Life Cycle Engineering
Life Cycle Engineering is the engineering and design of products and processes to minimize the cost and environmental impact for the life cycle phases of a product. The first stage in the life cycle of any process is the extraction of resources from their natural reservoirs (Graedel 1995). The extractive activities considered are those used to produce the consumable resources used throughout the life. Material extraction is the process of retrieving valuable materials from layers of the earth’s crust. Examples of materials with
20
high extraction costs (environmentally and monetarily) are gold, aluminum and uranium. Recycled materials are nearly always preferable to virgin materials because the (1) avoid the environmental disruption that virgin material extraction involves, (2) generally require less energy in recycling than would be required for virgin material extraction, and (3) avoid landfilling or disposal of the material being recycled. Figure 2-1 provides a generic representation of the product life, flowing from material extraction to product end-of-life. Material
Manufac-
Extraction
turing
Assembly
Use
End-of-Life
Figure 2-1. Generic representation of product life cycle Manufacture of a product is the steps or processing of the materials into parts. These parts and processing techniques are quite diverse based on necessary performance characteristics. Assembly is the phase in which manual or automated processing is used to join or integrate the various product parts. Depending on the complexity of design, this phase varies from two steps to thousands of steps. The use of the product pertains primarily to the amount of time the consumer owns and operates the product. Obviously, energy consumption is included in usage of product. Packaging has a short lifetime although provides critical functions such as protecting product, providing information and simplifying storage, handling and transport. Lastly the end-of-life is the final processing of a product for disposal, incineration, recycling, remanufacturing or other end-of-life processing. A product being designed can be optimized for individual life cycle phases. However, life cycle engineering, or the life cycle perspective aims to optimize these stages together, instead of separately. The process requires tradeoffs to develop the optimal product that balances the gains and losses in the following focal areas: energy usage, material usage, packaging, chemical content and end-of-life. Products, under development, can be specifically designed to accommodate a preferred end-of-life, only by understanding the possible ramifications to other life cycle phases. The life cycle approach is of crucial importance for ecodesign since it allows for environmental impact to be prevented in such a way that the best solution is chosen for the whole life cycle. A company can select those suppliers who generate the least pollution in each individual phase. This paves the 21
way for a concerted effort to reduce the total environmental load of the product in cooperation with suppliers, distributors, users, recycling companies and wasteprocessing firms. Televisions pose a unique challenge for balancing the product life cycle. Based on Life Cycle Assessment studies at Philips Consumer Electronics, the environmental impact of manufacturing is 396 millipoints and environmental impact of the usage based on energy consumption is 1611 millipoints (Reijnen 1999). The product is an ideal candidate for reductions in energy consumption during use and previous redesigns have achieved 39% reduction in energy consumption compared to previous models (Stevels 1999). The reductions in energy consumption affect the product end-of-life stage. For example, if a television is used for twenty years, the environmental impact is much greater than recycling the product after ten years and purchasing a new product. The product end-of-life has increasing importance due to consumer interest and market activity. Market forces, especially in business-to-business activities, are encouraging companies to examine more closely the treatment of the product at end-of-life. There has been little investigation into the strategy of managing the product end-of-life. Frequently, decisions are made without strategy, resulting in higher costs and lower success. To date, there is little published research in this field. The challenge for the OECD (Organisation for Economic Cooperation and Development) and other regulatory entities is to encourage the continuation and expansion of these current and future initiatives, while allowing for local governments, third party recyclers and other others to participate in recycling efforts. It should be emphasized, of course, that managing products at the end-of-life is just one stage in the product life cycle and may not even result in the greatest reduction of environmental impact (EIA 1999).
2.1.3
Life Cycle Analysis
Life Cycle Assessment (LCA), a validation technique, is a broad methodology for identifying environmental burdens that arise from products through the material suppliers, through manufacture, use and disposal (SETAC 1991, EPA 1993). LCA seeks to examine the complete environmental perspective, including in the analysis of, for
22
example, electricity generation, infrastructure and other items which are not be directly influenced by the designer or industry. LCA is not very suitable for generating green design options, because ideas generated from the results go beyond the scope of influence of designers (Brezet et al. 1999). LCA has limited applicability because, as a holistic approach, it requires delineation of all environment effects irrespective of their position in the life or their origin (Stevels 2000b). LCA can not appropriately separate internal and external issues – which makes the application to industry near impossible. LCA unfortunately does not adequately describe product end-of-life issues, because of difficulties in defining boundaries, embedded toxicity, emissions and environmental impact of end-of-life treatment systems.
2.2 Engineering Design Foundations 2.2.1
Design
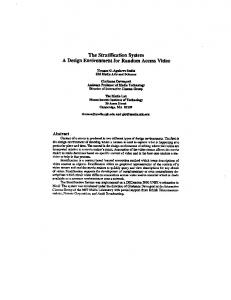
Design can be described as a set of decisions taken to solve a particular set of product requirements. Figure 2-2 shows generically how decisions made concerning manufacturing, distribution, marketing, consumer usage, servicing and end-of-life can be influenced by critical decisions made during product design. Within the product development process, the there are several phases: idea generation, product definition (also called product planning), conceptual design, detail design and embodiment design. Graedel and Allenby cite design as the stage that has the strongest influence on environmental impact (Graedel 1995). It is important to use product information available to design engineers and recycling technology developers early in the development cycle. Strategy
Product Design
Manufacturing
Distribution
Marketing
Consumer
Servicing
End-ofLife
Market Survey Idea Generation
Figure 2-2. Representation of design process
23
Product definition is an initial and crucial stage in the product development process. It is at this stage where the environmental attributes of a product can be identified and built into the design. It is important to recognize that DFE will require some portion of the designer’s effort, and that, like all other aspects of design, thoughtful choices made early in the design process are by far the most cost-effective. These tools are typically applied as early as possible to have the most influence. During the product definition phase of product development, companies decide strategic issues associated with supply chain, life cycle support and manufacturing management. The conceptual design phase is the most important phase in concurrent engineering after the project planning phase or product definition. Approximately eighty percent of a product’s life cycle costs are committed through design choices, such as materials and manufacturing process selections in this phase. Conceptual design comprises concept definition, exploration, evaluation and selection (Allen et al. 1998). Detail design embarks on the actual physical design of the product using CAD models to determine the physical worthiness of the product. Often times, design problems found later on in the design process (embodiment or detailed design stages) cause costly and time consuming redesigns of the product extending the product’s delivery or
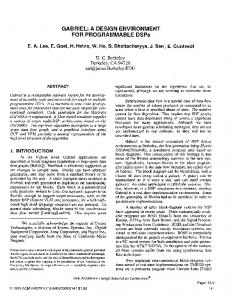
Design Degrees of Freedom
introduction to market.
End-of-Life Design Advisor Environmental Value Chain Analysis D f E Checklists Environmental Benchmarking DfD , DfA LCA Product Definition
Conceptual Design
Detailed Design
Product Use
Figure 2-3. Degrees of freedom in various stages of design (Design for Environment)
24
Figure 2-3 shows the different design stages and the degrees of freedom to change design. Several Design for Environment tools are listed with their corresponding focus area in design. Tools that are useful at product definition stage include the End-of-Life Design Advisor and Environmental Value Chain Analysis. Design for Environment checklists guide aspects such as material selection and are appropriate at conceptual design. Design for assembly and disassembly are appropriate for the detailed design stage. Life Cycle Assessment (LCA) is only possible at the product use stage, after data regarding energy consumption can be collected. Interviews conducted at Cranfield University reveal the need for ‘quick and dirty’ tools to be used early in product design (Evans et al. 1999). Environmental benchmarking is an effective engineering and environmental tool for comparing products of similar functions or in similar market segments (Jansen et al. 1998). There are five categories which the products are rated – energy usage, environmentally relevant materials, end-of-life, material composition, and packaging. This tool has proved effective in comparing and understanding products to gain insight into possible improvements. Environmental benchmarking is limited because it requires finalized products and competitors to compare against.
2.2.2
Design for X
The marketplace for manufactured products has become increasingly competitive with ever more discriminating customers. Along with those changes, the requirements of product design have steadily expanded. In order of their organizations to remain competitive, product developers are no longer able to optimize the design with respect to just the traditional functional (i.e. performance) requirements of the product. They must insure that the product excels in all other aspects that lead to customer satisfaction and product profitability such as cost, quality, reliability and environmental impact (Sarbacker 1998). Experience has shown that with challenges in process (either manufacturing or assembling products), it is best to address the core problem and take efforts to improve the product rather than reacting to the symptoms. Product improvements are more crucial in this case, and this logic follows to addressing
25
environmental concerns. It is best to improve the source, or the product, and then examine the process. Design for X is an integrated approach to designing products and processes for costeffective, high quality life cycle management. Design for X, or DfX, tools help to shift the emphasis of the important design decisions to the start of the development process. To support the additional requirements of product developers, a variety of product development methodologies, collectively known as 'Design for Manufacturability' or 'Design for X', have been developed to help achieve the diverse product requirements. Some methodologies include: • • • • • •
Design for Assembly (Boothroyd et al. 1994, Kmenta 2000) Design for Process/Design for Producibility (Bralla 1986) Design for Serviceability (Gershenson et al. 1991), Design for Ownership Quality (Kmenta et al. 1999) Design for Environment (Graedel 1995), Design for Product Retirement (Ishii et al. 1994), Design for Recyclability (Ishii et al. 1996), Design for End-of-Life (Rose et al. 2000d) Design for Product Variety (Martin 2000) Design for Supply Chain (Esterman et al. 1999)
As research continues in the field of Design for X, more techniques focus efforts on product definition phase of the product development process, where there is more impact on the product for the work expended. Several tools developed at Stanford address needs of designers to have structured methodologies available to implement during early design stages. Value Feasibility Evaluation Method, Design for Variety, Design for Producibility, Advanced Failure Modes and Effects Analysis are all examples of DfX tools. These DfX tools request appropriate information or input from designers and provide relevant analysis to reduce risk, variety costs associated with excessive redesign, design costs for assessing plastics applications, product failure, respectively. Each of these tools is unique but all bring data from life cycle into the earlier stages of design. ELDA follows in the line of methodologies, providing crucial information concerning end-of-life planning early in the design process.
26
2.2.3
Design for Environment as part of Design for X
Design for Manufacture was seen as an operative paradigm, with the decades of research into Design For ‘tools and methods’ (DFX) providing an excellent base from which to develop Design For Environment (DFE) tools. Design for Environment means that ‘the environment’ helps to define the direction of design decisions. In other words, concern for the environment is co-pilot in product development. In this process, the environment is given the same status as the more traditional product values such as profit, functionality, aesthetics, ergonomics, image and overall quality. DFE considers the environmental aspects in each stage of the product development process, striving to achieve products that have the lowest possible environmental impact throughout their entire life cycle (van Hemel 1998). Design for Environment is the systematic consideration of design performance with respect to environmental, health and safety objectives over the full product and process life cycle (Boks 2000). Design for Environment, an integral component of the Design for X paradigm, covers all life cycle stages including material extraction, manufacturing, transportation, usage and end-of-life phases. Design for Environment seeks to understand the life cycle of the product and its impact on the environment at each of its life stages and to make better decisions during product design so that environmental attributes of the product are kept at a desired level. Design for Environment must occur early in the design phase to ensure that the environmental consequences of a product’s life cycle are taken into account before any manufacturing decisions are committed. Functionality of the product also contributes to the environmental consequences, which is also committed very early in product design. A majority of possible product end-of-life costs (or yields) are committed during the conceptual design stage. The challenge is to provide as much relevant information as early as possible to proceed with design. Given both the internal and external impetus for environmentally responsible design, DFE should be a component of the product definition and creation cycle (Graedel 1995).
27
2.3 Business Strategy Foundations The past decade has seen an increased awareness of environmental issues of products by manufacturing companies. The primary interest was through technical and technological approaches (Design for Environment or Ecodesign, as called in Europe). Subsequently, proactive companies have expanded this concept: environmental strategy, environmental validation from a scientific, compliance or customer perception perspective. Twenty-first century business practices will increasingly move toward product-design and manufacturing decisions that routinely blend in environmental considerations. Moving toward this industrial ecology involves experimentation in product development and new technologies as well as in organization strategy and institutional design (Scarlett 1999). Companies are learning the hard way how to develop appropriate environmental strategies, by trial and error. Previous approaches do not adequately incorporate all variables associated with the product development and are lacking a strategic point of view, or the ability to prioritize environmental improvements based on impact reduction and investment required. In order to prioritize, it is necessary to understand the products, the product development process, the company and the company’s stakeholders. A company has to make sure it is putting effort and making investments in the ‘right’ environmental aspects. If a company has chosen a direction that turns out to be less rewarding in terms of environmental and business aspects compared to other options it will result in inefficiency. Such a business risk can be reduced when the appropriate direction is chosen. A critical phase for deciding the product strategy is product definition. Product definition encompasses the up-front product development activities that consider user needs’ understanding, competitive analysis, product positioning, strategic alignment and charter consistency, technical risk assessment, priority decision criteria list, regulation compliance, product channel issues, project endorsement and other organizational support issues (Wilson 1990). These notions of product positioning, strategic alignment, regulation compliance are critical to the development of the company’s environmental strategy. Designers typically have strong influence over these
28
factors during product definition. Wilson cites that the most common causes of project failure are the incomplete understanding of these issues shared by the product development team and other stakeholders. Frequently, failing to identify the worldwide regulatory issues relevant to the project can cause shortfalls. An example tool available to aid in development of design strategy is the Ecodesign strategy tool. Van Hemel’s Ecodesign Strategy wheel visualizes ecodesign strategies, which can be compared to previous or future target areas. Her work identifies over thirty generic ecodesign strategies for improving the life cycle impact of electronic products (van Hemel 1998). The ecodesign strategy wheel is used as a general framework, provoking new improvement options. While the Ecodesign Strategy wheel includes environmental prioritizing, relevant drawbacks are the lack of feasibility assessment and business conditions. STRETCH, acronym for the Selection of sTRategic EnvironmenTal CHallenges (Cramer et al. 1997) includes business and managerial aspects into their environmental strategy model. Taking into account the Business Groups’ strategy, future demands of stakeholders, including suppliers and customers, gives the tool a stronger position to be applied in business. Through application at Philips Consumer Electronics, Akzo Nobel, and various other businesses, STRETCH proves integral to general business planning, especially when embedded in the organization and adapted to related activities. The Ecodesign matrix, used at Philips Consumer Electronics, is similar to a Pugh Concept Selection Method (Stevels 1999). The Ecodesign matrix, shown below, analyzes the benefits of implementing a new design option to the stakeholders first. Only after the benefits to the environment, business, customer and society have been assessed is the technical and financial feasibility analyzed. Proceeding in this order allows for more idea generation before options are limited by monetary or technological concerns. Many times the environmental benefits perceived by the customers and other stakeholders are more important than scientific calculations of environmental gains. The Ecodesign Matrix guides designers to prioritize their efforts, choosing the options that yield the highest environmental impact reduction for the expenditure or effort. It also allows designers to categorize the benefits and decide which benefits are crucial to the business.
29
Table 2-1.Ecodesign Matrix GREEN OPTIONS
ENVIRONMENTAL BENEFIT
BUSINESS BENEFIT
CUSTOMER BENEFIT
SOCIETAL BENEFIT
FEASIBILITY TechFinannical cial
Option A Option B .
Within the field of engineering, especially in industrial engineering, and at many leading business schools, supply chain management is an important research area. Supply chain management seeks to optimize the supply of services and products to customers. Improvements to flow and supply of products and services to consumers have proved quite beneficial, financially and image-wise to companies. Unfortunately, to date, the techniques have only been used to streamline the relationships among producers of a product and the consumer of the product. In managing supply chains, the chain is normally divergent with products being produced in several locations but then delivered throughout the world. The opposite is true for inverse supply chains where the products must be collected from diverse sources. Work in so-called inverse supply chain is slowly gaining speed in the research field. Ideally, integration of forward supply chain with inverse supply chain flows would be more desirable, but much more complicated. Purdue University is conducting ongoing research that seeks to develop supply chain models that include recovery of returned products, disassembly and remanufacturing (Uzsoy 1998). AT&T is developing relationships with suppliers to manage products at end-of-life in addition to providing normal services during product use (Blazek et al. 1998). As consumers and businesses move towards more environmental initiatives, an environmental strategy is crucial for formulating all the actions to be taken to realize the vision in a given period of time; the results of the external and internal analysis are taken into account. Strategy formulation starts with a thorough analysis of the current environmental position of the product line, both in technical, industrial and commercial terms. The most successful tools aid in concept generation while giving designers and managers the freedom and guidance to make decisions.
30
2.4 Conclusion Competitive pressure, consumers and policy makers push for better management of the product end-of-life. Producers and recyclers need tools and methods to help assess the end-of-life strategies appropriate for the product. The method must draw from engineering, strategy and environment. Environmental issues combined with engineering and strategy research addresses the complex problems of determining end-of-life strategies appropriate for products. Many other methods are useful to draw results from but are not directly applicable. Pulling together these diverse fields is complicated but must be accomplished to reach a solution. As applied together to address the concerns of product end-of-life stage, the method developed is powerful. There is some clarification needed for the end-of-life point as well as how end-of-life strategies are defined in this work. Previous work in this field of product end-of-life is helpful to understand the context into which ELDA fits.
31
3
PRODUCT END-OF-LIFE STAGE
Chapter 3 is devoted to describing Design for Environment, focusing solely on the endof-life stage. This chapter provides the justification of the end-of-life strategy hierarchy. It also presents current end-of-life research, divided by focus on product and process improvements. Understanding prior and current research in this field provides background for the research contributions outlined in subsequent chapters.
3.1 Product End-of-Life Considerations Reducing product environmental impact at all life cycles is an important topic for manufacturers of electronic and electrical products. As mentioned in Chapter 1, product end-of-life is only one aspect of product life that is gaining attention in the market. Companies must understand how to improve their products so that the environmental impact will be lower at the end-of-life, while still being economically feasible. Knowledge and understanding of the product end-of-life is crucial to moving towards reduction of the environmental impact and reducing hazardous materials remaining in the environment.
3.1.1
End-of-life Definition and End-of-Life Strategies
The definition of end-of-life used throughout this work is the point in time when the product no longer satisfies the initial purchaser or first user. This allows for reuse in addition to recycle as possible end-of-life strategies. The definition adopted in the current research is chosen because user preferences change more rapidly than the product wears out in several product categories. Other definitions start from the last user, but do not include high eco-efficient end-of-life strategies such as reuse and service as strategies to improve product end-of-life performance. Others define end-of-life as the point at which the product no longer performs the intended functions due to failure or wear-out. Other definitions do not appropriately account for changes in customer preferences. End-of-life strategies describe the approach or method associated with dealing with the product at the end-of-life. End-of-life treatment includes the activities associated with
32
recovering value from the product, through manual labor and/or machinery. The endof-life system includes the activities associated with strategic planning and implementation ranging from the collection of products, treatment of those products and the associated impacts to society and environment. Based on work in (Overby 1979, Ishii et al. 1994, Luttrop 1997, Mackenzie 1997, Nilsson 1998), table 3-1 outlines the following end-of-life strategies. Table 3-1. Definitions of End-of-Life Strategies NAME Reuse Service
Remanufacture
Recycling with disassembly
Recycling without disassembly Disposal
DEFINITION Reuse is the second hand trading of product for use as originally designed. Servicing the product is another way of extending the life of a durable product or component parts by repairing or rebuilding the product using service parts at the location where the product is being used. Remanufacturing is a process in which reasonably large quantities of similar products are brought into a central facility and disassembled. Parts from a specific product are not kept with the product but instead they are collected by part type, cleaned, inspected for possible repair and reuse. Remanufactured products are then reassembled on an assembly line using those recovered parts and new parts where necessary. Recycling reclaims material streams useful for application in products. Disassembly into material fractions increases the value of the materials recycled by removing material contaminants, hazardous materials, or high value components. The components are separated mostly by manual disassembly methods. The purpose of shredding is to reduce material size to facilitate sorting. The shredded material is separated using methods based on magnetic, density or other properties of the materials. This end-of-life strategy is to landfill or incinerate the product with or without energy recovery
Figure 3-1 shows these end-of-life strategies as part of the hierarchy, including closed and open loop strategies and is based on Ricoh’s comet diagram (Tani 1999). Closed loops are preferable from an environmental perspective because they make use of resources and value already added to the natural resources, rather than open loop which landfills or incinerates the materials. The smaller loops represent a more efficient end-oflife strategy with less reprocessing of the materials for reapplication in products. The user is the focal point on the diagram. The products are finished being used by the consumer, there are a variety of strategies the product can take – reuse, service,
33
remanufacture, recycle with separation, or recycle without separation and disposal either in landfill or through incineration.
Figure 3-1. Modified Ricoh Comet Diagram depicting product end-of-life strategies Along the top line are the material producers, manufacturers, assemblers and original equipment manufacturers. The bottom line includes collection facilities and recycling companies. The middle group provides service to move the products from the recycling infrastructure back to the manufacturers and include such activities such as service, product renovation and component remanufacturing (Tani 1999). Disposal is not a focus area of the current research because of increasing costs associated with landfilling or incinerating products at the end-of-life. Landfill closure and escalating landfill costs make 'classic' landfilling of products cost prohibitive. For comparison, other definitions of end-of-life options are presented. End-of-life definitions, given in the Dutch Promise Manual (Stevels 1997), are: • • •
•
Reuse the product as a whole, either for the same or a new application Reuse sub-assemblies and components by remanufacturing and refurbishing Recycling the materials involved by 1) recycling in the original application (primary recycling); 2) recycling in a lower-grade application (secondary recycling); 3) recycling of plastics by decomposing their long plastic molecules into elementary raw materials which are subsequently reused in refineries or for the production of petrochemicals (tertiary recycling, also known as feedstock recycling); Safe incineration with energy recovery and waste disposal 1) incinerate non-reusable materials by using energy generation technology and good flue gas purification (quaternary recycling, also called thermal recycling); 2) incinerate non-reusable materials without energy generation technology but with flue gas purification; 3) dispose of the residual material in a controlled fashion as solid waste 34
•
Incineration without flue gas purification and uncontrolled dumping fall under the category of prohibited options.
Ishii and others describe the following end-of-life strategies (Ishii et al. 1994): • • • •
remanufacturing/reuse: the use of parts “as-is” or after minor repairs or overhauls; primary recycling: processing of materials into another “high-value” application; secondary recycling: processing of material into a “low-value” application ; disposal: landfilling or incineration )
Still others give the following definitions for the possible end-of-life strategies (Ijomah et al. 1999): • • • • •
Reuse: process of using a functional component from a retired assembly Repair: process of bringing damaged components back to a functional condition Reconditioning: process of restoring components to a functional and/or satisfactory state but not above original specification using such methods as resurfacing, repainting, sleeving, etc. Remanufacture: process of bringing an assembly to like-new condition through replacing and rebuilding component parts at least to current specification Recycling: process of taking component material and processing them to make the same material or useful degraded material
3.1.2
Justification of Hierarchy of End-of-Life Strategies
The highest on the hierarchy according to calculated environmental impact analysis is reuse, then service, remanufacture, recycling and last disposal either through incineration or landfilling. Ranking highest is product life extension through reuse of the product. Moving towards reuse of the product as a whole is an ideal solution for the product end-of-life to minimize environmental impact. As well, extending the product through servicing is second on the hierarchy. The next strategy is reuse of subassemblies and components through remanufacturing. Recycling with and without some disassembly first leads to two applications - into the original application (frequently called primary recycling) and recycling in a lower-grade application (called secondary recycling). In the case of secondary recycling, the material quality does not meet the original specifications, but still can be used in applications such as plastic park benches and garbage cans. Lowest on the hierarchy of end-of-life strategies is disposal of the product through either incineration or disposal. The aim of this calculation is to identify the environmental impact of each end-of-life strategy and verify that the end-of-life
35
strategy hierarchy given in Table 3-1 is correct (details of calculation included in this section). Philips Consumer Electronics Environmental Competence Centre performs extensive case studies that examine energy usage, environmentally relevant materials, end-of-life, material composition, and packaging. In order to quantify the product’s environmental performance, the products are disassembled and the material content, manufacturing process and weight are identified. Philips researchers have performed this environmental benchmarking on approximately seventy consumer electronic products. Philips’ Environmental Competence Centre then uses this information to perform a life cycle analysis on the product using Ecoscan (Goedkoop et al. 1996, ten Houten 2000). Ecoscan, like most Life Cycle Assessment (LCA) tools, examines the entire life cycle of the product, from extraction, manufacture, packaging, usage to end-of-life. While there are certain limitations in applying LCA, the analysis of environmental impact of end-oflife strategies can be derived from such results. The Ecoscan results are given in millipoints, quantifying the environmental impact of the product. Higher values denote greater environmental impact. The environmental impact of a product’s end-of-life can be modeled using data from these case studies. The environmental impact analysis results are crucial for determining the environmental impact of different product end-of-life strategies. The manufacturing environmental impact includes extraction and manufacturing processes. For some materials the extraction environmental impact is much higher than the manufacturing processing. The environmental impact quantifies the impact of usage conditions (batteries or grid electricity), as well. Packaging environmental impact accounts for the impact of plastic, cardboard and paper used in packing materials. In the current calculation, the end-of-life impact is only accounted for by the disposal through incineration. The previous table shows the impacts and bonuses for the environmental impact calculation. The percentages shown for recycling material retrieval are reasonable assumptions based on observations of current recycling processes (Mattos 1999).
36
Table 3-2. Impacts and bonuses identified by environmental impact analysis END-OF-LIFE STRATEGY Reuse
ENVIRONMENTAL IMPACT Only original manufacture needed.
ENVIRONMENTAL BONUS
Service
On average, 10% of parts needed for repair, therefore these parts must be manufactured.
Remanufacture
On average 40% parts replaced during remanufacturing of product, therefore these parts must be manufactured
Recycling with disassembly
Replacement product is manufactured from virgin materials.
Recycled Material: Electronics-100%; Glass-80%; Metals-100%; Plastics-100%; Wood-0%
Recycling without disassembly
Replacement product is manufactured from virgin materials.
Recycled Material: Electronics-90%; Glass-0%; Metals-90%; Plastics-20%; Wood-0%
Disposal (either landfill or incinerate)
Replacement product is manufactured from virgin materials.
To consistently perform an environmental impact analysis across all possible end-of-life strategies it is necessary to determine a reference point. Assuming that a product is introduced to the market, used for 10 years and then reaches ‘end-of-life’, how much environmental impact is there to deliver the product in ‘resellable’ condition? For example, a product that will be reused, does not need any new manufacturing or end-oflife processing before it is ready for resell. On the other hand, if the product has the endof-life strategy of recycling – this requires materials to manufacture a new product. Since the original product is being recycled, there will be a reduction in the overall environmental impact based on the percentages of recovered material. The environmental impacts include some or all of the following manufacturing and
37
extraction, energy, transportation, disposal, and packaging, depending on the end-of-life strategy. The environmental bonus is based on percentages of materials recovered from recycling. The resulting units of the equations are millipoints. EI stands for environmental impact and LCA represents the values directly derived from the Ecoscan values.
EIlife−cycle = EImanufacture + EItransportation + EI packaging + EIusage + EIdisposal + EBbonus
(3.1)
EI manufacture = (1 + x) LCAmanufacture
(3.2)
The value x in equation 3.2 is the percentage of the product that must be manufactured for the second life. The values range from 0% (for reuse), 10% (for service), 40% (for remanufacture), 100% (for recycle and disposal). EI transportation = 1 .131 • y • w
(3.3)
In Equation (3), the transportation required is the distance (y) between the end-user and the recycling or recovery facility and ranges from 20 miles for reuse and 100 miles for disposal. The variable w is the weight of the product in kilograms. The value, 1.131, has units millipoints per mile-kilogram (derived from the Philips Eco-indicator database).
EIpackaging = LCApackaging
(3.4)
EI energy = LCAenergy(1st −life) + LCAenergy( 2 nd −life)
(3.5)
EI disposal = 2. 1 • welectronics + 2. 0 • wmetals + 1 .8 • wplastics + 0 .8 • wmisc/ glass + 0.1 • wwood
(3.6)
Equation 3.6 assesses the environmental impact of the product disposal, as a weighted sum of the weights of the materials. The multipliers are determined with the help of the Philips database (based on Life Cycle Assessment studies) and are given in units of millipoints per kilogram. The variable, w, is the weight in kilograms of the material fraction. EBbonus = − (0. 8 • LCAelectronics + 1. 0 • LCAmetals + 0.8 • LCAplastics + 0 .8 • LCAmisc/ glass)
(3.7)
Recycling of the product yields an environmental bonus rather than impact. The recovered material is reapplied, preventing the need to extract more raw materials from the environment. The values are given as the recycling yields, assumed from a disassembly operation. The recycling yields are highest for metals, close to 100%, whereas for wood is 0%.
38
These assumptions combined with the life cycle analysis data collected on the Philips products, yield environmental impact estimates for various end-of-life strategies. The following table displays the values from the analysis on televisions. Table 3-3. Environmental Impact Reults for Television ENVIRONMENTAL IMPACT (MILLIPOINTS) Manufacturing Transportation Energy (first life) Energy (second life) Packaging Disposal Bonus Total
REUSE SERVICE REMANU- RECYCLE RECYCLE DISPOSAL FACTURE WITH WITHOUT DISASSEMBLY DISASSEMBLY 396 0 1611
435.6 0.4 1611
554.4 2.2 1611
792 2.2 1611
792 2.2 1611
792 2.2 1611
1611
1611
1611
1611
1611
1611
0 0 0 3618
0 0 0 3658
12 0 -116.5 3674
12 2.9 -291.3 3740
12 2.9 -76.9 3954
12 17 0 4045
The calculations presented in Table 3-3 were performed for each of the products. The following table presents the results of the environmental impact calculation for several Philips Consumer Electronics products. Table 3-4. Environmental Impact Results for Philips Products PRODUCTS
REUSE
SERVICE REMANU- RECYCLE FACTURE WITH DISASSEMBLY 88 (63) 93 (66) 95 (68) 105 (75) 613 (76) 631 (78) 639 (79) 666 (82) 1877 (70) 1950 (73) 2035 (76) 2186 (82) 1942 (57) 2083 (62) 2473 (73) 3223 (95) 2590 (98) 2596 (98) 2609 (98) 2632 (99)
Cell Phone VCR CRT Monitor LCD Monitor Portable CD Player Audio Product 3321 (85) 3375 (87) 3357 (86) Mainstream 3618 (89) 3658 (90) 3674 (91) Television
3393 (87) 3740 (92)
RECYCLE WITHOUT DISASSEMBLY 122 (87) 698 (86) 2463 (92) 3260 (96) 2636 (99)
DISPOSAL
3474 (89) 3954 (98)
3892 (100) 4045 (100)
140 (100) 812 (100) 2679 (100) 3384 (100) 2652 (100)
*Numbers given in parenthesis are percentage of disposal **Disposal numbers averaged between incineration and landfill As Table 3-4 shows, the cellular phone has low environmental impact for the end-of-life strategies, ranging from 88 millipoints to 140 millipoints on average. The VCR impacts the environment at 76% for reuse, compared to 82% for recycling with disassembly as a
39
percentage of disposal value. The audio products considered have end-of-life strategies ranging from 3321 millipoints for reuse, 3357 millipoints for remanufacture and 3892 millipoints for disposal. Televisions have environmental impact for the reuse strategy of 3618 millipoints, whereas disposal of televisions has environmental impact of 4045 millipoints. Monitors had higher environmental impact of reuse, 1942 millipoints, compared to the other products. The monitors examined had greater environmental impact during their original manufacture. Appendix II contains more information. 4500
Environmental Impact (millipoints)
4000 3500 3000 2500 2000 1500 1000 500 0 Cell Phone
VCR
CRT Monitor
LCD Monitor
Portable CD Player
Audio Product
Mainstream TV
Example Products Reuse
Service
Remanufacture
Recycle with Disassembly
Recycle without Disassembly
Disposal
Figure 3-2. Environmental impact of End-of-Life Strategies The main result from this analysis, as shown in Figure 3-2, is the environmental impact of products does increase from reuse to disposal. This calculation confirms the ranking of the end-of-life strategies in the hierarchy. However, it is to be noted that in consumer electronics, energy consumption dominates. This makes that between the best (reuse) and the worst (disposal) strategies, difference may be less than commonly perceived. The environmental impact of reuse compared to disposal for televisions is 89%, for VCRs 76%, for cell phone 63% and the highest for portable CD player -- 98%. The following chart shows the environmental impact data for all end-of-life strategies as percentages of disposal environmental impact. For example,
40
if the environmental impact of disposing of a cellular phone is 100%, then reusing the cellular phone has environmental impact of 63% (a 37% reduction).
Percentage of Disposal Environmental Impact
100 90 80 70 60 50 40 30 20 10 0 Cell Phone
VCR
CRT
LCD
Portable
Audio
Mainstream
Monitor
Monitor
CD Player
Product
TV
Example Products Reuse
Service
Remanufacture
Recycle with Disassembly
Recycle without Disassembly
Disposal
Figure 3-3. Environmental impact of End-of-Life Strategies compared to disposal The end-of-life strategy hierarchy represents a ranking of the possible end-of-life strategies from least to greatest impact on the environment. The calculation of the environmental impact of end-of-life strategies is an original contribution in this work.
3.1.3
Knowledge of End-of-Life Strategies
There are benefits from operating at different levels of the end-of-life strategy hierarchy (Copper 1994). Products have different characteristics that determine the end-of-life strategy possible. Determining the end-of-life strategy is necessary in order to improve the product. The end-of-life strategy allowable depends on product characteristics. Inappropriately applying design rules or a design strategy for a product’s end-of-life can lead to inefficiency. The design rules for life extension, product reuse, component reuse and material reuse are not the same: they can sometimes counteract one another. Knowledge of the product characteristics allows designers to determine the end-of-life strategy early in the product design. The fact that different end-of-life strategies have varying environmental impact (as illustrated in Table 3-4) identifies opportunities to move to higher levels on the end-of-life hierarchy. For example, through use of technical
41
product characteristics, it is possible understand why plastic or metal dominated products differ in their end-of-life treatment. Being aware of the strategic issues associated with different end-of-life strategies is necessary to improve the product design. Some examples from Appendix B of the Dutch Promise manual (Stevels 1997) of issues relevant for different end-of-life strategies are, as follows: •
• •
•
Reuse: In the event of product reuse it is important that the manufacturer knows how much expert knowledge is available in the (repairs) firm; the product will bear the manufacturer’s name in its second life too, not the name of the firm that has repaired it. Remanufacturing/refurbishing: If it is a case of remanufacturing or refurbishing, then it is important that the processing firm guarantees quality and volume. Access to secondary markets – often on other continents – also plays a significant role. Recycling: Processing material reuse poses entirely different requirements. The main concerns are the technology available and sufficient economy of scale. For instance, the effective processing of old cars requires a shredder plan with a capacity of 50,000-100,000 tons/year. The high-end engineering plastics used for television cabinets can be recycled profitably on a line that has a capacity of 2,000 tons per year (corresponding to 300,000 televisions a year). Ecologically sound and cost-neutral processing of printed circuit boards calls for a processing line with capacity of 2,500 kilograms per day. Incineration: If the products will end up (as whole or in pieces) in incineration plants, then it is important to know what are the restrictions for acceptance: will it be accepted for incineration as household waste or classified under a special category of waste (involving a higher incineration charge)?
Once a designer has identified the end-of-life strategy appropriate for the product, the detailed issues including tradeoffs between different life cycle stage improvements is necessary. For example, a particular end-of-life strategy, such as automated disassembly, may increase service costs. Furthermore, by focusing on service as the assumed end-oflife strategy, the product could have higher shredding costs. For example, a frequently failing part, one that needs to serviced frequently may be made of a more durable material in a following design. This change in material for service needs could then affect the mechanical shredding of the product and may indeed require that the part be removed prior to shredding, adding time and cost. Knowing the end-of-life strategy of the product also reduces the tedium of calculating environmental impact results for products before making improvements. An advantage
42
with the ELDA classification is the detailed information required by LCA is no longer needed to assess the end-of-life strategy appropriate for the product.
3.2 Product Focused End-of-Life Research The life cycle perspective includes the take back and reprocessing of the product at its end-of-life – from cradle to cradle. The product being developed can then be specifically designed to accommodate a preferred end-of-life route (Poyner 1997). Environmental impact analysis tools consider specific aspects of the design of a product and are being used at the detailed design stage where it was difficult to employ any of the suggested design improvements (Poyner 1997). The research areas for improvements to products are diverse. Researchers have attempted to incorporate product end-of-life concerns into their design tools. These tools frequently fall short by delaying assessments until detail design stage, requiring too detailed information from the user and requiring the user to input critical end-of-life data. Other research seeks to improve product modularity. Sosale (Sosale et al. 1997) reports on a study that helps designers form modules and make decisions to enhance modularity. Product modularity can also provide designers with easily detachable subassemblies and components that facilitate remanufacturing, reuse, material recycling and disposal. This research does not provide a mechanism to balance tradeoffs between creating modules appropriate for different end-of-life strategies. The method suboptimizes because it ignores other life cycle phases such as manufacturing and assembly, that are strongly affected by modularity. Harper and Rosen (Harper et al. 1998) describe a tool being developed to link qualitative measures of remanufacturability to engineering information embedded in CAD systems. The tool is designed for implementation during detailed design and the user must indicate if the parts will be refurbished, recycled or landfilled. Harper and Rosen suggest, that “the designer typically knows with some degree of certainty the post-life intent of the individual components.” The post-life intent, or end-of-life strategy, can not be determined without extensive knowledge of end-of-life treatment techniques. While uniting CAD and product recyclability information is helpful, it is difficult to make changes in design at these late stages. Furthermore, the research results in specific
43
information concerning the end-of-life of parts, which (1) ignores possible reuse of the product as a whole and (2) assumes the product will undergo some disassembly at the end-of-life. Other end-of-life product focused improvements demonstrate the use of product embedded sensors. CMU and Bosch have investigated embedded sensors to monitor the conditions of possible reused components (Klausner et al. 1998, Klausner et al. 1999). The use of embedded sensors shows promise in reuse of motors and other parts that are difficult to manufacture, costly to purchase, taxing to the environment, and have remaining use in the market. However at present, adding more electronics to products to sense the wear and record it in memory is not cost effective for all products and may cause greater environmental impact over the product life. This is a promising area of continuing work. Researchers, through guidelines and manuals, identify principles that should be taken into consideration to facilitate end-of-life treatment. Most of these manuals assume an end-of-life treatment of recycling, mostly through manual disassembly. Contributions from a wide variety of European sources lead the way in this effort (Jovane et al. 1993, Bergendahl et al. 1995). Unfortunately, these improvements exclusively focus on redesign of existing products and the improvements rely too much on designer perceptions. While their objective is to seamlessly integrate environmental concerns, they depend on the experience and knowledge of designers for critical input values relating to end of life strategies. Other efforts do not address product end-of-life issues until most of the design parameters are set. An example of industry initiatives associated with improving products is Philips Consumer Electronics’ EcoVision Program. The cornerstone of the EcoVision Program is the communication of top achievements as embodied in Green Flagship products to customers and other stakeholders. These achievements come primarily from management of the cross-functional processes around creation, production and marketing and sales of these products (Wilson 1993). The EcoVision Program was introduced top-down in the organization, through initiative and commitment of the
44
president and chief executive officer of the company. Its implementation is now well underway; the Consumer Electronics Division has already achieved impressive results in Green Flagship products such as a television, videocassette recorder, audio systems and telephones (Ishii et al. 2000). EcoVision includes end-of-life as one of the five focal areas and shows good life cycle integration overall. However, it works on a comparative basis, ‘better than the competition’, and because it is essentially based on current design practices is not likely to generate real innovative improvements.
3.3 Process and Technology Focused End-of-Life Research This section describes process improvements that address the end-of-life phase of the life cycle. Boks et al (Boks et al. 1998a) have identified various factors influencing differences in end-of-life treatments in Europe, Japan and United States. The study compared various materials recycling techniques as well as remanufacturing of appliances and electronic products in different regions of the world. Their findings included recommendations to legislators, designers and recycling organizers for improved communication and increased research into end-of-life treatment processes.
3.3.1
Remanufacturing
Remanufacturing is the process in which quantities of similar products are brought into a central facility and disassembled. Parts can be reused when the wear-out life is longer than the technology cycle. In most cases, there are important market opportunities for these parts. Lund reports on remanufacturing operations in the United States by product – automobile (46%), electrical apparatus (23%), toner (14%), tires (12%) and other (5%) (Lund 1996). Williams and Shu research areas of remanufacturing including an analysis on the waste streams of a printer cartridge remanufacturing facility to remove obstacles (Williams et al. 2000). Their work explores differences between products and industries in remanufacturing operations. Researchers at Rochester Institute of Technology look at remanufacturing operations including evaluating remanufacturing of printer cartridges (RIT 2000). NJIT is working with automobile demanufacturers to transform the industry from a single station, single worker setting with an output rate of 1 vehicle per 6 hours to a 12 station setting with a rate of 24 vehicles per 6 hours (NJIT 1999). The project focus
45
will be first to develop analytical tools to support this design and modeling process, and second to build testbed prototypes for automotive and electronic industry applications.
3.3.2
Disassembly
Disassembly is motivated by two goals – to obtain pure secondary materials and to isolate environmentally relevant materials from other materials. Disassembly of products into separate materials is just one of many possible end-of-life treatment options. Even though complete disassembly may seem to provide a way of minimizing the damage to the environment, some studies conclude that with the current recycling technology and market prices for recycled materials, complete disassembly is not profitable since the cost of disassembly is more than the market and environmental benefits. Thus, it is important to find a balance between the resources invested in the disassembly process and the return realized from it (Bhamra 1997). Many researchers are seeking optimal disassembly orders to retrieve highest material value in lowest time and steps. Boks et al. (Boks et al. 1996) address the reuse and material recycling of televisions by comparing assembly times calculated using different methods of disassembly. Design for Disassembly software tools generally calculate potential disassembly pathways, identify the fastest pathway, and reveal obstacles to disassembly that can be ‘designed out.’ Since the late 1980’s, designing products for ease of disassembly has been an active area of research primarily due to the popularity of design for assembly methodology. Boothroyd and Dewhurst, Inc., a pioneer in DFA methodology, have been integrating disassembly analysis tools in their software (ASME 1998). The software simulates a disassembly process as it would likely take place when the product reaches its end-of-life phase (Knight et al. 1999). Ishii et al (Ishii et al. 1994, Ishii 1995) developed a software tool, LASeR that concentrated on advanced planning for product retirement and addressing the level to which a product should be disassembled. LASeR allows the user to evaluate a design at various stages of the life cycle. After entering the required data into the software’s input stream, the tool displays the disassembly times for components and fasteners, the compatibility index and the retirement cost breakdown for each clump, including reprocessing and disassembly cost.
46
Other work has also developed methods for disassembly planning using Petri Nets (Feldmann et al. 1997, Moore et al. 1998, Zussman et al. 1998). Moyer and others survey of recycling and the complexity of disassembly (Moyer et al. 1999). These approaches are limited in their modeling of real life situations such as disassembly cost, paths to commercial recycling streams, and fragmentation of parts (Das et al. 1999). Indeed reducing the disassembly time makes separating materials easier at the end of the product’s life, but it is only one of six possible end-of-life strategies. These models may result in optimal disassembly for a product, but it overlooks that it might not be optimal to disassemble the product from a life cycle perspective. This misses the key to the life cycle perspective that optimizing one area may overlook possible improvements elsewhere. For example, optimizing the time to remove a battery overlooks the solution of creating a product that does not rely on battery power. As with other tools such as Life Cycle Assessment, the results from these analyses are not directly applicable to product designers. However, on general terms, lower disassembly times often results in lower assembly times. Recently researchers seek to improve the actual disassembly of products by novel fastening techniques and automating the disassembly process. Automated disassembly of keyboards and other electronic equipment shows limited application (Feldmann et al. 1996). Products are more diverse and collected products have characteristics too difficult to distinguish through databases and computer control. The demonstration automated disassembly facility in Japan, funded by MITI, relied on extensive databases of product information to control the separation of components (Yoshida et al. 1999). Manual disassembly techniques using innovative disassembly tools show substantial improvement in disassembly times and preserve the intended product use (Eisenreich et al. 1996). NJIT concentrates on development of new types of fasteners that meet design specifications and are quick to assemble and disassemble (NJIT 1999). While the development of special tools for disassembly may be non-destructive, this further complicates the disassembly of the product because the recycler must have the tools unique to the product. These techniques seek to fix the process rather than the product, and will have limited success. Reversibility of locking mechanisms is of special interest, leading to fasteners activated by the insertion of a special purpose tool or an external
47
trigger that will initiate disassembly (Das et al. 1999). Because using adhesives complicates disassembly and recovery of pure material, NJIT hopes to develop new and economical fastener technologies to supplant some uses of adhesives (Das et al. 1999). Other research into disassembly uses smart materials, such as shape memory alloys or shape memory polymers, for releasable fastener devices. Active Disassembly using smart materials demonstrates disassembly of sub-assemblies, unbonded components and constituent assemblies including components such as housing, PCB, LCD, antenna, shielding, transformer, mechanical components, hard and disk drives, and many other fastened components (Chiodo et al. 1999). Masui reports on the investigation of separation using imbedded hotwires for separating cathode-ray tube glass used in televisions and computer monitors (Masui et al. 1999).
3.3.3
Recycling through mechanical methods
Material not disassembled, manually or automatically, can be recycled through mechanical processing lines. A full recovery value from these waste streams requires utilization of a sequence of different steps, for example, shredding, electromagnetic separation, and further size sorting and electrostatic separation. Shredding is the chopping of the different materials to achieve size reduction using hammer, cutting and cryogenic mills. Micrometallics provides recovery and recycling services for electronic products and components to original equipment manufacturers (Mattos 1999). They perform disassembly, component recovery and testing, shredding, material separation and recovery operations in Roseville, California. The end-of-life materials management facility does not landfill any material, does not use water in the processes and even the filters the exhaust air to remove any dust. They handle a wide variety of products including mainframes, computers, workstations, printers, military equipment, copiers, plotters, telecommunications equipment, and prototype electronic equipment. Since 1996, they have partnered with Hewlett Packard to manage their waste stream and recover value from their used products (St. Denis et al. 1998). Separation, as the name implies, separates the material fractions based on weight, magnetic and density properties. Ferrous metals are separated by magnets, non-ferrous
48
metals are separated by eddy-current process, plastics are separated by wind sifting, for some examples. While these are the dry processing techniques, there are wet processing techniques such as hydro-cyclone separation, flotation and sink/flow separation. European and Japanese research efforts have made improvements to recycling technology. Outlets for metals already exist on a large scale, especially precious metals where the value is retained and the recovered purity from smelting operations is equivalent to newly extracted metals. Compared to metal outlets the plastic recycling industry is still in its infancy. The desired quality, which is of the virgin material, of the plastic fraction is not easily obtained. Economically viewed recycling of plastics is not feasible at the moment. This is caused by not being able to know what kind of different plastics are mixed in the recycling process, resulting in unknown chemical properties. MBA polymers, in conjunction with the American Plastics Council, reports that their efforts into identifying plastics on a whole part basis using automated spectroscopic units and manual or automated sorting is not as economically promising as plastic flake sorting (Arola et al. 1999). Their findings indicate that whole part sorting would require extensive particleby-particle sorting for further enrichment to meet purities exceeding 99% such that the plastic could be used in new durable goods, or for the plastic to have any considerable resale value. Recycling of toxic wastes can avoid dissipation of the materials into the environment and avoid new production. For example, rechargeable nickel-cadmium batteries can be recycled to recover both cadmium and nickel for other uses. Inmetco Corporation in Pennsylvania and Accurec in West Germany are routinely recycling such batteries using pyrometallurgical distillation.
3.4 Conclusion Increasing concern for product end-of-life is pushing companies to establish programs to take back their products. Currently, these companies rely on ad hoc approaches to build their end-of-life systems. Without a unified perspective of strategic, environmental and design issues, many of these programs fail to achieve the necessary targets to be profitable.
49
The end-of-life is the point in which the product no longer meets the needs of the original owner. The hierarchy of end-of-life strategies is reuse, service, remanufacture, recycle with disassembly, recycle without disassembly and disposal. There has been substantial research into the processing of products at end-of-life but little research into improving products so that higher levels on the end-of-life hierarchy are achieved. The research field is fragmented and disorganized, making it difficult for companies to find quick, simple solutions they can implement for a wide variety of products. ELDA guides product designers to identify end-of-life activities appropriate for their product. Relying on technical characteristics of the product, the classification methodology identifies the end-of-life strategy. The research approach is based on case studies as well as statistical analysis to determine the appropriate classification.
50
4
END-OF-LIFE DESIGN ADVISOR
Chapter 4 focuses on the development of the End-of-Life Design Advisor. The End-ofLife Design Advisor classifies the product into the appropriate end-of-life strategy based on technical product characteristics. This chapter describes the evolution of the technical product characteristics resulting from case studies and expert opinion. The statistical method for classifying products according to technical product characteristics is explained. This chapter describes the development of the end-of-life strategy categorization based on statistical analysis applied to six technical characteristics across thirty-seven products from the electronics and appliances industries. Based on this classification, chapter 4 describes the development of a web-based application, End-ofLife Design Advisor (ELDA).
4.1 Basis for End-of-Life Design Advisor The acronym, ELDA, stands for End-of-Life Design Advisor. End-of-Life because it is focused on this stage of product life cycle. Design because it is focused on the contributors of technical characteristics in product design, including product managers and designers. Advisor because it is intended to support decisions with technical basis, in order to improve decisions made by companies. Traditionally, Design for Environment has focused on technical solutions, limited to factors the company can control. Product designers and managers are able to influence technical aspects of the product. ELDA uses technical product characteristics to determine end-of-life strategies. ELDA objectively examines the technical characteristics that control the product’s possible end-of-life treatment. By using data available in early stages of product design, ELDA brings in the environmental perspective without the usual subjectivity. Although the technical product characteristics influence the product end-of-life strategy, the strategy chosen depends on intangible business and legislative aspects, frequently out of the control of designers. The ELDA classification is equivalent to the best end-of-life treatment observed in industrial practice. From a technical and environmental perspective, ELDA is based on the observations of current end- of-life treatment. In order to determine the preferred
51
end-of-life treatment accurately, the product end-of-life strategies, it is necessary to have meaningful parameters for the classification analysis. It is also necessary to consider only those product characteristics that are known and controllable in the early design stages allowing for improvements. The rationale for choosing technical product characteristics is that they are available to designers, valid for a wide variety of products, and are easy to collect based on knowledge of the product. It is crucial to look first at what is possible from a technical perspective, through ELDA, and then assess the reasons affecting the implementation of end-of-life strategies. Differences in the classified end-of-life strategy and what is done in industry are discussed in Chapter 5. The possible actions, with knowledge of the end-of-life strategy, are design improvements to the product and enhancements to the value chain, by either providing design incentives internally or additional external organization of the product end-oflife. ELDA is particularly useful for products across a wide variety of product sectors. ELDA is appropriate for application in design of new and existing products. While designers are able to use benchmark techniques to compare existing products, it is not possible when designing new products. With ELDA, it is possible to build an end-of-life strategy for both new and existing products. Not only does ELDA develop the strategy effectively, ELDA enables the designers to see similarities in products that otherwise they might miss because of the focus on product function. Current benchmarking techniques examine products within product categories, aimed at the same market segment or provide similar function. These benchmarking techniques overlook products that may have very similar characteristics but have different functions. By only looking at product function, the similarities between a network router and portable radio are overlooked, for example. Looking at a wider range of products, the advances in environmental performance of a product category can transfer to products in other market segments. Taking advantage of these similarities can reduce work by transferring knowledge and reapplying proven tools. ELDA’s focus on the entire product is unique; other tools examine products on a per part basis. Apart from examining the entire product, the analysis includes all end-of-life strategies such as reuse and service as well. ELDA is intended to provide determination
52
of the end-of-life strategies early in product development process and is not meant to require or provide detailed level information known at other design stages. The End-ofLife Design Advisor also takes advantage of the cross-functional nature of design, pulling together a variety of disciplines and looking at environment aspects with technical perspective. Implementing and using ELDA during design stages can help management improve cross-functional processes associated with product creation, production, marketing and sales. Environmental improvements provide motivation for creativity, pushing design teams to think outside of the box. Cross-functional teams have been able to look at the product with fresh eyes from the environmental perspective to answer and solve problems. ELDA enables the designers to lay out the roadmap or the clear avenue for further work. ELDA does not address other characteristics such as legislation, infrastructure, supplier and secondary material recycling, since design and manufacturing engineers have limited control over these issues. Whether the classified end-of-life strategy materializes in practice depends on internal and external factors. External factors include cost structures, industrial infrastructures of different countries, and labor costs of the country the products are being disposed of in. Internal factors are such items as overall company strategy, company organization, incentive systems, etc. However, more in depth discussion about the legislation, producers, consumers and recyclers’ relationships is given in Chapter 6. 1997
1998
1999
Case Studies
Brain Storm
Factors
Technical
ELDA Collection
Case Studies
CART
Product char. Product char.
ELDA Collection
Case Studies
CART
6 Final Char.
Figure 4-1. Timeline of Research The timeline for the research is shown in Figure 4-1. It shows the method of gathering case studies and analyzing the data using statistical technique. The case studies were collected in 1997, 1998 and 1999. The characteristics were narrowed down from 24 to 6
53
during the three years of research. The following sections describe these steps in more detail.
4.1.1
Case Studies
This research includes case studies ranging from generic to very specific. The generic case
studies
come
from
Stanford
University’s
graduate
level
Design
for
Manufacturability course (ME217). Examples have been collected each year from 1996 to 1999, with approximately ten case studies a year as shown in Figure 4-2.
1997
1998
Case Studies
Brain Storm
Factors
Technical
ELDA Collection
Case Studies
CART
Product char. Product char.
1999
ELDA Collection
Case Studies
CART
6 Final Char.
Figure 4-2. Timeline of Research – Case Studies Stanford University’s graduate level Design for Manufacturability course is a six month long course covers design topics such as Quality Function Deployment, Cost-worth, Design for Environment, Product Definition, Robust design, Advanced Failure Modes Effects and Analysis, Design for Variety and Design for Producibility. Project teams of four students apply these concepts to projects provided by a wide variety of companies. Off-campus students, participating through Stanford’s Instructional Television Network, have projects sponsored by their companies. Over the last three years, some of the over 100 projects have focused specifically on environmental improvements. Two of the thirty-five lectures describe environmental activities with guest lecture from leaders in implementing environment and business. Other case studies have been collected through the internet with ELDA, from countries including: Japan, Korea, United States, Canada, Croatia, Finland, France, The Netherlands, Norway, Spain, Sweden and the United Kingdom and are listed in Table 4-1. Using course projects from 1996 and 1997, the initial case studies addressed a vacuum cleaner, a digital copier, a washing machine, an inkjet printer, a single use camera and a television. The digital copier project focused specifically on improving end-of-life
54
treatment of the product. In 1998, the case studies included an aircraft engine, a portable phone, a lead acid battery, a bubblejet printer, a line-matrix printer, a portable projector, a car, a computer and a server. The 1999 case studies included a generator, an automatic transfer switch, a handheld vacuum, a miniature robot, a network router and a fiberoptic transceiver. Table 4-1. Types of products studied (by year) YEAR
IT PRODUCTS
1997
Digital copier, inkjet printer
1998
Portable phones, bubblejet printer, line-matrix printer, portable projector, network server Network routers, fiberoptic transceivers, laserjet printer Computer
1999
Other
CONSUMER DURABLE PRODUCTS Vacuum cleaner, washing machine, television
Handheld vacuum
COMMERCIAL PRODUCTS Shipping container
OTHER PRODUCTS Single use camera
Aircraft engine, lead batteries, elevator
Car, door panel
Generators, automatic transfer switch, miniature robot
Audio product
Typewriter
Additional case studies, courtesy of Philips Consumer Electronics, are used to validate and draw implications from the application of ELDA. These case studies, results and conclusions are presented in Chapter 5.
4.1.2
Application of CART to build backbone for ELDA
Cluster analysis is a subset of techniques used to classify objects or cases into relatively homogeneous groups called clusters. Objects in each cluster tend to be similar to each other and dissimilar to objects in other clusters. Cluster analysis is also called classification analysis or numerical taxonomy. Cluster analysis can be useful for: • • •
investigating useful conceptual schemes for grouping entities, generating hypothesis through data exploration and hypothesis testing, and attempting to determine if types defined through other procedures are present in a data set.
Cluster analysis can be viewed as a set of techniques designed to identify objects, people or variables that are similar with respect to some criteria or characteristics. Cluster analysis has been used in marketing for a variety of purposes, including the following: 55
• • • • •
segmenting the market, understanding buyer behaviors, identifying new product opportunities, selecting test markets, and reducing data.
Classification and Regression Trees (CART) is one of many cluster analysis techniques and is a methodology commonly found marketing data or medical data analysis. Classification analysis produces an accurate classifier or uncovers predictive structure of data to predict medical conditions, consumer behaviors and other complex patterns (Breiman et al. 1984). In most cases, researchers use CART to analyze sample sizes in the thousands. Currently, no method exists to identify directly or quantitatively the characteristics that have the most influence for classification problems. It is advantageous to use CART over other classification tree programs because the method is transparent, the user is able to change the parameters easily and the tool performs analysis quickly. CART can also be used to determine behaviors including air travel frequency, pet ownership, AM radio preferences and TV watching duration, for example. A classification tree fits categorical data given by 9185 individuals and their demographic information. For example, the most important classifiers to determine pet ownership are type of domicile, home ownership, ethnicity, number of people in the family and years of residence in Bay Area (Ellis et al. 1998).
1997
1998
1999
Case Studies
Brain Storm
Factors
Technical
ELDA Collection
Case Studies
CART
Product char. Product char.
ELDA Collection
Case Studies
CART
6 Final Char.
Figure 4-3. Timeline of Research – CART Analysis In depth CART analysis was performed on the data at two separate points in the present research. Both times, an iterative process was used to find the most accurate classification of the end-of-life strategies. The data is entered into CART (C program
56
stored on a Leland server) and the data is classified according to the best classifiers. The results of CART, applied to the data, are included in sections 4.2.2 and 4.3.3.
4.1.3
ELDA Internet Tool
Ishii and Hornberger (Ishii et al. 1992) have reported that designers required the following characteristics for a computer-based tool to have long term value: • • •
simple inputs (easy to learn, short execution time, small amount of input), objective output (quantitative values, cost estimates and sensitivities), and focused subject matter (designer’s responsibility).
Environment is only one of the many issues facing designers and therefore, any tool must be simple and quick. The ELDA tool takes approximately ten minutes to use and receive a meaningful result. It does not rely on existing knowledge of the designer, provides examples for the designers to use, and only requires six inputs. ELDA recommends an end-of-life strategy with examples, presented in an objective manner. The End of Life Design Advisor (ELDA) is a web-based tool for evaluating and improving product end-of-life strategies, available at http://dfe.stanford.edu. The full structure of ELDA is given in Appendix IV. The user inputs are reported back to Stanford using a Java applet and compiled into a database for further follow-up and analysis.
Figure 4-4. Example ELDA input screen
57
ELDA first asks users to evaluate product characteristics illustrated by examples. Figure 4-4 is an example of an input screen from ELDA, and the other screens are given in Appendix IV. There are several ways the user can input data including typing the exact value, using a scroll bar, or by choosing a product that has similar attributes to the user's product. The user is able to follow the clear commands given in this tool to move from screen to screen and answer the questions. After receiving input from the users, the End-of-Life Design Advisor tool compiles an input summary to facilitate user verification. ELDA processes the information using the results from the classification tree and makes a recommendation for end-of-life strategy to the user. From the determined end-of-life strategy, ELDA provides design recommendations and guidelines based on the particular end-of-life strategy. Individual web pages outline recommendations for improvements to designs and also give examples of other products for the designer with which to compare the product. ELDA is provided as a tool on the internet to allow product designers and product planners to communicate and collaborate about the end-of-life issues during product development. In recent years, there has been a convergence of communication and computing technologies most notably observed in the development and use of the world wide web. The internet is increasingly being utilized to synchronize efforts globally. Remote members of project teams could also update the product information online. ELDA facilitates communication between globally separated design teams and works well for environmental concerns. Applying ELDA on the internet takes advantage of a familiar and easy to use interface, the independence of the platform (i.e. hardware and operating system), and the low costs associated with the development and maintainability of web-based solutions (Rodgers et al. 1999). Moreover, it is platform independent and data independent (Liang et al. 1999). ELDA takes advantage of the internet to facilitate communication and the use of the computer to speed data transfer and calculation. Further application in terms of recommendations to address challenges in realizing the potential end-of-life strategy is limited. Neither computers nor the internet can replace design creativity and problem solving. By providing information and guidance, with easy access, gives keys to improve end-of-life strategy decisions. 58
4.2 Evolution of Technical Product Characteristics The cluster technique, CART, was used to determine the product characteristics necessary to form the backbone of ELDA. Evolution and selection of technical product characteristics has gone hand in hand with the collection of case studies. The original product characteristics (Rose et al. 1998a, Rose et al. 1998b) were based on examining similarities between case studies performed at Stanford University. These twenty-four characteristics were categorized by external, material, disassembly, and inverse supply chain. Later research revealed that six key characteristics were sufficient to classify the end-of-life strategy (Rose et al. 1999a, Rose et al. 1999b). Although not used in classification, another six were included in the implementation of ELDA, to sharpen the tool and increase accuracy. The final research results, described in this chapter, shows six final characteristics are necessary to classify product end-of-life strategies with 86% accuracy (Rose et al. 2000d). Table 4-2 gives the year of the research, number of characteristics and the product characteristics. Table 4-2. Evolution of Product Characteristics (considered for establishing ELDA) Year Number of characteristics Characteristics
1997 24
1998 12
1999 6
External
Size number of parts number of materials number of modules cleanliness level hazards wear out life design cycle technology cycle repurchase cycle reason for obsolescence functional complexity.
Wear-out life Technology cycle Level of integration Number of parts Design cycle Reason for redesign
Wear-out life, design cycle, technology cycle, technology research focus, company design focus, reason for obsolescence, functional complexity
Material
penalties associated with recycling, cleanliness of product number of materials, recycling value drivers, end-of-life path categorization
Disassembly
Disassembly time, disassembly steps, number of modules, number of parts, number of components, disassembly motivation, overall access to components
Inverse Supply Chain
responsibility for recycling cost, responsibility for collection and transportation cost, recycling drop-off centers, trade-in possibilities, beneficiaries of recycling
59
In general, the previous table shows that a wide variety of characteristics influence the end-of-life strategy of the product, many of which are external factors. However, the research seeks to understand how the technical characteristics influenced the end-of-life strategy.
4.2.1
Preliminary factors influencing to end-of-life strategies
The original characteristics, listed in Table 4-3, were chosen resulting from analysis on the case studies and discussions brainstorming characteristics influencing end-of-life strategies with leading researchers (Rose et al. 1998b). After analyzing the case studies and brainstorming, the following characteristics were identified as influencing the product end-of-life treatment. Table 4-3. Original Factors influencing end-of-life strategies FACTORS External
CHARACTERISTICS design cycle wear-out life
technology cycle
technology research focus company design focus reason for obsolescence functional complexity Material
penalties associated with recycling cleanliness of the product number of materials
recycling value drivers end-of-life path categorization
DEFINITION the length of time between successive generation of a product; e.g., 2-4 years for automobiles the length of time until the product no longer meets the original function(s); e.g., 7-10 years for automobiles the length of time before mechanisms supporting the main functions of the product become outdated; e.g., 10-20 years for automobiles; 2-4 years for computers research initiatives in technology improving product features a company's initiatives in environmental design; e.g., ISO 14000 reason a product is no longer is able to perform its intended function; e.g., because of failure of key components or it is outmoded perception of complex interactions between parts and functions the product performs hazardous or unwanted materials that can contaminate components amount of dirt or grime that hinders reuse and recycling number of different materials; e.g., seven materials for single use cameras; forty materials for inkjet printer the components or materials with high profits that drive either material recycling or component reuse percentages of product parts in each end-of-life path assuming disassembly
60
Table 4-3. Original Factors influencing end-of-life strategies, Continued FACTORS Disassembly
CHARACTERISTICS disassembly time number of connectors number of modules number of parts
Disassembly Continued
Inverse Supply Chain
disassembly times/step Disassembly motivation overall access to components responsibility for recycling costs responsibility for collection and transportation costs recycling drop-off centers trade-in possibilities beneficiaries of recycling
4.2.2
DEFINITION best estimate available number and type of connectors, as given in bill of materials number of subassemblies that are physically detachable while preserving functionality approximate number of parts, as given in bill of materials step or time to disassembly part given for the actual or possible end-of-life paths Retrieval of spare parts or material recycling that motivates cost effective disassembly; e.g., automotive parts or gold on circuit boards Estimated by the perception of disassembly time and complexity of interactions between materials Participants who support the infrastructure for the recycling activities participants who support infrastructure for collecting and transporting end-of-life products facilitates consumers’ returning the end-of-life products reimbursement policy for returning end-of-life products participants who receive the service parts or recycled components, providing them with profit
Original Technical Product Characteristics
The focus of the ELDA evolved to technical aspects of the product that designers could influence. Therefore, before the next step in the research, only the technical product characteristics were selected and their definitions are given in Table 4-4. Through the internet, the first implementation of ELDA collected case studies from the Design for Manufacturability course. From this data, CART analysis was performed to develop the first classification of the product characteristics. The resulting classification from these case studies agreed with best industry practice in only 46% of the products. The aim of the research was to have highest accuracy in the classification of the end-of-life strategies and 46% was considered low.
61
Table 4-4. Original Technical Product Characteristics CHARACTER -ISTICS Wear-out life
Design Cycle
Technology Cycle
Repurchase Cycle
Reason for Obsolescence
Functional Complexity
Size
Number of parts Cleanliness Measure
DEFINITIONS The wear-out life is the length of time from product purchase until the product no longer meets original functions. For example, an automobile’s average wear-out life is 10-15 years. For a computer, the wear-out life is approximately 7-10 years. The design cycle is the length of time between successive generations of the product. The design cycle is the frequency that a design team redesigns the product or designs a new product thus making the original product obsolete. For an automobile, the design cycle is 2-4 years. For inkjet printers, the design cycle is 1 year. The technology cycle is the length of time that the product will be on the leading edge of technology before new technology makes the original product obsolete or less desirable. Typically, the technology cycle is 10-20 years for automobiles. On the other hand, the technology cycle of computers is more like 6 months to 1 year. The repurchase cycle is the length of time that elapses before the user feels the need to upgrade their product to one with increased functionality. The repurchase cycle is highly dependent on the type of user, but consider an estimate for the “average” user. An example of repurchase cycle is automobiles, where an “average” user repurchases an automobile every 5 years. The reason for obsolescence is why a product is no longer able to perform its intended function. Products reach their end-of-life for a variety of reasons. A product typically reaches its end-of-life because it is worn-out or because it is outmoded. A product is worn-out when crucial components supporting the key functions of the product fail. A product is outmoded when the user feels the functions are not the best on the market due to technology innovation. Functional complexity addresses the relationship between modules and the functions the modules perform. Given the modularity of the product, a functionally complex product has highly dependent modules that support a variety of functions. On the other hand, a product with low functional complexity has modules that independently support separate functions. The size is the approximate dimensions of the product. Please classify the products as either hand-held, arm-held or needs a forklift. A digital copier and washing machine require a forklift or hand truck to move them, thus they are considered large in size. An inkjet printer and television (standard) are medium-sized because they can be carried in the arms. A cellular phone or single use camera are hand-held and therefore small. The number of parts is the approximate number of parts in the product. As a product is used, different amounts of dirt or filth build up. The more dirt or filth, the more work that has to be done to prepare the product for reuse and recycling. The product may provide the function of cleaning dirty materials or may produce a dirty substance during use. For example, a washing machine is designed to remove dirt from clothes while the single use camera does not get dirty from normal use.
62
Table 4-4. Original Technical Product Characteristics, Continued CHARACTER -ISTICS Number of Materials Number of Modules Hazards
DEFINITIONS For the product, try to count the number of different materials to your best knowledge. A single use camera excluding the film has seven different materials, while an inkjet printer has forty different materials. The number of modules is the number of subassemblies that are physically detachable and still preserve function. The single use camera has 3 modules while the inkjet printer has 5 modules. The penalties associated with recycling include hazardous or unwanted materials that contaminate components. Included in this penalty is the need to remove certain materials before further recycling, because of hazards to humans, the environment or contamination of parts. For example, the single use camera batteries are considered hazardous.
Wear-out life, design cycle, technology cycle and repurchase cycle are continuous variables ranging from 0-10 years. Reason for obsolescence, functional complexity, cleanliness measure and hazards are categorical variables with ranges associated with the responses given by the user. Size (0-10), number of parts (0-1000), number of modules (0-100) and number of materials (0-100) are all continuous variables with the ranges given in parenthesis. Using the collected input data, the variables used in CART were altered to see which product characteristics had the greatest effect on the classification tree. In the initial iteration, the twelve product characteristics, twenty products and their end-of-life strategies were used. In sixteen possible classification trees identified, six product characteristics were relevant for establishing a classification tree – number of functions, level of integration, number of parts, cleanliness measure, technology cycle and number of materials. The other product characteristics – size, number of modules, reason for obsolescence and functional complexity – were not used in the classification trees. Wearout life, design cycle, repurchase cycle and hazards were used infrequently in the classification tree. The resulting classification tree, shown in Figure 4-5, has three main branches separated by the product’s technology cycle. The three branches are roughly equivalent with number of parts and level of integration used as the second and third level classifiers, respectively.
63
B
>16 16 16 16
dirty clean dirty
16 16 16 =2 for a factor. p+1 Splitting option 1=anova; 2=event rates; 3=gini p+2 Minimum bucket size suggested value =5 p+3 Minimum split size 10 p+4 primary splits to print >2 p+5 # surrogates to print >2 p+6 use of surrogates 3 p+7 Number of cross validations 10 p+8 Missing value depends on data p+9 Complexity cutoff .005 p+10 Empty An example control file is as follows: /afs/ir.stanford.edu/users/c/a/catrose/cart/f1105wt.dat 13 46 eols 5 wotech 0 techcyc 0 nuofparts 0 levofint 3 nuoffunc 3 nuofmatls 0 reforre 5 dgncyc 0 wolife 0 repur 0 size 0 hazards 0 3 2 6 3 3 2 19 9999 .005 0
160
The CART program is located in the subdirectory: /afs/ir/class/stat315b/cart/rpmain on the leland server at Stanford University. To run the program, the command used in the leland subdirectory is: rpmain xxx > outfile, where xxx is the control file and then print the outfile. The output of the program is given below. Table of complexity parameters Tree C.P. #splits rel error cross-validated error 1 0.1538 0 1.0000 1.0000 +- 0.1293 2 0.0769 2 0.6923 1.0000 +- 0.1293 3 0.0577 5 0.4615 1.1154 +- 0.1259 4 0.0385 7 0.3462 1.0769 +- 0.1273 5 0.0050 8 0.3077 1.0000 +- 0.1293 Node number 1: 46 observations Complexity param= 0.153846 predicted class = 3, expected loss = 0.565217 class counts: 5 5 20 7 9 probabilities: 0.109 0.109 0.435 0.152 0.196 left son=2 (27 obs), right son=3 (19 obs) Primary splits: wolife < 10.5 to the left, improve=5.068, (0 missing) nuofparts < 625.5 to the left, improve=4.681, (0 missing) dgncyc < 3.5 to the left, improve=4.470, (0 missing) Surrogate splits: techcyc < 6 to the left, agree=0.870, adj=0.684, (0 split) dgncyc < 3.5 to the left, agree=0.870, adj=0.684, (0 split) repur < 12 to the left, agree=0.804, adj=0.526, (0 split) Node number 2: 27 observations Complexity param= 0.057692 predicted class = 3, expected loss = 0.333333 class counts: 1 0 18 2 6 probabilities: 0.037 0.000 0.667 0.074 0.222 left son=4 (13 obs), right son=5 (14 obs) Primary splits: levofint splits as RLL, improve=2.086, (0 missing) nuoffunc splits as RLL, improve=2.086, (0 missing) repur > 6.5 to the left, improve=1.905, (0 missing) Surrogate splits: techcyc < 2.5 to the left, agree=0.741, adj=0.462, (0 split) wotech > 2.25 to the left, agree=0.704, adj=0.385, (0 split) nuoffunc splits as RLL, agree=0.704, adj=0.385, (0 split) Node number 3: 19 observations Complexity param= 0.153846 predicted class = 2, expected loss = 0.736842 class counts: 4 5 2 5 3 probabilities: 0.211 0.263 0.105 0.263 0.158 left son=6 (11 obs), right son=7 (8 obs) Primary splits: nuofparts < 108 to the left, improve=3.638, (0 missing) size < 8 to the left, improve=2.274, (0 missing) repur > 12 to the left, improve=2.001, (0 missing) Surrogate splits: nuofmatls < 27.5 to the left, agree=0.789, adj=0.500, (0 split)
161
size < 8 to the left, agree=0.789, adj=0.500, (0 split) nuoffunc splits as LLR, agree=0.737, adj=0.375, (0 split) Node number 4: 13 observations predicted class = 3, expected loss = 0.153846 class counts: 1 0 11 1 0 probabilities: 0.077 0.000 0.846 0.077 0.000 Node number 5: 14 observations Complexity param= 0.057692 predicted class = 3, expected loss = 0.500000 class counts: 0 0 7 1 6 probabilities: 0.000 0.000 0.500 0.071 0.429 left son=10 (5 obs), right son=11 (9 obs) Primary splits: nuofparts > 50 to the left, improve=1.813, (0 missing) hazards > 2.25 to the left, improve=1.675, (0 missing) nuoffunc splits as RL-, improve=1.557, (0 missing) Surrogate splits: nuofmatls > 12.5 to the left, agree=0.786, adj=0.400, (0 split) techcyc > 4.5 to the left, agree=0.714, adj=0.200, (0 split) reforre splits as -RLRR, agree=0.714, adj=0.200, (0 split) Node number 6: 11 observations Complexity param= 0.076923 predicted class = 4, expected loss = 0.545455 class counts: 1 0 2 5 3 probabilities: 0.091 0.000 0.182 0.455 0.273 left son=12 (4 obs), right son=13 (7 obs) Primary splits: reforre splits as RRLRL, improve=2.597, (0 missing) repur < 12 to the left, improve=2.312, (0 missing) size < 2.5 to the left, improve=1.899, (0 missing) Surrogate splits: wotech > 3.55 to the left, agree=0.818, adj=0.500, (0 split) techcyc < 5.5 to the left, agree=0.818, adj=0.500, (0 split) nuofparts > 77.5 to the left, agree=0.818, adj=0.500, (0 split) Node number 7: 8 observations Complexity param= 0.076923 predicted class = 2, expected loss = 0.375000 class counts: 3 5 0 0 0 probabilities: 0.375 0.625 0.000 0.000 0.000 left son=14 (4 obs), right son=15 (4 obs) Primary splits: dgncyc > 6 to the left, improve=2.250, (0 missing) wolife > 17.5 to the left, improve=2.250, (0 missing) repur > 12 to the left, improve=2.250, (0 missing) Surrogate splits: reforre splits as RLR-R, agree=0.875, adj=0.750, (0 split) techcyc > 6 to the left, agree=0.750, adj=0.500, (0 split) nuofparts < 859 to the left, agree=0.750, adj=0.500, (0 split) Node number 10: 5 observations predicted class = 5, expected loss = 0.200000 class counts: 0 0 1 0 4
162
probabilities: 0.000 0.000 0.200 0.000 0.800 Node number 11: 9 observations Complexity param= 0.038462 predicted class = 3, expected loss = 0.333333 class counts: 0 0 6 1 2 probabilities: 0.000 0.000 0.667 0.111 0.222 left son=22 (5 obs), right son=23 (4 obs) Primary splits: nuofparts > 13 to the left, improve=1.944, (0 missing) nuofmatls > 5.5 to the left, improve=1.730, (0 missing) hazards > 1.75 to the left, improve=1.244, (0 missing) Surrogate splits: wotech < 1.8 to the left, agree=0.889, adj=0.750, (0 split) wolife < 9 to the left, agree=0.889, adj=0.750, (0 split) nuofmatls > 5.5 to the left, agree=0.778, adj=0.500, (0 split) Node number 12: 4 observations predicted class = 4, expected loss = 0.000000 class counts: 0 0 0 4 0 probabilities: 0.000 0.000 0.000 1.000 0.000 Node number 13: 7 observations Complexity param= 0.076923 predicted class = 5, expected loss = 0.571429 class counts: 1 0 2 1 3 probabilities: 0.143 0.000 0.286 0.143 0.429 left son=26 (4 obs), right son=27 (3 obs) Primary splits: hazards > 1 to the left, improve=2.024, (0 missing) dgncyc < 2.5 to the left, improve=1.257, (0 missing) size < 2.5 to the left, improve=1.257, (0 missing) Surrogate splits: reforre splits as RL-L-, agree=0.857, adj=0.667, (0 split) techcyc > 9.5 to the left, agree=0.714, adj=0.333, (0 split) nuofparts < 14 to the left, agree=0.714, adj=0.333, (0 split) Node number 14: 4 observations predicted class = 2, expected loss = 0.000000 class counts: 0 4 0 0 0 probabilities: 0.000 1.000 0.000 0.000 0.000 Node number 15: 4 observations predicted class = 1, expected loss = 0.250000 class counts: 3 1 0 0 0 probabilities: 0.750 0.250 0.000 0.000 0.000 Node number 22: 5 observations predicted class = 3, expected loss = 0.000000 class counts: 0 0 5 0 0 probabilities: 0.000 0.000 1.000 0.000 0.000 Node number 23: 4 observations predicted class = 5, expected loss = 0.500000 class counts: 0 0 1 1 2 probabilities: 0.000 0.000 0.250 0.250 0.500 Node number 26: 4 observations predicted class = 5, expected loss = 0.250000 class counts: 0 0 0 1 3
163
probabilities: 0.000 0.000 0.000 0.250 0.750 Node number 27: 3 observations predicted class = 3, expected loss = 0.333333 class counts: 1 0 2 0 0 probabilities: 0.333 0.000 0.667 0.000 0.000
164
Appendix IV. ELDA Development Figure IV-1 shows the classification tree used in the ELDA web tool.
ELDA Decision Tree Structure Wear-out life/ technology cycle >4 Technology cycle < 2.5 3
1< X 50
13 < X < 50
> 13
5
3
5
108 Design Cycle
>6 Reason for Redesign 3, 5
2