Proceedings of DETC ‘97 1997 ASME Design Engineering Technical Conferences September 14 - 17, 1997, Sacramento, CA
DETC97 / DFM-4359 DESIGN FOR VARIETY: DEVELOPMENT OF COMPLEXITY INDICES AND DESIGN CHARTS
Mark V. Martin Department of Mechanical Engineering Stanford University Stanford, CA
[email protected]
Kosuke Ishii Department of Mechanical Engineering Stanford University Stanford, CA
[email protected]
ABSTRACT This paper describes methods to help project leaders and engineers manage the costs of providing variety to the market. As companies look for ways to stay competitive in the global marketplace, the concept of mass customization has appeared as a potential advantage. Armed with new manufacturing and information technologies, companies are trying to determine the amount of variety that they should offer to optimize profits. Our Design for Variety (DFV) research focuses on methodologies which will help companies quantify the costs of providing variety and will qualitatively guide designers in developing products that incur minimum variety costs. The proposed tools incorporate quantitative indices and qualitative design charts. Examples from electronics and automotive industries illustrate the utility of the tools. KEYWORDS: Commonality, Modularity, Late-Point Differentiation, Supply Chain, Design for Manufacturability
profits by offering competitively priced products to smaller niche markets. With this new vision, numerous companies have raced to increase the number of products that they offer to the customer. The premise of mass customization is based on the ability to produce increasing amounts of product include flexible (i.e., rapid setup) equipment, user-friendly information technology systems, sophisticated distribution strategies, and new management structures that accommodate the short cycle times and increasing complexity of offering numerous products to the marketplace. Unfortunately, the true costs of providing variety are not always understood, and companies may actually see lower profits than expected. Some companies, such as Denso International and Mabuchi Motor recognize this potential problem and have taken actions to contain the amount of variety they offer (Henkoff, 1995).
1. INTRODUCTION Pine (1993) introduced a paradigm called “mass customization” which appears to be the successor to the concept of mass production. This new paradigm takes the best attributes of the mass production system (mainly the ability to produce quality items at a low cost due to economies of scale) and combines it with the ability to offer to the marketplace a wide variety of “customized” products. Thus, this new system would enable a company to increase its market share and
1.1 Industry Interest Research on DFV (Ishii et al., 1995) initially addressed appliances at GE, where the proliferation of refrigerator products was becoming a concern. Since that time, numerous companies have expressed their interest in the topic and they seek descriptive and prescriptive methods to help them handle variety in their design and manufacturing operations. We are currently working with Hewlett-Packard, Denso International, Boeing, and Ford to help them understand how variety affects their costs.
To gain industry input, we hosted a symposium in October, 1996 on the topic of Design for Variety. Invitees included members of the Stanford Global Supply Chain Forum, the Stanford Integrated Manufacturing Association (SIMA), and the Global Manufacturing Associates. The symposium consisted of presentations from industry and academia on topics related to DFV. Over twenty companies sent representatives to hear the speakers listed in Table 1. Table 1. Topics at October 1996 Stanford Design for Variety Symposium Topic Variety Challenges in the Commercial Aircraft Industry Flexible Manufacturing of Automotive Component Variety Providing Variety in a High-Mix, LowVolume Environment Product Variety Across Generations DFV Tools: Examples from the Appliance Industry Designing Flexible Manufacturing Processes to Handle Variety DFV: A Methodology for Understanding the Costs of Product Proliferation
Company Boeing Denso HewlettPackard Seagate Stanford Raychem Stanford
Feedback from the symposium verified the high degree of interest that companies have in this topic. Many companies commented that they would be interested in applying the various tools that were being developed, and offered their companies as potential validation sites. Most respondents requested an annual symposium on DFV and we are exploring this idea further. 1.2 Related Literature In his book, Pine points to three factors which are driving the demand for increased variety: • • •
Swaminathan & Tayur (1995) investigated the best location for stocking “vanilla” assemblies in order to manage broader product lines in the computer industry. The authors take a prescriptive approach by developing an algorithm which tells the manufacturing manager where to hold inventory. Their model bases variety costs on stock-out and inventory costs. Gupta & Krishnan (1996) proposed an algorithmic approach to determining the best assembly sequence for a given set of products. Their work prescribes an algorithm to develop subassemblies which will increase component commonality. Various other authors are addressing related topics such as modularity (Ulrich & Eppinger, 1994) and postponement (Lee et al., 1993). Work in this area continues to grow.
increasing heterogeneity in a company’s targeted marketplace wider income distribution within the market slower growth within the market
These factors are putting pressure on companies to increase their variety and in turn are spurring increased interest in the topic. For instance, MacDuffie et al. (1996) looked at the effects of product variety within the automotive industry utilizing data from the MIT International Motor Vehicle Program. The authors took a descriptive approach and studied empirical data in order to determine how variety affected manufacturing. Their dependent factors were direct labor productivity and quality. They found that “part complexity” (a measure defined by the authors) has a negative impact on productivity.
1.3 Proposed Design Tools Our work focuses on giving product engineers tools to help them design products which are optimized for variety. The proposed qualitative tools give engineers and managers a broad view of best practices in designing for variety. We are also developing the quantitative tools to give more specific data on indirect costs associated with variety. With cost data in hand, managers can make better decisions on what variety to offer and where to apply resources in order to reduce the costs of providing variety. The following sections detail our current research efforts. Section 2 & 3 address our research on quantitative and qualitative tools. Section 4 discusses our conclusions and future work. 1.4 Research approach Stanford’s DFV research seeks to develop academic concepts, combine them with the work of others, and compile them in a format that can be utilized by practicing engineers. Empirical data from industry guides us in developing our quantitative tools, and case studies help us develop our qualitative tools. This collaborative activity has involved numerous meetings and conversations with our industrial partners. Specifically, our goals are to develop: • • •
Quantitative tools to estimate manufacturing costs of providing variety Qualitative tools to increase managers’ and engineers’ understanding of how to reduce those costs Qualitative methods to determine customer preference for variety
The first and second goals have been our main focus to this point and our on-going work is described below. The last goal, a method to determine customer preference for variety, leaves us a significant challenge for the future.
2
Copyright © 1997 by ASME
2. RESEARCH: QUANTITATIVE TOOLS Generally, when a product manager wants to determine if it is profitable to have more variety within a current or future product line, they look at the direct costs of increased variety. Will it require more capital equipment or more space to have more product extensions? How many hours of engineering time will it require to make new drawings, analyze the new design, run certification or qualification tests, etc.? Will any suppliers have to be added? However, the estimation of indirect costs associated with providing variety is significantly more difficult. Areas which are impacted by variety include: • • • • • • • •
logistics of managing variety quality change in capacity due to set-ups raw material inventory work-in-process (WIP) inventory finished goods inventory (FGI) post-sales service inventory etc.
• •
u = # unique part numbers pj = # parts in model j vn = final # of varieties offered
2.2 Differentiation Index (DI) The differentiation index measures where differentiation occurs within the process flow. By differentiating later, you can decrease work-in-process (WIP) and the complexity of your assembly operation. Also included in this index is a measure of where and how much value is added in the flow. The lower the DI, the better, as this indicates that value is being added later in the process flow. n
DI =
u − max pj
∑
(2)
n
i =1
0 < DI ≤ 1 vi = # of different products exiting process i n = # of processes vn = final # of varieties offered di = average throughput time from process i to sale d1 = average throughput time from beginning of production to sale ai = value added at process i
2.3 Setup Index (SI) The setup index is an indirect measure of how switchover costs contribute to the overall costs of the product. Note that this is not a direct measure of how much setups actually cost the company, since that is contingent upon the length of the production runs. Rather, it is meant to act as a general indicator of how substantial setups are for the product being considered. n
2.1 Commonality Index (CI) The commonality index is a measure of how well the design utilizes standardized parts and is similar to work done by Collier (1981). A higher CI is better since it indicates that the different varieties within the product family are being achieved with fewer unique parts.
vn
i =1
nd 1vn ∑ ai
Commonality Index (CI) – measure of number of unique parts Differentiation Index (DI) – measure of where product is differentiated and where value is added Setup Index (SI) – measure of product switchover costs
CI = 1 −
∑dva
i i i
While a detailed analysis might allow a company to determine some of these costs, managers and engineers generally do not have the time or the resources for such studies. What they need is a simple quantitative tool that quickly estimates the costs of increasing or reducing variety. Such a tool will help focus the decision makers on where variety can be added profitably and where it should be avoided. Our previous work (Martin & Ishii, 1996) proposed a set of indices to capture the “amount” of variety within a design. These indices are then to be correlated with indirect costs to determine if we can measure the costs of providing variety. The indices are: •
0 < CI ≤ 1
∑vc
i i
SI =
i =1 vn
∑
(3) Cj
j =1
(1)
pj − max pj
j =1
3
Copyright © 1997 by ASME
0 ≤ SI ≤ 1 vi = # of different products exiting process i ci = cost of set - up at process i Cj = total cost (material, labor, and overhead) of jth product
2.4 Quantitative Tool The proposed quantitative utilizes the three indices above in a regression equation currently being developed. Data from Hewlett-Packard’s Microwave Instruments Division provides the basis for our research on determining this equation. We are developing the indices for a number of different product lines and running regressions with the collected cost data utilizing HP’s activity-based cost accounting system. We hope to find correlations which will enable us to estimate the costs of providing variety. This work is currently in progress. Table 2 shows where we might expect to find significant correlation’s between the indices and the indirect costs of providing variety.
3. RESEARCH: QUALITATIVE TOOLS Our industry partners constantly remind us that they need qualitative tools to help them graphically understand how variety is affecting their manufacturing operations. These tools would act as a training tool in helping engineers and managers understand the effect of variety. It would also act as a means to quickly convey information about the manufacturing structure of the current design across marketing, design, and manufacturing functions in a concurrent engineering paradigm. We have developed such tools and these are discussed in the next few pages. We use as an example a real product (an instrument cluster for an automobile). The name of the company (Tenko) has been disguised. Views of the instrument cluster can be seen in Figures 1 and 2.
Table 2. Relation between indices and indirect costs of providing variety Indirect Costs of Providing Variety LOGISTICS Drawing maintenance Supplier maintenance Expediting Documentation Information technology Management complexity MATERIAL Volume discounts Material handling LABOR Setups Training Learning curve losses QUALITY Incorrect parts in assembly Wrong process used for subassembly Wrong test or inspection process HOLDING Raw material, WIP FGI Field service inventory End of life buy
CI
DI
√ √ √ √ √ √
√
√ √ √
√ √ √
SI Figure 1: Instrument cluster (front view)
√ √
√
√
√ √ √
√ √ √
√ √
√ √
√
√
√
√
√
√ √
√
√ √
Figure 2: Exploded view of instrument cluster 3.1 Process Sequence Graph Our first proposed graphical representation is called the Process Sequence Graph (PSG). It shows the flow of the
4
Copyright © 1997 by ASME
product and its differentiation points. In Figure 3, we see the PSG for a Tenko instrument cluster for a 1996 model. Tenko provides the company with eighteen different panels for this model alone. As can be seen in the figure, differentiation begins on the second process - the insertion of the Flexible Printed Circuit (FPC) board.
Case variety of components
number of nodes
1
1
FPC 5
5
AT Ind 2
5
process sequence which minimizes the number of “nodes” (denoted by circles in Figure 3) can be an appropriate measure. By minimizing the number of nodes you are minimizing inventory holding points, complexity of logistics, etc. The process sequence flow giving the minimum nodes for the Tenko example is shown in Figure 4.
Tenko
Tenko
Instrument Cluster Process Sequence Graph
Instrument Cluster Process Sequence Graph
Current Layout
Improved "Ascending Order" Process Layout (minimize nodes)
Fuel 2
5
Temp 4
7
Tacho 6
7
Speed 5
11
Bulb Pattern 11
Window Plate 1
Glass Front 1
Final Assy
Case variety of components
18
1
1
2
2
3
3
1
Window Plate 1
Glass Front 1
AT Ind 2
Fuel 2
Temp 4
FPC 5
Tacho 6
Speed 5
Bulb Pattern
Final Assy
11
18
1
1
2
2
3
3
4
4
4
4
5
5
9
1 5
6
6
9
1 4
5
7
5
7
6
8
6
8
5
9
5
5
7
1 0
6
6
8
1 1
1 1
1 7
7
1 2
1 1
1 8
8
1 3
9
1 4
9
1 5
1 0
1 6
1 1
1 7
1 1
1 8
18
18
18
18
7 8 7 8
1 2 1 3 1 0 1 1
5
9
1 0
1 6
18
18
Total
Total
113
number of nodes
1
1
1
2
2
4
7
7
11
72
Figure 3: Process sequence graph for current Tenko layout
Figure 4: Process sequence graph for improved Tenko layout
Lee et al. (1993), in a case study of a Hewlett-Packard product, show the benefit of postponing differentiation until late in the process. Differentiating the product later in the assembly process can help reduce inventory costs and complexity of the manufacturing system. Of course, the effect of this strategy depends on how long the manufacturing process takes with respect to the required customer lead time. For instance, if a product takes a short time to build (e.g., ten minutes), and if the lead time demanded by customers is on the order of days or more, shifting the differentiation point will probably not have a significant effect (at least on inventory). However, if the product takes ten minutes to build and the customer wants the product within five minutes, then differentiating later will have a much larger benefit on variety costs and complexity. For example, imagine how much more inventory and complexity there would be if a hamburger restaurant promised customers a hamburger within five minutes, yet decided what was on the hamburger right when they put it on the grill (for instance they put the onions, cheese, etc. within the patty). Assuming it takes ten minutes to cook the hamburger, then to meet the five minute goal the cook would either need to be a great forecaster of demand, or would need to keep inventory for the different varieties. Thus, the ratio of “procurement + manufacturing + distribution lead time” to “customer’s desired lead time” is critical to deciding the benefits of later differentiation (Mather, 1987). Continuing with the Tenko example, we looked for a simple representation of differentiation. We decided that the
This new sequence reduces the number of node points from 113 in the “Current” Tenko manufacturing process to 72. Note that this new layout minimizes the number of nodes without accounting for any assembly constraints (for instance, the Fuel indicator must be assembled prior to the Window Plate being installed). However, we list it here to show the best-case example of node minimization. 3.1.1 Algorithm for Optimal Process Sequence Determining the process flow that minimizes the number of nodes is not trivial. One approach to minimization was to place the processes in ascending order of the number of component varieties for that particular process (e.g., Case, Window Plate and Glass Front have only one variety of component so they are assembled first; Automatic Transmission Indicator and Fuel indicator have two different varieties, so they are assembled next, and so on). However, such a layout was proved to be sub-optimal. In this case, assembling the Tachometer indicator (six different component varieties) before the Speedometer (five different component varieties) would reduce the number of nodes. One method to finding the minimum number of nodes is simply to enumerate all of the different process sequence permutations and then count the number of nodes for each enumeration and select the minimum. As one can imagine this approach becomes unwieldy quite fast since the number of different permutations is n! (where “n” is the number of
5
Copyright © 1997 by ASME
process steps). For the Tenko instrument cluster, this would be 10! or over 3.6 million. Instead, we are currently developing an algorithm to determine the process sequence which will minimize the nodes. The approach we take is as follows: 1) Look at all the pair-wise combinations of the processes (e.g., Case/Window Plate, Case/Glass Front, Case/AT Ind, etc.) This approach significantly reduces the number of calculation steps since: n! PairwiseCombinations = = (n)(n − 1) / 2 2 !(n − 2)! 2) For each of these pairings, count the number of different utilized combinations of the component varieties. For instance, there are two AT Indicators (AT1 & AT2) and two Fuel gauges (F1 & F2). While there could be up to four different combinations, the only ones actually used are AT1F1 & AT2F2. Thus, the AT Indicator/Fuel gauge combination has two variety combinations. 3) Once we have calculated from step 1 the variety combinations for all pairs (forty-five in the case of our ten process steps), we start with the lowest variety combination number (from step 2) and assign those two processes to the first two slots. 4) To determine the order of the two, you must look at all variety combination numbers containing these two processes and the one that has the lowest number among these other variety combinations will be placed second.
developed a series of charts which document the commonality of components with respect to: • • •
process sequence lead-time of components amount of variety desired by customer
3.2.1 Process Sequence vs. Commonality We derive the commonality index for each component or subassembly (CIcomp). It looks at the individual processes separately to determine the amount of commonality for each component. The formula is: CI = 1 −
u −1 vn − 1
(4)
0 < CI ≤ 1 u = # unique part numbers vn = final # of varieties offered For each process we can calculate an index. An index of 1 indicates that only one component is utilized for all varieties of the product (a desired situation). The CIcomp for the current Tenko layout (seen in Figure 3) is graphed in Figure 5. Component Commonality Current Layout 100%
100% 94%
90%
5) In case of ties, you will want to minimize the number of nodes at the intersection between the lower variety combination number and the next higher variety combination number. This will require some additional calculations.
Target Region
94% 82%
80%
76%
76% 71%
70% Commonality
100%
100%
60% 50% 41%
40% 30% 20%
3.2 Commonality Graphs Standardization of components and subassemblies is often an important goal for product managers. Standardizing parts and subassemblies usually leads to reduced inventory and complexity. The previously discussed quantitative tools attempt to correlate various indices (including a commonality index) with actual costs. In addition, our industry partners wanted visual tools to communicate commonality measures to marketing, design, and manufacturing personnel. We have
10%
Glass Front
Plate
Window
Bulb Pattern
Speed
Tacho
Temp
Fuel
AT Ind
FPC
0% Case
This algorithm seeks to reduce the number of nodes. We are equating the node-count reduction to a reduction in inventory and complexity costs. Our work at HP is currently attempting to quantify how the reduction in nodes might actually affect cost. Note that the algorithm currently does not account for precedence constraints within the manufacturing processes. This will be included in future work.
Process Sequence
Figure 5: Component commonality for current Tenko layout The curved line in the graph gives an estimated region that you want to stay within. Early in the assembly process you want to have high commonality (close to 100%) among your components and then begin differentiating later in the process. Thus, the curve slopes downward. The actual shape of this curve depends on a number of factors, such as degree of automation, customer required lead times, complexity of assembly operation, scrap rates and cost of scrap, coefficient of variation in demand, etc.
6
Copyright © 1997 by ASME
In Figure 6, we see the commonality graph for the “Improved Ascending Order Layout” that has been previously discussed (seen in Figure 4).
Leadtime vs. Commonality
100%
Component Commonality Improved "Ascending Order" Layout
Target Region
90% 80%
AT Ind
Fuel Temp Speed Tacho
FPC
100%
100%
100%
100%
94%
90%
94%
Target Region 82%
80% Commonality
Commonality
70%
76%
76% 71%
70% 60%
60% 50% Bulb
40%
Leadtime Scale
30%
10 = w eeks
20%
50%
3 = days
10%
41%
40% 30%
1 = hours
0% 0
20%
2
4
6
8
10
Leadtime
10% Bulb Pattern
Speed
Tacho
FPC
Temp
Fuel
AT Ind
Glass Front
Window Plate
Case
0%
Figure 7: Lead time vs. Commonality for Tenko product
Process Sequence
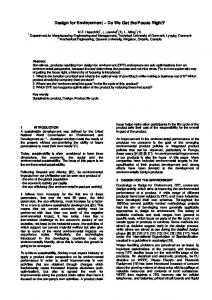
Figure 6: Component commonality for new sequence layout 3.2.2 Lead-time vs. Commonality Another important consideration when looking at commonality is the lead-time required to purchase or manufacture the component. Even if you have low commonality for a component, you can eliminate some of the negatives associated with this lack of standardization if the component has a short lead-time. For instance, Tenko has a low commonality index for the bulb pattern (41%), but this number is not a problem if the lead time from their supplier (either internal or external) is short. In the case of the bulb pattern, the lead time to supply a different variety is very short (seconds) since the pattern is differentiated by simply placing standard bulbs in a different configuration during assembly. The lead time versus commonality graph captures this information and is shown in Figure 7.
The line delineating the “target region” is shown for representative purposes only and will be different for different types of products and manufacturing lines. This graph indicates that for the long lead time items (Fuel, Temp, etc.) you want as close to 100% commonality as possible. The main driver behind this is the inventory cost reductions associated with safety stocks. As can be seen from this graph, the Speedometer, Tachometer, and Temperature gauges have long lead times and low commonality ratings. One solution would be to reduce the lead time of these components. However, this is difficult because these components are currently sourced from Japan, and the lead time is mainly tied up in shipment. Another option is to standardize the components, but this is problematic because of the desire of the customer base to have different type of gauges (this is discussed in the next section). What Tenko ended up doing for the Speedometer was to split the assembly into two parts: the dial face (what the customer sees) and the motor. The dial was then manufactured at the U.S. facility, while the motor was standardized and continued to be sourced from Japan. The two components were then mated on the assembly line. This allowed them to offer the variety needed by the customer, while minimizing the effects of long lead times. The new lead time chart is shown in Figure 8.
7
Copyright © 1997 by ASME
Leadtime vs. Commonality Modified Speedometer Subassembly
Speed motor
100%
Target Region
90%
AT Ind
Fuel
Speed dial
80%
Temp Tacho
70% Commonality
determine whether or not the component has a direct impact on the customer. If a component is not important to the customer, then it should be standardized, unless technically it is the only way to provide other variety which is important to the customer. V2OC Rating vs. Commonality
60% 50% Bulb
40%
Case 100%
Leadtime Scale
30%
10 = w eeks
20%
Fuel
90%
3 = days
10%
Window Glass
80%
1 = hours
Speed Tacho
70% 0
2
4
6
8
Commonality
0% 10
Leadtime
Figure 8: Lead time vs. Commonality for Tenko product – improved design
AT Ind
Temp FPC
60% 50%
Target Region Bulb
40% 30% 20% 10% 0% 0
2
4
6
8
10
2
V OC Rating
Figure 9: V2OC rating vs. Commonality for Tenko product 4. CONCLUSIONS & FUTURE WORK We are continuing to develop various quantitative and qualitative tools for aiding engineers and product managers in dealing with the increasing amounts of variety within their product line. Figure 10 shows a matrix listing our research requirements and how the tools under development address those requirements. These tools will be developed in the future work discussed below.
2
V OC Methodology (in progress)
Conjoint Analysis
2
V OC Graph
Process Commonality Graph
Positive Weak Positive
Product Structure Graph
Strong Positive
SI (Setup Index)
Legend
DI (Differentiation Index)
CI (Commonality Index)
Tools
Research Requirements
3.2.3 Customer Requirements for Variety Of course the reason for having variety in the various components is so that variety can be offered to the customer. We want to keep the engineers and managers focused on the variety that is of value to the customer. Just as quality function deployment (QFD) attempts to keep the different technical attributes of the product tied to customer needs, there should be a sense of how important component variety is to the customer. Thus, we want to represent what we are calling Variety Voice of the Customer (V2OC). This is a measure of the importance of a component’s variety to the aggregated market – not the individual buyer. V2OC is a measure of the importance of the component to the customer, as well as the heterogeneity of the market with respect to that component. There are techniques that measure such attributes (e.g., conjoint analysis) and what we want to represent graphically is the importance of variety versus the amount of variety (commonality) actually offered. Figure 9 shows the ratings for the Tenko instrument panel. These ratings were developed by our Tenko liaison based on his experience with instrument clusters. More formalized methods are being looked at for generating these ratings. The high V2OC ratings for the AT Indicator and the Speedometer indicate that these are important components to the customer, and that there is a dispersion in how people want these devices to “act” and “look”. It is important that these components not be commonized too much or Tenko may lose customers. On the other hand, an item such as the Flexible Printed Circuit (FPC) board is low on the rating, and thus should be standardized to the extent possible. One difficulty arises with how to deal with components which the customer does not care about, but which enables variety that the customers do want (for instance, having different circuit boards which allow different speedometer functions). Our approach is to only
Estimate manufacturing cost of providing variety (CPV) - QUANTITATIVE Increase managers understanding of how to decrease CPV - QUALITATIVE Determine customer preference for variety QUANTITATIVE
Figure 10: Research requirements vs. developed tools 4.1 Hewlett-Packard Microwave Instruments Division HP is providing us the test bed for the quantitative analysis of our DFV project. The data gathering process to determine the indices and find the cost data is non-trivial, but
8
Copyright © 1997 by ASME
is giving us numerous insights into just how much complexity variety brings to the manufacturing floor. The data will then be used to determine if there are correlation’s between our indices (or derivatives thereof) and the actual costs seen by the projects. 4.2 Tenko The Tenko collaboration addresses their manufacturing assembly process and supply chain to determine how they might be able to reduce the complexity and inventory costs associated with the variety that they offer. We are working closely with their manufacturing organization to determine how our qualitative charts can benefit them. 4.3 Algorithm for Optimal PSG In addition to the empirical work that is being done with Tenko and HP, work will continue on further developing the algorithm to determine the process sequence which will minimize the number of nodes. A method for integrating precedence constraints will be considered. Also, data from the HP study will be used to determine if there are correlation’s between number of nodes and costs.
MacDuffie, J. P., K. Sethuraman, et al. (1996). "Product Variety and Manufacturing Performance: Evidence from the International Automotive Assembly Plant Study." Management Science 42(3): 350-369. Martin, M.V. and K. Ishii (1996). “Design for Variety: A Methodology for Understanding the Costs of Product Proliferation.” ASME Design Engineering Technical Conference Proceedings, August 1996, Irvine, CA. Mather, H. (1987). "Logistics in Manufacturing: A Way to Beat the Competition." Assembly Automation 7(4): 175-178. Pine, B. Joseph II (1993). Mass Customization: The New Frontier in Business Competition. Harvard Business School Press, Boston, MA. Swaminathan, J. and S. Tayur (1995). Working Paper. “Managing Broader Product Lines Through Delayed Differentiation Using Vanilla Boxes.” Graduate School of Industrial Automation, Carnegie Mellon University. Ulrich, Karl T. and Steven D. Eppinger, (1994). Methodologies for Product Design and Development. McGraw-Hill, New York, NY.
Rev 1 (9/13/97) - updated acknowledgments
ACKNOWLEDGMENTS The sponsors of this research include the National Science Foundation, Stanford Integrated Manufacturing Association, Stanford Global Supply Chain Forum, and the Department of Energy Integrated Manufacturing Fellowship. The authors would like to thank Professor Warren Hausman and Kyle Cattani of the Stanford IEEM department for their work. Mark Steiner of GE Appliances helped us define the product structure tree. Kazuo Tatsukami of Matsushita helped originate the commonality charts while at Stanford as a visiting scholar in 1996. Kikuo Fujita of Osaka University provided insights into our variety indices, and Ryan Bruneau worked on the CAD drawings. We would also like to thank our industrial collaborators at Hewlett-Packard, Tenko, GE, and Boeing. REFERENCES Collier, David (1981). “The Measurement and Operating Benefits of Component Part Commonality.” Decision Sciences. Vol. 12, No. 1, January 1981, pp. 85-97. Gupta, S. and V. Krishnan (1996). Working Paper: "A Product Family-Based Assembly Sequence Design Methodology for the Economic Attainment of Product Variety.” Management Department, The University of Texas at Austin. Henkoff, Ronald (1995). “New Management Secrets from Japan – Really.” Fortune, November 27, 1995, pp. 135 - 146. Ishii, K., Juengel, C., Eubanks, C.F. (1995). "Design for Product Variety: Key to Product Line Structuring." ASME Design Engineering Technical Conference Proceedings, September 1995. Boston, MA, Vol. 2, pp. 499-506. Lee, H., C. Billington, et al. (1993). "Hewlett-Packard Gains Control of Inventory and Services Through Design for Localization." Interfaces 23(4): 1-11.
9
Copyright © 1997 by ASME