Also, the same was reported by the T. Letcher [3], that with · the use of S2027, there is an increase in overall energy · production by 16%. 3.2 Power Calculation ...
Published by : http://www.ijert.org
International Journal of Engineering Research & Technology (IJERT) ISSN: 2278-0181 Vol. 7 Issue 01, January-2018
Designing of Vertical Axis Wind Turbines for Low Speed, Low Altitude Regions of Central India Sonali Mitra
Abhineet Singh
Graduate Engineer Trainee EM Services (I) Pvt. Ltd
Department of Materials Imperial College London
Pragyan Jain Department of Mechanical Engineering Gyan Ganga Institute of Technology and Sciences
S.V. H. Nagendra Department of Mechanical Engineering Gyan Ganga Institute of Technology and Sciences
Abstract – A Straight Blade type, Vertical Axis Wind Turbine was designed having an output of 2.5 kW for the installation in the college campus of Gyan Ganga Institute of Technology and Sciences, Jabalpur. Advance methods of additive manufacture technology like Fused Deposition Modelling type 3D Printing is used for making a model and experiment is conducted. Keywords – VAWT, 3D Printing, Airfoil S2027, CFD, Drag Force.
1. INTRODUCTION In an era, where energy is a strategic need for development and growth, energy supply is running behind energy demand. In order to make sure there is substantial development, we must consider all possible sources to fulfil our energy requirement, especially now, when we are running short on our major source of energy, i.e. fossil fuels (coal, petroleum etc.). Fossil fuels have been the main source for energy production for decades, and they are now depleting. Also, they are a major cause of pollution, which gives rise to problems like global warming. Thus, to maintain the economic growth and to save the planet at the same time, no options seems more favourable than renewable energy sources like solar, wind etc. Renewable sources not only provide energy which has negligible to zero carbon emission, but is in abundance, with a promise of never ending. Amongst the many source of energy, wind energy seems to be a promise-able source as its non - polluting and a continuous source of energy. Wind Energy seems to a favourable option that can be considered as there is a continuous flow of wind throughout the year and round the clock. In any wind power system, the main efficiency of the system depends up to the design of the blade which mainly depends on the factors like Airfoil Shape, Wind Speed, Blade Dimensions, Blade Material etc. All the three profiles are selected for the further development of a Vertical Axis Wind Turbine.
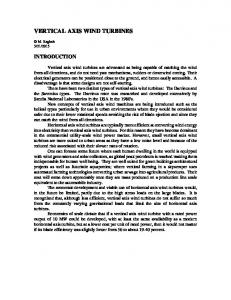
Figure 1. -1- Vertical Axis Wind Turbine`s Rotor
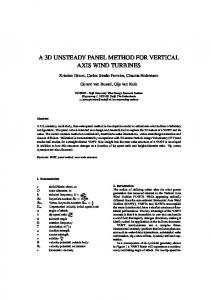
2. SITE SELECTION The work for site selection was done by the Pragyan Jain et al [1]. Selection of site was done using CFD Simulation on ANSYS Fluent, where the Bluff Body of the Gyan Ganga Institute of Technology and Sciences, Jabalpur, was made with the help of Google Earth and CAD Modelling. The results so obtained were taken as the base for designing the VAWT system where average wind speed, was approximately 1 m/s or 3.6 km/hr. Also, the data given by Metrological Department also states that average wind speed in Jabalpur regions is around 0.972 m/s or 3.5 km/hr.
Figure 2.1- Wind Patterns by Google Earth
The most potential zone found for VAWT`s installation was between the two-college building of Gyan Ganga Institute of Technology and Sciences and Gyan Ganga College of
IJERTV7IS010116
www.ijert.org (This work is licensed under a Creative Commons Attribution 4.0 International License.)
218
Published by : http://www.ijert.org
International Journal of Engineering Research & Technology (IJERT) ISSN: 2278-0181 Vol. 7 Issue 01, January-2018
Technology, roughly at a height between 20 – 100 feet from ground level [1].
3.4 Force Calculation – Drag Force is calculated using the following [3] formula. 𝐹𝐷 =
𝜌 𝐴 𝑣02 𝐶𝐷 2
Torque provided by one single blade of VAWT [3] is given by 𝑇 = 𝐹𝐷 x R Total torque by VAWT is given by 𝑇𝑇𝑜𝑡𝑎𝑙 = 𝑁𝑏 x T 3.5 Calculation for Selection of Generator – For selecting an effective generator, rotor speed and number of poles of generator is an important parameter, which can be calculated from the following formulas, respectively. Figure 2.2 - Location and Coordinates of GGITS
P=
2πNT 60
3. CALCULATIONS FOR DESIGNING – Following are the steps taken to design the VAWT.
and
3.1 Airfoil Selection – Experiment was conducted on Sub Sonic Wind Tunnel setup using three airfoil profiles, namely NACA 0012, NACA 0015 and S2027. The results were then verified using CFD simulation using ANSYS CFX and hence, it was concluded that S2027 has higher capability of generating Drag Force [2]. Also, the same was reported by the T. Letcher [3], that with the use of S2027, there is an increase in overall energy production by 16%.
where ‘f’ in India is 50 Hz.
3.2 Power Calculation – The designing of VAWT was done with an expectation of 2.5 kW power output. The following formula [4] was used for calculating the area of blade keeping the known quantities in consideration. 1
P = √ ρ A v03 Cp 2
3.3 Calculation for Dimensions – With the use of Aspect Ratio (AR) [4], it was easy to calculate the dimensions of the blade of the VAWT. AR =
ℎ 𝑅
With the use of Solidity [4], the number of blades was calculated. σ=
IJERTV7IS010116
P* =
120 f N
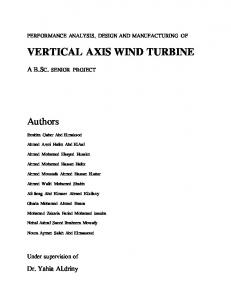
3.6 Results of above calculations The following results were obtained from the calculations- 2.5 m 𝐻𝑏𝑙𝑎𝑑𝑒 - 0.5 m 𝐿𝑐ℎ𝑜𝑟𝑑 - 0.0723771 m 𝑇𝑏𝑙𝑎𝑑𝑒 Assuming the following values for further calculations- 4.0 m/s 𝑉0 - 1 𝐶𝐷 - 2.3 m 𝑅𝑟𝑜𝑡𝑜𝑟 Other useful results from the calculation are as follows. - 11.700 N 𝐹𝐷 Nm 𝑇 1𝑏𝑙𝑎𝑑𝑒 - 27.071 Nm 𝑇5 𝑏𝑙𝑎𝑑𝑒 - 135.355 N - 176.464 rpm P - 34.001176 Poles 4. COMPUTER AIDED DESIGNING 4.1 CAD Modelling Complete CAD modelling, simulation and rendering of the VAWT was done using Autodesk`s Fusion 360. Figure 5-1 shows complete assembly of Final CAD model of the VAWT, while Figure 6-1 and 6-2 shows the CAD model`s exploded view of both the rotor and stator respectively.
𝑁𝑏 𝑐 𝑅
www.ijert.org (This work is licensed under a Creative Commons Attribution 4.0 International License.)
219
Published by : http://www.ijert.org
International Journal of Engineering Research & Technology (IJERT) ISSN: 2278-0181 Vol. 7 Issue 01, January-2018
Figure 4.1 CAD Model of VAWT
4.2 STL File Generation and 3D Printing CAD files of the selective parts which were to be 3D printed were saved as STL files and were opened on the CURA, slicing software where final G-Code was written which was later fed to the 3D Printer. Layer height was maintained as 0.2 mm for all 3D Printed parts and all the parts were printed at nozzle temperature of 210 ℃, without the bed heating. 3D Printing was done on Prusa i3 3D Printer using FDM process with Poly-Lactic-Acid (PLA) as the printing material having 1.75 mm diameter. Blades were printed with a wall thickness of 2 mm and had 75% infill, which enabled us to gain strength and reduce weight at the same time. Figure 5-2 shows the sliced CAD model of blade in CURA.
Figure 4.3- Blade being printed on Prusa i3
5. MODEL MANUFACTURING Following steps were taken in the manufacturing process.
Figure 4.2- STL File Slicing in CURA
Figure 4.4 - Final Model
IJERTV7IS010116
www.ijert.org (This work is licensed under a Creative Commons Attribution 4.0 International License.)
220
Published by : http://www.ijert.org
International Journal of Engineering Research & Technology (IJERT) ISSN: 2278-0181 Vol. 7 Issue 01, January-2018
Wooden base, having a Mild Steel frame was made for holding both the Rotor, Generator and other electronics. The rotor rested on a JP 51100 Thrust Bearing. Upper end of the rotor was held by a NBC 6000Z Deep Groove type Ball Bearing and the bottom end was coupled to a DC Motor via Flange Coupling. A DC Motor (12 V) having 1000 RPM was geared down to 200 RPM and was further used as a Generator.
Figure 4.5 - Final Model
5.1 Rotor Manufacturing Total of 5 blades having S2027 profile were 3D Printed. Two hubs having top and bottom airfoil holders having a freedom of 360˚ such that Angle of Attack can be changed. A Nut and Bolt system was provided for the same. Provision for Aluminium Flange Coupling was also made within the hub such that the Stainless Steel, Solid Shaft having a 10 mm diameter can be easily held inside it.
Figure 5.2 - Exploded CAD View of Stator
6. TESTING AND RESULTS The model of the VAWT was tested in a frugal setup, in which an Air Blower was used as Wind source. The air blower had a rated discharge of 3.3 m3/min. The air blower was kept at a distance of 1 foot (304.88 mm) from the tip of the blade. Variations in blower speeds were changed using the blower pre-sets. The outlet of the air blower was positioned in such a way that it came approximately in the centre of the blades. Vibration damping was done using a dead weight (Brick) for the model. A hand held digital Tachometer was used to find the rotor speed at various wind speeds. A digital Multi-Meter was clipped on both the terminals of the Generator. In case of No-Load Condition, Voltage was taken whereas when an LED was connected, both Current and Voltage was measured. Resistance across the LED was taken using a multi-meter. Figure 5.1- Exploded CAD View of Rotor
5.2 Stator Manufacturing
IJERTV7IS010116
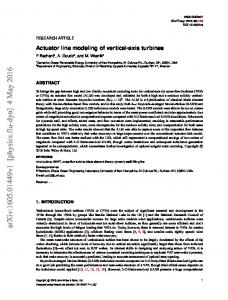
6.1 No Load Condition – Following Table 1 shows the results obtained in No Load condition.
www.ijert.org (This work is licensed under a Creative Commons Attribution 4.0 International License.)
221
Published by : http://www.ijert.org
International Journal of Engineering Research & Technology (IJERT) ISSN: 2278-0181 Vol. 7 Issue 01, January-2018 Rotor Speed (RPM) Vs Voltage (Volts) 7.00
5.76
6.00
4.75
5.00
3.74
4.00 3.00
4.39
1.8
2.79
2.00 1.00
0.79
0.00 0
200
400
600
Rotor Speed (RPM)
Graph 3 - Rotor Speed vs Voltage
Figure 6.1- Testing with No Load No Load Condition Speed Setting
Wind Speed (m/s)
1 2 3 4 5 6 7
Rotor Speed (RPM)
Voltage (V)
6.89 57.00 13.78 77.00 20.68 198.00 27.57 218.00 34.46 340.00 41.35 419.00 48.24 478.00 Table 1- Readings in No Load Condition
0.79 1.8 2.79 3.74 4.39 4.75 5.76
6.2 Loaded Condition – We know that P = V I cos Φ Since its DC Current cos Φ = 1.00 Resistance across LED`s = 4.00 Ω Thus, we can calculate the current flowing through the load (LED).
Wind Speed (m/s) Vs Rotor Speed (RPM) 600
478
500
419 340
400 300
198 218
200 57
100
77
0 0
20
40
60
Wind Speed (m/s) Figure 6.2 - Testing with Load Graph 2- Wind Speed vs Rotor Speed Loaded Condition Speed Setting
1 2 3 4 5 6 7
IJERTV7IS010116
Wind Speed (m/s)
Rotor Speed
Voltage
Current
(RPM)
(V)
(A)
(W)
6.89 57.00 1.26 0.32 13.78 124.00 1.84 0.46 20.68 145.00 1.99 0.50 27.57 252.00 2.2 0.55 34.46 276.00 2.32 0.58 41.35 279.00 2.45 0.61 48.24 313.00 2.64 0.66 Table 2- Readings in Loaded Condition
0.40 0.85 0.99 1.21 1.35 1.50 1.74
www.ijert.org (This work is licensed under a Creative Commons Attribution 4.0 International License.)
Power
222
Published by : http://www.ijert.org
International Journal of Engineering Research & Technology (IJERT) ISSN: 2278-0181 Vol. 7 Issue 01, January-2018
Wind Speed (m/s) Vs Rotor Speed (RPM) 350
8. FUTURE SCOPE A full scale Straight Blade type, Vertical Axis Wind Turbine designed for 2.5 kW can be installed in the college premises. Its application would become a stepping stone in promotion of Green Energy, which shall benefit both the environment and institute for coming future.
313
300
252
276 279
250 200 124
150 100
145
List of Symbols
57
50
A
=
Cross Sectional Area swept by Wind
c
=
Chord Length
𝐶𝐷
=
Coefficient of Drag
𝐶𝐿
=
Coefficient of Lift
𝐶𝑃
=
Coefficient of Power
𝐶𝑃 𝑚𝑎𝑥
=
Maximum Cp
f
=
Frequency of Current
N
=
Rotor RPM
𝑁𝑏
=
Number of Blades
P
=
Power Produced (Output)
1.00
P*
=
Number of Poles in Generator
0.50
R
=
Radius of Rotor
Re
=
Reynold`s Number
𝑉0
=
Velocity of Air
𝛼 𝛼
=
Angle of Attack
𝜆𝑐𝑝 𝑚𝑎𝑥
=
λ that maximises Cp
𝜌
=
Density
σ
=
Solidity
𝜎𝑐𝑝 𝑚𝑎𝑥
=
σ that maximises Cp
0 0
20 40 Wind Speed m/s
60
Graph 3 – Wind Speed vs Rotor Speed
Rotor Speed (RPM) Vs Voltage (Volts) 3.00 2.50
2.2
1.99 1.84
2.00
2.64 2.45 2.32
1.26
1.50
0.00 0
100
200 300 Rotor Speed (RPM)
400
Graph 4- Rotor Speed vs Voltage
Wind Speed (m/s) Vs Power (Watt) 2.00
1.74
1.50
1.21 0.85
1.00
0.99
REFERENCES [1]
0.40
0.50 0.00
1.35
1.50
0
10
20
30
40
50
60
Wind Speed (m/s) Graph 5 - Wind Speed vs Power
7. CONCLUSIONS As per the theoretical design and experiment performed on the scaled down model, a Straight Blade Type, Vertical Axis Wind Turbine having an airfoil shape of S2027, will be proved useful in the Central India region, averagely having Low Wind Speed.
IJERTV7IS010116
Jain Pragyan, Malvika Pateria. Optimization And Site Selection For Installation Of Low Speed Wind Turbine In Central India. International Journal Of Innovation In Engineering Research & Management. ISSN: 2348-4918. [2] Singh Abhineet, Mitra Sonali, Nagendra S.V.H And Jain Pragyan. Selection Of Airfoils For Vertical Axis Wind Turbines For Low Speed, Low Altitude Regions Of Central India. International Journals Of Advanced Research In Computer Science And Software Engineering. ISSN: 2277-128X (Volume-7, Issue-11). [3] T. Letcher. Small Scale Wind Turbine Optimization For Low Wind Speeds. The Ohio State University, Columbus, Ohio. [4] S. Brusca , R. Lanzafame And M. Messina. Design Of Vertical Axis Wind Turbine – How The Aspect Ratio Affects The Turbine`S
Performance. International Journal Of Energy Environment Engineering (2014) 5:333–340
www.ijert.org (This work is licensed under a Creative Commons Attribution 4.0 International License.)
223