JOURNAL OF CLINICAL MICROBIOLOGY, Aug. 2001, p. 2835–2845 0095-1137/01/$04.00⫹0 DOI: 10.1128/JCM.39.8.2835–2845.2001 Copyright © 2001, American Society for Microbiology. All Rights Reserved.
Vol. 39, No. 8
Detection and Quantification of Infectious Hypodermal and Hematopoietic Necrosis Virus and White Spot Virus in Shrimp Using Real-Time Quantitative PCR and SYBR Green Chemistry ARUN K. DHAR, MICHELLE M. ROUX,
AND
KURT R. KLIMPEL*
Super Shrimp, Inc., National City, California, California 91950 Received 14 December 2000/Returned for modification 10 May 2001/Accepted 26 May 2001
A rapid and highly sensitive real-time PCR detection and quantification method for infectious hypodermal and hematopoietic necrosis virus (IHHNV), a single-stranded DNA virus, and white spot virus (WSV), a double-stranded DNA (dsDNA) virus infecting penaeid shrimp (Penaeus sp.), was developed using the GeneAmp 5700 sequence detection system coupled with SYBR Green chemistry. The PCR mixture contains a fluorescence dye, SYBR Green, which upon binding to dsDNA exhibits fluorescence enhancement. The enhancement of fluorescence was proportional to the initial concentration of the template DNA. A linear relationship was observed between the amount of input plasmid DNA and cycle threshold (CT) values over a range of 1 to 105 copies of the viral genome. To control the variation in sampling and processing among samples, the shrimp -actin gene was amplified in parallel with the viral DNA. The CT values of IHHNV- and WSV-infected samples were used to determine absolute viral copy numbers from the standard CT curves of these viruses. For each virus and its -actin control, the specificity of amplification was monitored by using the dissociation curve of the amplified product. Using genomic DNA as a template, SYBR Green PCR was found to be 100- to 2000-fold more sensitive than conventional PCR, depending on the virus, for the samples tested. The results demonstrate that SYBR Green PCR can be used as a rapid and highly sensitive detection and quantification method for shrimp viruses and that it is amenable to high-throughout assay. Soc. Meet., abstr. 116, 1998). By histology, in situ hybridization using an IHHNV-specific probe, and PCR, Super Shrimp P. stylirostris postlarvae and juveniles have been shown to be resistant to IHHNV (26). The virions of IHHNV are nonenveloped icosahedrons (22 nm in diameter) and contain a single-stranded linear DNA of 4.1 kb (2). We have recently sequenced the IHHNV genome. The genome organization revealed that IHHNV belongs to the family Parvoviridae and is closely related to mosquito brevidensoviruses (24). WSV is currently the most devastating viral pathogen threatening the shrimp farming industry worldwide. WSV is also known as baculoviral hypodermal and hematopoietic necrosis virus (J. Huang, X. L. Song, J. Yu, and C. H. Yang, Yellow Sea Fishery Res. Inst., abstr. 9, 1994), a rod-shaped virus of P. japonicus (10), penaeid acute viremia (25), systemic ectodermal and mesodermal baculovirus (31), P. monodon nonoccluded baculovirus (32), white spot syndrome baculovirus (18), Chinese baculovirus (19), and white spot syndrome virus (15). To avoid confusion, we used the name WSV as suggested by Cesar et al. (3). WSV was first reported in eastern Asia during 1992 to 1993 (10; Huang et al., Yellow Sea Fishery Res. Inst.). The virus rapidly spread throughout shrimp farming regions of Southeast Asia and North America in the mid-1990s (6, 11). During 1999 WSV severely impacted the shrimp industries of both Central and South America. WSV-infected shrimp become lethargic, show reduction in food consumption, lose cuticles, and often exhibit white spots under their exoskeletons, hence the name of the disease white spot syndrome. The virus has a wide host range among crustaceans, infecting about 40 different species (6). The virions are enveloped nucleocapsids,
Viral diseases are a major problem in the shrimp aquaculture industry worldwide. Serious viral outbreaks often cause catastrophic losses in shrimp farming around the globe (16). Infectious hypodermal and hematopoietic necrosis virus (IHHNV) and white spot virus (WSV) are the two most important DNA viruses infecting penaeid shrimp in the Western Hemisphere (16). Natural infection by IHHNV has been reported for most shrimp (Penaeus sp.) species (16). In the Americas, the two most commercially important species of shrimp are P. stylirostris and P. vannamei. P. stylirostris is highly susceptible to IHHNV, and the virus causes lethal disease (up to 90% mortality) in P. stylirostris juveniles (16). However, the virus does not cause lethal infection in P. vannamei; instead, it causes reduction in growth and a variety of cuticular deformities of the rostrum, antenna, and other thoracic and abdominal areas, deformities that together are commonly known as runt deformity syndrome (12). Losses of revenue due to runt deformity syndrome range from 10 to 50% depending on the level of infection. In an effort to develop virus-resistant lines of shrimp, Super Shrimp, Inc., has developed a line of P. stylirostris shrimp that is resistant to IHHNV. The population originated as wild larvae from Panama, survived an IHHNV epidemic, and has undergone more than 20 generations of captive breeding. This line of shrimp shows greater than 80% survival in an IHHNVpositive grow-out system (H. Clifford, Abstr. World Aquac.
* Corresponding author. Mailing address: Super Shrimp, Inc., 1545 Tidelands Ave., Suite J, National City, CA 91950. Phone: (619) 4775394. Fax: (619) 477-5396. E-mail:
[email protected]. 2835
2836
DHAR ET AL.
J. CLIN. MICROBIOL.
TABLE 1. Details of the primers used for the amplification of IHHNV, WSV, and the -actin gene of shrimp by conventional PCR Virus
Primer name
Primer sequence (5⬘-3⬘)
% GC
Tm (°C)a
IHHNV
1641F 1148R IHHN-aFor 607R
AGAACAATGATCCGGTCACAAGTCA AACACGCCGAAGGATCAA GTACATGGTGCGTGA AGCCTATACAATCCATGGTGACACT
44 50 53 44
63 56 37 51
1,368
24
329
24
WSV
F002 R002
GATGAGACAGCCCAAGTTGTTAAAC CGAAATTCCATCACTGTAATTGCTTG
44 38
51 50
306
13
-Actin
Actin-F Actin-R3
CCCAGAGCAAGAGAGGTA GCGTATCCTTCGTAGATGGG
55 55
45 49
339
4, 7, 21
a
Size (bp)
Reference
Tm at 50 mM Na⫹.
bacilliform, and ⬃275 by 120 nm in size and have a tail-like projection at one end of the particle (5, 31). The viral genome contains double-stranded DNA (dsDNA) of 305 kb (1). Based on the morphology of the virus particles and the histopathology of infected tissue, WSV was initially thought to be a member of the family Baculoviridae (5). However, DNA sequence data of two major structural proteins (VP 26 and VP 28) showed no homology to baculovirus structural proteins (27) and a phylogenetic study based on ribonucleotide reductase genes revealed that WSV does not share a common ancestor with baculoviruses (28). Therefore, it has been proposed that WSV may be a representative of a new virus family, Whispoviridae (27, 28). Diagnosis of IHHNV and WSV was done by bioassay using indicator hosts, monitoring clinical signs, histopathology, dot blot and in situ hybridizations using a virus-specific gene probe, and PCR (15). Although conventional PCR is the most sensitive of these methods, it is unable to detect the presence of a single copy of a viral genome in the infected tissue. This ability is critical for the development of a specific-pathogen-free shrimp-breeding program, for the screening of broodstock held in quarantine facilities, and for the detection of viral pathogens in commodity shrimp imported into or exported from the United States. In addition, due to the lack of a continuous cell culture system for penaeid shrimp, quantification of viruses infecting shrimp has been severely hampered. To overcome these problems, we have developed a rapid and highly sensitive real-time quantitative PCR method using SYBR Green as a fluorescence dye (SYBR Green PCR) and the GeneAmp 5700 sequence detection system. SYBR Green is a minor-groove DNA binding dye with a high affinity for dsDNA and exhibits enhanced fluorescence upon binding to a dsDNA (30). The SYBR Green dye is excited at a 485-nm wavelength, and the emission is measured at a 520-nm wavelength. In the GeneAmp 5700 sequence detection system, the fluorescence of the SYBR Green dye is monitored at the end of each PCR cycle, thus allowing the detection of the product during the linear range of amplification. The increase of fluorescence above background is dependent on the initial template concentration (GeneAmp 5700 sequence detection system user manual, PE Applied Biosystems). The specificity of the amplified product is monitored by its melting curve. Since the melting curve of a product is dependent upon its GC content, length, and sequence composition, specific amplification can be distinguished from nonspe-
cific amplification by examining the melting curve (22). The protocol described here does not need gel electrophoresis or any other post-PCR manipulation for sample analysis, which reduces the assay time and significantly eliminates PCR carryover contamination problems. The objectives of the present study were (i) to determine the sensitivity and the specificity of SYBR Green PCR using the GeneAmp 5700 sequence detection system, (ii) to compare the sensitivity of SYBR Green PCR coupled with the GeneAmp 5700 sequence detection system to that of conventional PCR, and (iii) to determine the viral load in laboratory-challenged IHHNV- and WSV-infected shrimp (P. stylirostris) by SYBR Green PCR. MATERIALS AND METHODS Maintenance of animals and virus challenge work. Stocks of pathogen-free juvenile P. stylirostris (1 g) from Super Shrimp, Inc., maintained in our laboratory were used for this study. Animals were kept indoors within environmentally controlled tanks and reared on a commercially available feed formulation (MADMAC-MS Dry pellet; Aquafauna Bio-Marine, Inc., Hawthorne, Calif.). IHHNV and WSV inocula were prepared by homogenizing frozen infected tissue in 2% saline (1:10, wt/vol), centrifuging the homogenate in a tabletop centrifuge (Beckman Microfuge Lite model) at 12,000 rpm for 5 min, and filtering the supernatant through a 0.45-m-pore-size filter. Healthy animals were injected with a viral inoculum (30 l ⬇ 106 copies) between the second and third tergal plates of the lateral side of the tail using a 1-ml tuberculin syringe. Control group animals were injected with a tissue homogenate from PCR-confirmed virusnegative healthy shrimp. The negative control homogenate was prepared using the same protocol. Isolation of nucleic acids. Virus-challenged as well as mock-injected animals were sacrificed for extraction of DNA at 40 h postinjection (p.i.) for WSV and 10 days p.i. for IHHNV. The sampling time was based on the observation that, in Super Shrimp P. stylirostris stocks, a high viral titer is obtained at 40 h p.i. for WSV and at 10 days p.i. for IHHNV (K. R. Klimpel, unpublished data). Super Shrimp P. stylirostris has been shown to be resistant to IHHNV infection (26). For the extraction of DNA, hepatopancreas tissues (50 mg) were taken from virus-injected as well as control animals. Genomic DNA was extracted using DNAZol and by following the protocol of the manufacturer (Molecular Research Center, Inc., Cincinnati, Ohio). The DNA pellets were dissolved in DNase and RNase-free distilled water. The DNA yield was quantified using a spectrophotometer (Shimadzu UV-1201), and the quality was assessed by running the samples in a 1% agarose gel using TAE buffer (40 mM Tris, 20 mM acetic acid, 1 mM sodium EDTA). Cloning and sequencing of IHHNV and WSV DNAs. A 1,368-bp IHHNV DNA was amplified by inverse PCR using the primers 1641F and 1148R (Table 1) and by following the protocol described elsewhere (24). A 306-bp WSV DNA fragment was amplified using the primers F002 and R002 (Table 1). The reaction mixture for WSV amplification contained 100 ng of DNA, 1⫻ PCR buffer (Sigma, St. Louis, Mo.), a 1.25 M concentration of each forward and reverse primer, 0.2 mM deoxynucleoside triphosphate, and 0.6 U of RED Taq DNA polymerase (Sigma) in a 25-l reaction volume. The temperature profile for the
VOL. 39, 2001
SYBR GREEN PCR FOR DETECTION OF SHRIMP VIRUSES
2837
TABLE 2. List of primers used for the detection of IHHNV, WSV, and the -actin gene of shrimp by SYBR Green PCR Primer name
Virus or gene
SYBR Green primer sequence (5⬘-3⬘)
% GC
Tm a
Amplicon size (bp)
IHHNV
313F 363F
Forward: AGGAGACAACCGACGACATCA Reverse: CGATTTCCATTGCTTCCATGA
52 42
49 45
50
WSV
101-110F 101-165R
Forward: GATAAGAGAGGTAGACACTAGTAGTGTTATTGCT Reverse: CCACTGTGCCAGCTATTGCA
38 55
56 49
55
-Actin gene
178F 228R
Forward: GGTCGGTATGGGTCAGAAGGA Reverse: TTGCTTTGGGCCTCATCAC
57 52
51 46
50
a
Tm at 50 mM Na⫹.
PCR amplification was 94°C for 2 min followed by 35 cycles of 94°C for 1 min, 55°C for 2 min, and 72°C for 1 min, with an extension at 72°C for 7 min. The IHHNV and WSV amplified DNAs were cloned into a TOPO cloning vector (Invitrogen, Carlsbad, Calif.). The recombinant plasmid DNA was sequenced in an automated DNA sequencer (model ABI 373A; PE Applied Biosystems). Sequence analyses were performed using the National Center for Biotechnology Information BLAST search program (http://www.ncbi.nlm.nih.gov/gorf/gorf .html). PCR conditions. To compare the detection limit of conventional PCR to that of SYBR Green PCR using plasmid DNAs as well as genomic DNAs from IHHNV- and WSV-challenged P. stylirostris samples, 329-bp (for IHHNV) and 306-bp (for WSV) amplicons were amplified by conventional PCR. For genomic DNAs of IHHNV- and WSV-challenged animals and their corresponding healthy control animals, a 339-bp -actin DNA was amplified in parallel. All the PCR primers were designed using Primer Express Software version 1.0 (PE Applied Biosystems) and are listed in Table 1. The primers for -actin were designed based on the conserved sequences of the Drosophila melanogaster, sea urchin, and insect -actin genes (4, 7, 21). The reaction mixture for IHHNV, WSV, and -actin amplifications contained 1⫻ PCR buffer (PE Applied Biosystems), 2 mM MgCl2, a 0.8 M concentration of each forward and reverse primer, 0.4 mM deoxynucleoside triphosphate, and 2.5 U of AmpliTaq Gold (PE Applied Biosystems). The amount of template DNA per reaction varied depending on the objective of the experiment (see Fig. 2 and 6). The amplifications were carried out in a thermocycler (GeneAmp 9700; PE Applied Biosystems) with the following thermal profile: 95°C for 10 min followed by 40 cycles of 95°C for 45 s, 55°C for 1 min, and 72°C for 2 min. The amplified DNAs were run in a 2% agarose gel using TAE buffer. The gel was stained with ethidium bromide and photographed. SYBR Green PCR. The primers used for SYBR Green PCR are listed in Table 2. The primers were designed based on the sequences of 1,368- and 306-bp cloned segments of the IHHNV and WSV genomes, respectively. The primers for -actin were designed based on a shrimp (P. monodon) -actin sequence available in the GenBank database (accession number AF100987). The primers were first designed using Primer Express Software version 1.0 (PE Applied Biosystems). All primers were checked by running a virtual PCR, and the amplifications were analyzed for expected product, mispairing, and primer dimer formation using a computer program (Amplify version 1.2B; William Engles, Department of Genetics, University of Wisconsin). The best primer set was taken for the detection and quantification of IHHNV and WSV. SYBR Green PCR amplifications were performed in a GeneAmp 9600 thermocycler coupled with a GeneAmp 5700 sequence detection system (PE Applied Biosystems). The reactions were carried out in a 96-well plate in a 25-l reaction volume containing 7.1 l of 2⫻ SYBR Green Master Mix (PE Applied Biosystems), a 0.24 M concentration of each forward and reverse primer, and 1 ng of total cellular DNA. For determining the IHHNV and WSV detection limits, the amounts of DNA used per SYBR Green PCR varied from 1.0 ng to 10 pg and from 1.0 ng to 0.1 pg, respectively. The thermal profile for all SYBR Green PCRs was 50°C for 2 min and 95°C for 10 min, followed by 40 cycles of 95°C for 10 s and 60°C for 1 min. In each 96-well plate, a dilution series of the plasmid standard for the respective virus was run along with the unknown samples for the corresponding virus and their -actin controls. Each sample was replicated two to three times. All reactions were repeated at least three times independently to ensure the reproducibility of the results. Plasmid standard for quantification by SYBR Green PCR. The plasmid DNAs of 1,368-bp IHHNV and 306-bp WSV clones were linearized by EcoRI and HindIII (Promega, Madison, Wis.) digestions, respectively. Aliquots of the digested plasmids were run in a 1% agarose gel for checking the digestion before
purification of the remaining digestion reaction mixtures with a Qiaquick gel purification kit (Qiagen, Valencia, Calif.). DNA was quantified using a spectrophotometer (Shimadzu UV-1201), and dilutions were made using sheared salmon sperm DNA (5 ng/ml) as a diluent. Data analyses. After SYBR Green PCR amplification, data acquisition and subsequent data analyses were performed using the GeneAmp 5700 sequence detection system (version 1.3). In the SYBR Green Master Mix, there is an internal passive dye, ROX, in addition to the SYBR Green dye. The increase in the fluorescence of SYBR Green against that of ROX is measured at the end of each cycle. A sample is considered positive when the change in the fluorescence of SYBR Green relative to that of ROX (⌬Rn) exceeds an arbitrary threshold value. The threshold value is set at the midpoint of the ⌬Rn and the cycle number plot. For all the amplifications described in this paper, the threshold value of the ⌬Rn was considered to be 0.25. The PCR cycle at which a statistically significant increase in the ⌬Rn is first detected is called the threshold cycle (CT). Target DNA copy number and CT values are inversely related. For example, a sample containing a high number of copies of the target DNA will cross the threshold at an earlier cycle than sample with a lower number of copies of the same target. The absolute levels of IHHNV and WSV in the experimental samples were determined by extrapolating the CT values from the standard curves of the viruses. For data analyses, the CT values were exported into a Microsoft Excel Worksheet for further statistical analyses. Regression analyses of the CT values of genomic DNA dilution series were used to determine the amplification efficiencies of IHHNV and WSV compared to those of their -actin genes.
RESULTS Sequence analyses of IHHNV and WSV DNAs. The nucleotide sequence of the 1,368-bp IHHNV DNA clone showed that it encompassed parts of the left and right open reading frames (ORFs) of the viral genome (GenBank accession number AF273215). In the IHHNV genome, the left ORF encodes nonstructural protein NS1 and the right ORF encodes viral capsid protein (24). The nucleotide sequence of the 306-bp WSV clone contained one additional A at nucleotide position 120 in the sequence compared to the GenBank entry (accession number WSU 89843 [13]). Analytical sensitivity of SYBR Green PCR versus conventional PCR using plasmid DNA as the template. To determine the analytical sensitivity of SYBR Green PCR, serial dilutions of IHHNV and WSV plasmid standards were made using sheared salmon sperm DNA as the carrier. A linear relationship was observed between the input copy number of the virus template and the CT values for the virus-specific product over 5 log10 dilutions, ranging from 1.88 ⫻ 105 copies (CT ⫽ 22.2 ⫾ 0.725) to 1.18 copies (CT ⫽ 39.751 ⫾ 0.424) for IHHNV and 2.37 ⫻ 105 copies (CT ⫽ 21.278 ⫾ 0.037) to 1.48 copies (CT ⫽ 38.981 ⫾ 0.528) for WSV (Fig. 1A and B; Table 3). Negative controls did not provide any amplification for either virus. The IHHNV and WSV plasmid standard dilutions, as used
2838
DHAR ET AL.
J. CLIN. MICROBIOL.
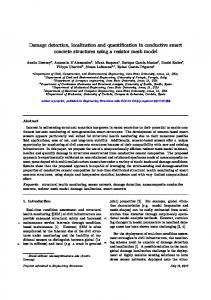
FIG. 1. Linear relationship between CT values and the dilutions of the plasmid DNAs of IHHNV (A) and WSV (B) samples. The exact numbers of copies of the IHHNV plasmid added to each reaction mixture (corresponding to the numbers on the linear curve) were as follows: 1.88 ⫻ 105 (1), 1.88 ⫻ 104 (2), 1.88 ⫻ 103 (3), 1.88 ⫻ 102 (4), 1.88 ⫻ 101 (5), 9.4 (6), 4.7 (7), 2.35 (8), and 1.18 (9). For WSV samples, the plasmid copy numbers were 2.37 ⫻ 105 (1), 2.37 ⫻ 104 (2), 2.37 ⫻ 103 (3), 2.37 ⫻ 102 (4), 2.37 ⫻ 101 (5), 11.85 (6), 5.93 (7), 2.96 (8), and 1.48 (9). The amplifications of IHHNV and WSV DNAs from the same plasmid dilutions by conventional PCR are shown in panels C and D, respectively. The lane numbers refer to the plasmid copy numbers mentioned above. Lane M, 50-bp DNA step ladder (Sigma); lane ⫺ve, negative control.
for SYBR Green PCR, were also tested by conventional PCR using virus-specific primers (Table 1). A 329-bp DNA was amplified for the IHHNV, and a 306-bp DNA was amplified for the WSV (Fig. 1C and D). Successful amplifications could be obtained down to 1.88 ⫻ 102 copies for IHHNV and 2.37 ⫻ 101 copies for WSV, as opposed to approximately 1 copy by SYBR Green PCR for both viruses. Detection limits of IHHNV and WSV by conventional PCR using genomic DNA as the template. In order to determine the detection limits of IHHNV and WSV by conventional PCR, dilution series of genomic DNAs were made from laboratorychallenged P. stylirostris samples. For each virus, PCR amplifications were carried out using the virus-specific primers and the -actin primers in parallel. The amplicon sizes for IHHNV, WSV, and -actin were 329, 306, and 339 bp, respectively (Fig. 2). For IHHNV, the detection limit was 100 ng of DNA, whereas for -actin, the detection limit for the same dilution series was 100 pg (Fig. 2A and C). For both WSV and its -actin gene, the detection limit was 10 pg (Fig. 2B and D).
Limits of detection of IHHNV and WSV by SYBR Green PCR using genomic DNAs as templates. The limits of detection for IHHNV and WSV by SYBR Green PCR were determined by using dilution series of total genomic DNAs from laboratory-challenged P. stylirostris samples. The detection limits were 50 pg (average CT ⫽ 37.9) (Fig. 3A) for IHHNV and 0.1 pg (average CT ⫽ 37.02) (Fig. 3B) for WSV. To compare the efficiencies of amplification of IHHNV and WSV with those of their -actin genes, the CT values were plotted against the dilutions of the input genomic DNAs. The slopes of the regression lines for IHHNV and its -actin gene were ⫺1.7307 and ⫺1.6573, respectively (Fig. 3A). The slopes of the regression lines for WSV and its -actin gene were ⫺3.665 and ⫺3.5233, respectively (Fig. 3B). Therefore, the amplification efficiencies of both the viruses and their -actin genes were very similar. Specificity of SYBR Green PCR. The specificities of the products amplified by SYBR Green PCR were monitored by analyzing the amplification profiles and the corresponding dis-
VOL. 39, 2001
SYBR GREEN PCR FOR DETECTION OF SHRIMP VIRUSES
2839
TABLE 3. CT values of replicate assays of dilution series of IHHNV and WSV plasmid standards and genomic DNA of virus-infected P. stylirostris Virus
IHHNV
WSV
a b
No. of copies of plasmid or genomic DNA or -actin control
CT valuesa
Mean
SD
CVb
23.010 25.115 28.625 NT 35.965 36.610 39.620 39.220 39.120
22.200 25.088 29.120 32.718 35.525 36.894 39.346 38.690 39.751
0.725 0.627 1.013 0.268 0.370 0.464 0.593 0.465 0.424
3.27 2.49 3.49 0.82 1.04 1.26 1.51 1.20 1.07
32.335 34.530 33.545 32.600 32.190 33.307 30.730 30.767 31.480 30.745
NT NT NT NT NT NT NT NT NT NT
32.502 34.535 33.742 32.095 33.054 33.899 30.969 31.567 32.061 31.162
0.424 0.258 0.195 0.491 0.761 0.840 0.299 0.702 0.825 0.580
1.31 0.75 0.58 1.53 2.30 2.48 0.97 2.22 2.57 1.86
23.893 26.030 25.477 24.470 26.170 21.690 20.995 22.230 22.895 22.895
24.035 25.580 25.435 24.775 26.045 21.020 20.595 22.070 22.470 22.510
NT NT NT NT NT NT NT NT NT NT
23.832 25.455 25.245 24.623 25.871 21.057 20.541 22.298 22.647 22.538
0.240 0.647 0.366 0.216 0.415 0.616 0.483 0.269 0.221 0.343
1.01 2.54 1.45 0.88 1.60 2.93 2.35 1.21 0.98 1.52
21.260 25.143 28.860 32.863 35.280 36.717 38.057 38.690 39.653
21.287 24.897 28.987 32.787 36.307 36.600 38.053 36.670 38.677
21.327 25.057 28.455 32.247 35.770 37.737 37.837 37.653 38.463
21.240 25.437 29.373 32.570 35.867 37.310 38.270 37.667 39.130
21.278 25.133 28.919 32.617 35.806 37.091 38.054 37.670 38.981
0.037 0.227 0.378 0.276 0.421 0.531 0.177 0.825 0.528
0.17 0.90 1.31 0.85 1.18 1.43 0.47 2.19 1.35
Genomic DNA sample 1 2 3 4 5 6 7 8 9 10
26.023 24.007 23.983 22.867 22.167 25.857 23.960 23.007 25.030 21.723
25.047 24.007 23.770 22.857 22.020 26.223 23.800 22.843 24.760 21.643
25.537 24.227 23.360 23.177 22.267 26.040 23.493 22.837 30.637 21.650
NT NT NT NT NT NT NT NT NT NT
25.536 24.080 23.704 22.967 22.151 26.040 23.751 22.896 26.809 21.672
0.399 0.104 0.259 0.149 0.101 0.150 0.113 0.115 0.191 0.057
1.56 0.43 1.09 0.65 0.46 0.58 0.48 0.50 0.71 0.26
-Actin control 1 2 3 4 5 6 7 8 9 10
23.140 22.983 21.880 23.130 21.023 23.710 18.923 22.403 24.040 22.290
23.207 22.113 22.920 23.227 21.123 23.773 19.270 22.360 24.153 22.223
23.740 22.303 23.190 23.323 21.323 24.030 19.147 22.197 27.763 22.240
NT NT NT NT NT NT NT NT NT NT
23.362 22.467 22.663 23.227 21.157 23.838 19.113 22.320 25.319 22.251
0.047 0.615 0.735 0.068 0.071 0.045 0.245 0.031 0.080 0.047
0.20 2.74 3.24 0.29 0.34 0.19 1.28 0.14 0.32 0.21
Expt 1
Expt 2
Expt 3
Expt 4
Plasmid copy no. 1.88 ⫻ 105 1.88 ⫻ 104 1.88 ⫻ 103 1.88 ⫻ 102 1.88 ⫻ 101 9.4 4.7 2.35 1.18
21.253 24.220 28.443 32.730 35.060 37.307 39.130 38.457 39.883
22.350 25.700 30.625 32.445 35.560 37.270 40.000 38.910 40.000
22.185 25.315 28.785 32.980 35.515 36.390 38.635 38.175 40.000
Genomic DNA sample 1 2 3 4 5 6 7 8 9 10
32.983 34.280 33.935 31.620 33.627 33.530 30.873 31.860 31.697 30.917
32.187 34.795 33.747 32.065 33.345 34.860 31.305 32.075 33.005 31.825
-Actin control 1 2 3 4 5 6 7 8 9 10
23.567 24.755 24.823 NT 25.397 20.460 20.033 22.595 22.575 22.210
Plasmid copy no. 2.37 ⫻ 105 2.37 ⫻ 104 2.37 ⫻ 103 2.37 ⫻ 102 2.37 ⫻ 101 11.85 5.93 2.96 1.48
For each sample, the CT value is the average of results from two to three replicates of the SYBR Green PCR run of that day. NT, not tested. CV, coefficient of variation.
2840
DHAR ET AL.
J. CLIN. MICROBIOL.
FIG. 2. (A and B) Detection limits for IHHNV (A) and WSV (B) DNAs by conventional PCR. The dilutions of genomic DNAs of IHHNVand WSV-infected P. stylirostris samples were amplified using virus-specific primers. (C and D) -Actin DNA was amplified from each sample in parallel. The sizes of the amplicons were 329, 306, and 339 bp for IHHNV, WSV, and the -actin gene, respectively. Lanes 1 to 9 contain 100 ng, 10 ng, 1 ng, 100 pg, 10 pg, 1 pg, 100 fg, 10 fg, and 1 fg, respectively. Lane M, 50-bp DNA step ladder (Sigma); lane ⫺ve, negative control.
sociation curves of each amplicon. Figures 4 and 5 provide examples of amplification profiles and the corresponding dissociation curves of IHHNV, WSV, and -actin control gene products from virus-infected and healthy shrimp. When amplification was performed using IHHNV-specific primers and DNA from an IHHNV-challenged animal, a significant increase in SYBR Green fluorescence was recorded, with a CT value of 34.0 (Fig. 4A). When the same IHHNV-specific primers were used with the DNA from a healthy sample, the increase in SYBR Green fluorescence did not exceed the threshold limit, indicating no IHHNV-specific product (Fig. 4A). This observation was supported by the dissociation curve as shown in Fig. 4B. A dissociation curve with a single peak was obtained for the IHHNV-challenged-shrimp samples (melting temperature [Tm] ⫽ 76.2°C) but not for the healthy-shrimp samples. To rule out the possibility of variation in levels of input DNAs and the presence of an inhibitor(s) in the DNA sample from the healthy animal, -actin amplification was performed with the DNA samples from the healthy as well as the IHHNV-challenged animals in parallel in the same 96-well plate. Both the healthy-animal and the IHHNV-challenged-
animal DNA samples provided amplifications of their -actin genes and dissociation curves with an expected Tm, 80.1°C (Fig. 4C and D). This indicates that the absence of amplification in the healthy sample by IHHNV-specific primers was not due to the presence of any inhibitors in the DNA preparation. Similar observations were recorded for WSV amplification (Fig. 5). The WSV-challenged sample showed a virus-specific product, as exemplified by the amplification profile (CT ⫽ 26) and the corresponding dissociation curve (Tm ⫽ 76.2°C) (Fig. 5A and B). DNA from the healthy sample did not provide any WSV-specific amplification (Fig. 5A and B). However, both the healthy-animal and the WSV-challenged-animal samples provided -actin-specific amplification as shown in Fig. 5C. The dissociation curve (Fig. 5D) revealed that the product had a Tm of 80.3°C, as expected for the -actin amplicon. For every SYBR Green PCR amplification described in this paper, samples were routinely analyzed by their amplification profile and the dissociation curve to ensure the specificity of the intended product. Reproducibility of the SYBR Green PCR assay. The reproducibility of SYBR Green PCR was assessed by running the
VOL. 39, 2001
SYBR GREEN PCR FOR DETECTION OF SHRIMP VIRUSES
2841
the standard curve of the corresponding virus. Among the IHHNV-challenged-animals, the viral load varied between 48 and 339 copies/ng of DNA (CT values varied from 34.54 to 30.97), and among the WSV-challenged-animals, the viral load varied between 8,091 and 272,270 copies/ng of DNA (CT values varied from 26.81 to 21.67). This suggests that there was considerable variation in the virus level within each group. DISCUSSION
FIG. 3. Detection limits of IHHNV (A) and WSV (B) DNAs by SYBR Green PCR. The -actin gene was amplified in parallel for each dilution of the IHHNV and WSV samples. There were three to four replicates for each dilution of DNA, and the CT value of each dilution was used to plot the graph.
samples independently on different days. For each PCR run, samples were replicated two to three times in each 96-well plate. The CT values of the standard plasmid dilutions as well as the genomic DNAs for both the IHHNV- and WSV-challenged-animal samples were highly reproducible, with a coefficient of variation less than 3.5% (Table 3). Specificities of the IHHNV and WSV primers used for conventional PCR. IHHNV and WSV were detected in laboratory-challenged P. stylirostris using 100 ng of DNA with virusspecific primers (Table 1) and by conventional PCR. A 329-bp DNA was amplified for IHHNV, and a 306-bp DNA was amplified for WSV (Fig. 6). A 339-bp -actin DNA was amplified in parallel for all samples. Although in the healthy animals neither virus could be detected using the corresponding virusspecific primers, -actin DNA could be amplified successfully from the healthy-animal DNA samples. This result shows the specificities of the primers used for IHHNV and WSV amplifications. Determining the viral load in laboratory-challenged IHHNVand WSV-infected P. stylirostris by SYBR Green PCR. To measure the IHHNV and WSV loads in laboratory-challenged P. stylirostris, the CT value of each sample was extrapolated into
The management of viral diseases in shrimp aquaculture has been a challenge due to a lack of highly sensitive detection methods. Until very recently, viral detection in shrimp aquaculture was primarily based on biological and histological methods, including in situ hybridization using virus-specific gene probes (15). The detection limits for these methods are low compared to that for PCR, and the process is time-consuming. These challenges have been overcome to some extent over the past few years with the development of screening methods based on conventional PCR technology (15). Both one-step and two-step PCRs have been used with limited success for WSV screening of broodstock animals in quarantine hatchery facilities and of the postlarvae used in stocking ponds (9, 29). Traditional PCR sometimes produces false-negative findings, resulting in a putatively negative animal that served as a reservoir for the virus (9, 29). Use of a virus-resistant line is an important preventive measure for the management of viral diseases in shrimp. A major obstacle in the development of lines resistant to shrimp viruses is the lack of a quantification method for the virus. With no established cell lines for shrimp, quantification of viruses has been very difficult. Assessment of the severity of infection in resistant versus susceptible lines relies on the observation of clinical signs, percent mortality at the end of an experiment, any detectable changes revealed by histology, or detection of the virus by PCR (15). Such methods do not provide a continuous scale of measurement for viral load and are unlikely to reflect the viral quantity accurately. In this paper, we described a detection and quantification method for two shrimp viruses addressing the concerns discussed above. A linear relationship between input DNA and CT values over a range from approximately 105 copies down to the equivalent of a single copy of the viral genome was detected by SYBR Green PCR (Fig. 1). Detection of viruses over such a wide dynamic range is very useful for measuring viral loads in animals with various levels of infection. The detection limits of conventional PCR were 23.7 and 188 copies of the WSV and IHHNV genomes, respectively, using plasmid DNAs as the templates. Lo and Kou (17) reported that 20 copies of the target WSV plasmid DNA could be detected by two-step PCR. Thus, the detection limit of conventional PCR was found to be well below (approximately 20 to 200 times below) that of SYBR Green PCR, which has been shown to routinely detect a single copy of either virus. When dilution series of IHHNV- and WSV-infected genomic DNAs were used for conventional PCR, successful amplification could be obtained with 100 ng of DNA for IHHNV and 10 pg for WSV (Fig. 2). Such a variation in the detection limits between two viruses may be due to the differences in the pathogenesis of the viruses. In addition, Super Shrimp P. sty-
2842
DHAR ET AL.
J. CLIN. MICROBIOL.
FIG. 4. Amplification profiles (A and C) and dissociation curves (B and D) of IHHNV-challenged-and healthy-P. stylirostris samples. Genomic DNAs of IHHNV-challenged- and healthy-P. stylirostris samples were amplified using IHHNV-specific (A) and -actin-specific (C) primers by SYBR Green PCR. The dissociation curves for IHHNV and -actin products are shown in panels B and D, respectively. The Tm values of IHHNV and -actin amplicons are indicated alongside their corresponding dissociation curves.
lirostris stocks are resistant to IHHNV (26) but not to WSV infection. We observed a difference in the limits of detection of -actin in IHHNV- and WSV-infected samples by regular PCR. For IHHNV samples, the detection limit for -actin was 100 pg, whereas for WSV samples, the detection limit for -actin was 10 pg. It is unknown at this time if the lower limit of detection of the -actin gene in the IHHNV samples was due to some PCR inhibitors or because IHHNV infection may reduce the actin level in tissue. The detection limit of SYBR Green PCR using genomic DNA was found to be 50 pg for IHHNV and 0.1 pg for WSV (Fig. 3). Compared to conventional PCR, these values indicate that SYBR Green PCR was 100-fold (10 pg versus 0.1 pg for WSV) to 2,000-fold (50 pg versus 100 ng for IHHNV) more sensitive. With plasmid DNA as the template, SYBR Green PCR was found to be approximately 20-fold (for WSV) to 200-fold (for IHHNV) more sensitive than conventional PCR. Therefore, there is a 5-fold (for IHHNV) to 10-fold (WSV) difference between results with plasmid and genomic DNA templates in a comparison of the sensitivities of conventional and SYBR Green PCRs. This may be due to the nature of the template (plasmid versus genomic DNA) used for the PCR. Spiking the healthy tissue homogenate with a known amount of IHHNV or WSV plasmid DNA and then extracting DNA to
SYBR Green PCR may help to determine the cause of this difference. The high sensitivity of SYBR Green PCR was found to be accompanied by its high specificity as well. Since SYBR Green dye can bind indiscriminately to dsDNA, identification of an intended product was achieved by monitoring its dissociation curve (Fig. 4 and 5). A single dissociation peak with a Tm within a variation of 2°C of the expected temperature suggests an amplification of a specific product (22). This eliminates the need to check the PCR product by gel electrophoresis, thereby significantly reducing the assay time and allowing the screening of a large number of samples in a relatively short time. When IHHNV- and WSV-infected samples along with control samples from healthy animals were tested by SYBR Green PCR using virus-specific primers, a dissociation curve with a single peak at the expected temperature was obtained only with the DNAs isolated from the virus-infected animals and not with the DNAs from healthy control animals (Fig. 4 and 5). When shrimp -actin primers were used, DNAs from both virusinfected and healthy animals provided dissociation curves with a single peak at expected temperatures (Fig. 4 and 5). This result demonstrated the integrity of the DNA used for the amplification as well as the specificities of the virus-specific primers used for SYBR Green PCR. In recent years, a real-
VOL. 39, 2001
SYBR GREEN PCR FOR DETECTION OF SHRIMP VIRUSES
2843
FIG. 5. Amplification profiles (A and C) and corresponding dissociation curves (B and D) for WSV and the -actin gene amplified using genomic DNAs of WSV-challenged- and healthy-P. stylirostris samples. The Tm values of WSV and -actin amplicons are indicated next to the dissociation curve of the corresponding gene product.
time PCR based on TaqMan chemistry has been used for the detection of both plant and animal viruses (14, 20, 23). The high specificity of TaqMan PCR is achieved by a target-specific dually labeled fluorogenic probe that is cleaved during polymerase extension by 5⬘-exonuclease activity (8). Unlike TaqMan PCR, SYBR Green PCR does not need any additional probe since the specificity of the product is monitored by analyzing the dissociation curve of the amplicon. However, in TaqMan PCR multiple targets can be amplified simultaneously using different fluorogenic probes, which is not possible with SYBR Green PCR. Recently, a competitive quantitative PCR has been described for the quantification of WSV (26). The sensitivity of the competitive quantitative PCR was found to be 1.5 times less than that of SYBR Green PCR (see discussion in reference 26). In addition, competitive quantitative PCR is much more time-consuming, more labor-intensive, and less robust than SYBR Green PCR, although SYBR Green PCR is more expensive than competitive quantitative PCR. The IHHNV and WSV viral loads among the samples tested varied considerably. The low levels of IHHNV DNA (48 to 339 copies/ng of shrimp DNA) suggests that the virus replicates at a very low level in Super Shrimp stocks of P. stylirostris. A similar finding was recently reported by Tang et al. (26). However, Super Shrimp stocks of P. stylirostris are highly suscepti-
ble to WSV, as indicated by the high viral loads (8,091 to 272,270 copies/ng of DNA) in the samples tested. The variation in the viral load may be due to the difference in individual host responses to WSV infection. Although a high viral load was detected in the WSV-infected animals, none of the animals showed any clinical sign of WSV infection. This finding suggests that SYBR Green PCR will be useful not only to detect a single copy of the viral genome but also to detect subclinical infection. The high sensitivity of any detection method such as SYBR Green PCR is potentially susceptible to carryover contamination. Routine laboratory hygiene such as separation of a PCR laboratory from nucleic acid extraction and other processing facilities improved PCR reagent handling (aliquoting reagents), and the use of aerosol barrier pipette tips enabled us to eliminate any major contamination problem confounding our results. Since the protocol described here does not need any post-PCR steps such as gel electrophoresis, it significantly reduces the PCR carryover contamination problem. The total time needed to complete an SYBR Green PCR run from the time a 96-well plate is put into a thermocycler is 2 h 15 min. After the amplification, the data analyses take approximately 15 min. Thus, as little as 2.5 h is needed to complete an SYBR Green PCR run and subsequent data analyses. In a 96-well plate, for each sample, with two replicates for the virus and the
2844
DHAR ET AL.
J. CLIN. MICROBIOL.
FIG. 6. PCR amplification of IHHNV (A)- and WSV (B)-specific DNA in laboratory-challenged-P. stylirostris samples. (C and D) -Actin amplifications for the samples used for panels A and B. The sizes of the amplified DNAs of IHHNV, WSV, and the -actin gene were 329, 306, and 339 bp-, respectively. In each panel, lanes 1 to 6 contain DNAs from virus-challenged samples and lanes 7 and 8 contain DNAs from healthy samples. Lane M, 50-bp DNA step ladder (Sigma).
corresponding -actin control and two positive and two negative controls for the virus and -actin reaction mixtures, 22 samples could be accommodated in a plate (22 ⫻ 2 [virus detection] ⫹ 22 ⫻ 2 [-actin detection] ⫹ 2 [virus-positive control] ⫹ 2 [-actin-positive control] ⫹ 2 [virus-negative control] ⫹ 2 [-actin-negative control] ⫽ 96). This SYBR Green PCR saves considerable time over conventional PCR, making it a suitable method for high-throughput screening. The rapid expansion of shrimp aquaculture industries over the last few decades has coincided with the emergence of new viral pathogens which were previously unknown to shrimp farming. In addition, there have been considerable movements of live and frozen shrimp from one country to another, increasing the risk of spread of viral diseases into the importing country. One of the important ways of preventing a viral epidemic in shrimp is the use of virus-free broodstock and postlarvae for commercial farming. In recent years, conventional two-step PCR has been used to screen broodstock and postlarvae before stocking of the ponds (9). Even two-step PCR often provides false-negative results because the virus level in the sample is beyond the limits of sensitivity of conventional
PCR (9, 17). This has created a growing and an urgent need to develop a better detection method that has higher sensitivity than that of conventional PCR and that at the same time is rapid and reliable. The results described in this paper clearly established the applicability of SYBR Green PCR for the detection and quantification of shrimp viruses because of its exquisite sensitivity and high-throughput potential, which are beyond the limits of conventional PCR. ACKNOWLEDGMENTS The funding for this research was provided by Super Shrimp, Inc. Partial funding for this research was also provided through a grant from the U.S. Department of Commerce, SBIR grant 50-DKNA-190057, to K.R.K. DNA sequencing was performed in the Cancer Center of the Molecular Pathology Shared Resource, University of California, San Diego, which is funded in part by NCI Cancer Center support grant 5P0CA23100-16. We thank Hiroko Shike, University of California, San Diego, for providing the IHHNV clone and Tony Dettori and Dorain Thompson of Super Shrimp, Inc., for their help in maintaining the animals during the virus challenge experiments.
VOL. 39, 2001
SYBR GREEN PCR FOR DETECTION OF SHRIMP VIRUSES REFERENCES
1. Annonymous. 1999. Chinese prawn baculovirus genome fully sequenced. Nature 401:839. 2. Bonami, J.-R., B. Trumper, J. Mari, M. Brehelin, and D. V. Lightner. 1990. Purification and characterization of the infectious hypodermal and hematopoietic necrosis virus of penaeid shrimps. J. Gen. Virol. 71:2657–2664. 3. Cesar, E., B. Nadala, Jr., and Loh. P. C. 1998. A comparative study of three different isolates of white spot virus. Dis. Aquat. Org. 33:231–234. 4. Crain, W. R., Jr., M. F. Boshar, A. D. Cooper, D. S. Durica, A. Nagy, and D. Steffen. 1987. The sequence of a sea urchin muscle actin gene suggests a gene conversion with a cytoskeletal actin gene. J. Mol. Evol. 25:37–45. 5. Durand, S., D. V. Lightner, L. M. Nunan, R. M. Redman, J. Mari, and J.-R. Bonami. 1996. Application of gene probes as diagnostic tools for white spot baculovirus (WSBV) of penaeid shrimp. Dis. Aquat. Org. 27:59–66. 6. Flegel, T. W. 1997. Major viral diseases of black tiger prawn (Penaeus monodon) in Thailand. World J. Microbiol. Biotechnol. 13:433–442. 7. Fyrberg, E. A., B. J. Bond, N. D. Hershey, K. S. Mixter, and N. Davidson. 1981. The actin gene of Drosophila: protein coding regions are highly conserved but intron positions are not. Cell 24:107–116. 8. Holland, P. M., R. D. Abramson, R. Watson, and D. H. Gelfard. 1991. Detection of specific polymerase chain reaction product by utilizing the 5⬘-3⬘ exonuclease activity of Thermus aquaticus DNA polymerase. Proc. Natl. Acad. Sci. USA 88:7276–7280. 9. Hsu, H.-C., C.-F. Lo, S.-C. Lin, K.-F. Liu, S.-E. Peng, Y.-S. Chang, L.-L. Chen, W.-J. Liu, and G.-H. Kou. 1999. Studies on effective PCR screening strategies for white spot syndrome virus (WSSV) detection in Penaeus monodon brooders. Dis. Aquat. Org. 39:13–19. 10. Inouye, K., S. Miwa, N. Oseko, H. Makaro, T. Kimura, K. Momoyama, and K. Hiraoka. 1994. Mass mortality of cultured kuruma shrimp Penaeus japanicus in Japan in 1993: electron microscopic evidence of the causative virus. Fish Pathol. 9:149–158. 11. Jory, D. E., and H. M. Dixon. 1999. Shrimp white spot virus in the western hemisphere. Aquac. Mag. 25:83–91. 12. Kalagayan, H., D. Godin, R. Kanna, G. Hagino, J. Sweeney, J. Wyban, and J. Brock. 1991. IHHN virus as an etiological factor in runt-deformity syndrome of juvenile Penaeus vannamei cultured in Hawaii. J. World Aquac. Soc. 22:235–243. 13. Kim, J. S., P. K. Kim, S. G., Sohn, D. S., Sim, M. A., Park, M. S., Heo, T. H., Lee, J. D., Lee, H. K. Jun, and K. L. Jang. 1998. Development of a PCR procedure for the detection of baculovirus associated with white spot syndrome (WSBV) in shrimp. J. Fish Dis. 21:11–17. 14. Leutenegger, C. M., D. Klein, R. Hofmann-Lehmann, C. Mislin, U. Hummel, J. Boni, F. Boretti, W. H. Guenzburg, and H. Lutz. 1999. Rapid feline immunodefficiency virus provius quantification by polymerase chain reaction using the TaqMan fluorogenic real-time detection system. J. Virol. Methods 78:105–116. 15. Lightner, D. V., and R. M. Redman. 1998. Shrimp diseases and current diagnostic methods. Aquaculture 164:201–220. 16. Lightner, D. V., R. M. Redman, B. T. Poulos, L. M. Nunan, J. L. Mari, and K. W. Hasson. 1996. Risk of spread of penaeid shrimp viruses in the Americans by the international movement of live and frozen shrimp. Rev. Sci. Tech. Off. Int. Epizoot. 16:146–160. 17. Lo, C. F., and G. H. Kou. 1998. Virus associated with white spot syndrome of shrimp in Taiwan: a review. Fish Pathol. 33:365–371. 18. Lo, C. F., J. H. Leu, C. H. Ho, C. H. Chen, S. E. Peng, Y. T. Chen, C. M.
19.
20. 21. 22. 23. 24.
25.
26.
27. 28.
29. 30. 31.
32.
2845
Chou, P. H. Yeh, C. J. Huang, H. Y. Chou, C. H. Wang, and G. H. Kou. 1996. Detection of baculovirus associated with white spot syndrome (WSBV) in penaeid shrimps using polymerase chain reaction. Dis. Aquat. Org. 25:133– 141. Lu, Y., L. M. Tapay, P. C. Loh, R. B. Gose, and J. A. Brock. 1997. The pathogenicity of a baculo-like virus isolated from diseased penaeid shrimp obtained from China for cultured penaeid species in Hawaii. Aquac. Int. 5:277–282. Moody, A., S. Sellers, and N. Bumstead. 2000. Measuring infectious bursal disease virus RNA in blood by multiplex real-time quantitative RT-PCR. J. Virol. Methods 85:55–64. Mounier, N., M. Gouy, D. Mouchiroud, and J. C. Prudhomme. 1992. Insect muscle actins differ distinctly from invertebrate and vertebrate cytoplasmic actins. J. Mol. Evol. 34:406–415. Ririe, K. M., R. P. Rasmussen, and C. T. Wittwer. 1997. Product differentiation by analysis of DNA melting curves during the polymerase chain reaction. Anal. Biochem. 270:154–160. Roberts, C. A., R. G. Dietzgen, L. A. Heelan, and D. J. Maclean. 2000. Real-time RT-PCR fluorescent detection of tomato spotted wilt virus. J. Virol. Methods 88:1–8. Shike, H., A. K. Dhar, J. C. Burns, C. Shimizu, F. X. Jousset, K. R. Klimpel, and M. Bergoin. 2000. Infectious hypodermal and hematopoietic necrosis virus (IHHNV) of shrimp is related to mosquito brevidensoviruses. Virology 277:167–177. Takashi, Y., T. Itami, M. Kondo, M. Maeda, R. Fujii, S. Tomonaga, K. Supamattaya, and S. Boonyaratpalin. 1994. Electron microscopy evidence of bacilliform virus infection in Kuruma shrimp (Penaeus japonicus). Fish Pathol. 29:121–125. Tang, K. F. J., S. Durand, B. L. White, R. M. Redman, C. R. Pantoja, and D. V. Lightner. 2000. Postlarvae and juveniles of a selected line of Penaeus stylirostris are resistant to infectious hypodermal and hematopoietic necrosis virus infection. Aquaculture 190:203–210. van Hulten, M. C. W., M. Westenberg, S. T. Goodal, and J. M. Valk. 2000. Identification of two major virion protein genes of white spot syndrome virus of shrimp. Virology 266:227–236. van Hulten, M. C. W., M.-F. Tsai, C. A. Schipper, C.-F. Lo, G.-H. Kou, and J. M. Valk. 2000. Analysis of a genomic segment of white spot syndrome virus of shrimp containing ribonucleotide reductase genes and repeat regions. J. Gen. Virol. 81:307–316. Withyachmnarnkul, B. 1999. Results from black tiger shrimp Penaeus monodon culture ponds stocked with postlarvae PCR-positive or -negative for white-spot syndrome virus (WSSV). Dis. Aquat. Org. 39:21–27. Witter, C. T., M. G. Herrmann, A. A. Moss, and R. P. Rasmussen. 1997. Continuous fluorescence monitoring of rapid cycle DNA amplification. BioTechniques 22:130–138. Wongteerasupaya, C., J. E. Vickers, S. Sriurairatana, G. L. Nash, A. Akarajamorn, V. Boosaeng, S. Panyim, A. Tassanakajon, B. Withyachumnarnkul, and T. W. Flegel. 1995. A non-occluded, systemic baculovirus that occurs in the cells of ectodermal and mesodermal origin and causes high mortality in the black tiger prawn Penaeus monodon. Dis. Aquat. Org. 21:69–77. Wongteerasupaya, C., S. Wongwisansri, V. Boosaeng, S. Panyim, P. Pratanpipat, G. L. Nash, B. Withyachumnarnkul, and T. Flegel. 1996. DNA fragment of Penaeus monodon baculovirus PmNOBII gives positive in situ hybridization with white spot viral infections in six-penaeid shrimp species. Aquaculture 143:23–32.