Pacific Symposium on Biocomputing 2016
DETECTION OF BACTERIAL SMALL TRANSCRIPTS FROM RNA-SEQ DATA: A COMPARATIVE ASSESSMENT
∗,1,2 ˜ ¨ 2 , MARTIN E MULLIGAN3 , and ANDREW S LANG2 LOURDES PENA-CASTILLO , MARC GRULL 1
Department of Computer Science, Memorial University of Newfoundland, 2 Department of Biology, Memorial University of Newfoundland, 3 Department of Biochemistry, Memorial University of Newfoundland, St. John’s, NL, Canada ∗ E-mail:
[email protected]
Small non-coding RNAs (sRNAs) are regulatory RNA molecules that have been identified in a multitude of bacterial species and shown to control numerous cellular processes through various regulatory mechanisms. In the last decade, next generation RNA sequencing (RNA-seq) has been used for the genome-wide detection of bacterial sRNAs. Here we describe sRNA-Detect, a novel approach to identify expressed small transcripts from prokaryotic RNA-seq data. Using RNA-seq data from three bacterial species and two sequencing platforms, we performed a comparative assessment of five computational approaches for the detection of small transcripts. We demonstrate that sRNA-Detect improves upon current standalone computational approaches for identifying novel small transcripts in bacteria. Keywords: RNA-seq, bacterial small transcripts detection, sRNA
1. Introduction In the last decade, RNA sequencing (RNA-seq) methods have been used to identify small noncoding RNAs (sRNAs) on a genome-wide scale in numerous bacterial species. A key step in the detection of sRNAs from RNA-seq experiments is the analysis of RNA-seq data to assemble and identify expressed transcripts. Most studies identify sRNAs by manual inspection of the sequencing data (e.g., Refs. 1,2), developing their own in-house computational approach (e.g., Ref. 3) or a combination of both (e.g., Ref. 4). Manual identification is a strenuous task and hard to reproduce independently. The last issue also applies to small transcript identification by an in-house computational approach unless the program is made publicly available. In the past three years, several computational approaches to identify novel transcripts from prokaryotic RNA-seq data (e.g., Refs. 5,6) and from eukaryotic RNA-seq data (e.g., Ref. 7) have become available; however, a systematic side by side comparison of their performance has yet to be carried out. In this work, we compared the performance of four standalone computational approaches and our own approach (sRNA-Detect) to identify small transcripts from prokaryotic RNA-seq data. 2. Approaches for the Detection of Small Transcripts From RNA-Seq Data Rockhopper5 is a system that supports several phases of bacterial RNA-seq data analysis, including mapping sequencing reads to a reference genome, data normalization, assembling transcripts and identifying their boundaries, quantifying gene expression, testing for differential gene expression, characterizing operon structures, and visualizing results. This system specifically models bacterial transcriptome features such as operon structures, sRNAs and 456
Pacific Symposium on Biocomputing 2016
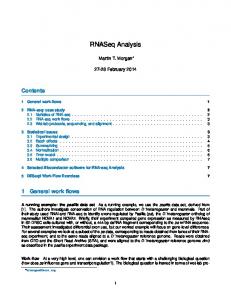
dense genomes with overlapping genes, and uses annotated genes as seeds to generate a transcriptome map. Rockhopper’s capabilities to identify sRNAs were tested on Neisseria gonorrhoeae RNA-seq data.8 In that study, Rockhopper detected 34 small transcripts of which 4 had previously been identified and 11 were experimentally confirmed by Northern blot. TruHMM6 is a Hidden Markov Model-based algorithm for assembling full-length transcripts in bacteria using directional RNA-seq short reads. TruHMM was designed to assemble transcripts with non-uniform read coverage and to address the problem of transcribed regions not covered by sequencing reads. TruHMM has been reported to achieve high sensitivity (recall) in assembling antisense RNAs (asRNAs) and non-coding RNAs (ncRNAs) in Escherichia coli K12 where it was able to recover 102 (91%) of 112 known asRNAs and ncRNAs.6 RNA-eXpress7 is a system to perform feature annotation, comparison, sequence extraction and abundance quantification from eukaryotic RNA-seq data independently of current annotations. Several algorithms were implemented within RNA-eXpress to identify various types of features. Two of these algorithms are the Transcripts algorithm which performs comprehensive transcript identification, and the TLA algorithm which searches for features that have a certain minimum depth coverage and a minimum length. RNA-eXpress was found to achieve 96% accuracy identifying transcripts on region E2 of mouse chromosome 5.7 DETR’PROK pipeline9 is a workflow to detect ncRNAs and untranslated regions (UTRs) in a reference genome from bacterial RNA-seq data using the Galaxy framework.10 Starting from aligned reads and a genome annotation, the DETR’PROK workflow clusters overlapping reads, compares these clusters to the genome annotation, and classifies them into sRNAs, asRNAs, UTRs and operon spacers. DETR’PROK pipeline consists of more than 40 steps, requires a local installation of Galaxy, and detects ncRNAs based on distance between transcripts, their size and read coverage. DETR’PROK pipeline is reported to recover 56% of 63 known E. coli sRNAs.9 Finally, there are several web applications for the analysis of eukaryotic small RNA-seq data that include the detection of novel transcripts. Some of these web applications are Oasis,11 MAGI12 and CPSS.13 3. Our Approach: sRNA-Detect We designed sRNA-Detect under the assumptions that small transcripts (< 250 nt) exhibit relatively uniform read coverage as their whole sequence may fit into a single read, and that RNA-seq data may contain debris from longer transcripts enclosing the small transcript. These assumptions might also be valid for eukaryotic microRNAs, as microRNAs are similar in size to sRNAs and should exhibit uniform coverage; however, unlike microRNAs, sRNAs are usually neither processed nor cleaved to a shorter form. In sum, sRNA-Detect searches for features that have a given minimum depth coverage, are within a given length range, and exhibit low depth coverage variation through their whole sequence. The input to sRNA-Detect is sequencing reads aligned to a reference genome in the sequence alignment/map (SAM) format and the output is a list of detected transcripts in the gene transfer format (GTF). Fig. 1 depicts sRNA-Detect’s algorithm. Basically, sRNA-Detect constructs a coverage vector from the aligned reads for each strand and reference sequence (i.e., chromosomes and 457
Pacific Symposium on Biocomputing 2016
Create a coverage vector for each strand of each reference sequence (i.e., chromosome, plasmid, etc) from SAM files In-a-transcript = FALSE For each coverage vector:
Is there another genomic interval?
No
Output list of transcripts
END
Yes
Read genomic interval
In_a_ transcript?
No
Yes
No
Yes
Obtain new mean coverage, length, percentage change in mean coverage
Percentage change in mean coverage within thresholds?
Read depth coverage > mininum coverage?
Start transcript (In-a transcript = TRUE)
Yes
Extend transcript (In-a transcript = TRUE)
No
Restart transcript (In-a transcript = TRUE)
No
Discard transcript (In-a transcript = FALSE)
Yes
Add transcript to list (In-a transcript = FALSE)
Record transcript information (e.g., genomic coordinates, strand, mean coverage, etc).
No
Did mean coverage decrease?
Yes
Terminate transcript (In-a transcript = FALSE)
Minimum length < transcript length < maximum length?
Fig. 1. Schematic flowchart of sRNA-Detect approach. The input to sRNA-Detect is a set of aligned reads in SAM format. sRNA-Detect’s results are output as GTF files.
plasmids in the reference genome) using the HTSeq python library.14 A coverage vector is a vector of genomic intervals where each interval represents a consecutive genomic stretch with constant coverage. Then sRNA-Detect goes through each coverage vector looking for genomic intervals with a given minimum number of reads aligned to them to start potential small transcripts. Small transcripts are extended into the following genomic intervals as long as their mean depth coverage does not decrease below a given percentage threshold. If the mean depth coverage of a potential transcript decreases, the transcript is terminated and added to the list of detected transcripts if its length is within the specified range. If the mean depth coverage of 458
Pacific Symposium on Biocomputing 2016
the potential transcript increases above a specified percentage threshold, then the transcript’s start coordinate is reset to the start of the current genomic interval. Novel transcripts in the list of detected transcripts can be identified using the corresponding genome annotation and BEDtools.15 As fragments of other longer RNA molecules may be detected, identified sRNAs should be further examined to distinguish authentic sRNAs based on their similarity to RNAs in public databases such as Rfam16 and their predicted secondary structure. sRNA-Detect is available under the GNU GPL license at www.cs.mun.ca/~lourdes. 4. Comparative Assessment Methodology We carried out a comparative assessment of the performance of standalone computer systems for detecting small transcripts from prokaryotic RNA-seq data. This comparative assessment included Rockhopper, TruHMM, the TLA and Transcripts algorithms implemented in RNAeXpress and our own approach sRNA-Detect (see sections 2 and 3). Rockhopper (version 2.02) was executed with the replicons provided for the corresponding bacteria and default values. To execute TruHMM, we followed the instructions provided at http://bioinfolab.uncc.edu/TruHmm_package. During TruHMM training, only genomic coordinates of protein-coding genes were provided as input to TruHMM (i.e., tRNAs and rRNAs were not included in the list of genes). To reconstruct operons and sRNAs, TruHMM’s window size was left to its default value. TruHMM’s predictions per sample were merged using the mergeBed tool available in BEDtools (version 2.16.2). Detection of small transcripts using RNA-express (version 1.4.4) was performed twice: once with the TLA algorithm and once with the Transcript algorithm. For the TLA algorithm the height (read coverage) was set to 10 for the Rhodobacter capsulatus case study and to 15 for the other two case studies, and the width (transcript length) was set to 20. For the Transcripts algorithm the height was set to 10, width to 20, penalty to -2 and tolerance to 500. sRNA-Detect was executed with default parameters; namely, minimum transcript length to 20 nucleotides, maximum transcript length to 210 nucleotides, allowed percentage change in mean coverage from -10% to 30%. Minimum coverage was set to 10 reads for the R. capsulatus case study and to 15 for the other two case studies. Algorithms’ parameters were not optimized for the data sets used in the assessment. To quantify the correctness of an inferred small transcript, we calculated two different measurements: minimum percentage sequence overlap and minimum percentage reciprocal sequence overlap. Minimum percentage sequence overlap indicates that at least that percentage of the sequence of the predicted transcript lies within the boundaries of an actual transcript. Minimum percentage reciprocal sequence overlap indicates that there is at least that percentage of agreement between the sequences of the predicted transcript and an actual transcript. Fig. 2 illustrates both correctness measurements. To evaluate the performance of the various approaches, we calculated their recall, specificity, and accuracy at several levels of the two transcript correctness measurements. Recall indicates the proportion of actual expressed small transcripts that is detected by a given approach (i.e., true positives (TP) divided by the total number of positive instances (P)). Specificity is the proportion of small transcripts absent from the RNA-seq data that is undetected by a given approach (i.e., true negatives (TN) divided by the total number of negative 459
Pacific Symposium on Biocomputing 2016
Actual transcript A
Detected transcript
B C
A B C
Min % sequence Min % reciprocal overlap sequence overlap 100% 80% 50% 20% 100% 100%
Fig. 2. Measurements to quantify the correctness of the detected transcripts. Minimum percentage sequence overlap quantifies what percentage of the sequence of the detected transcript lies within the boundaries of the actual transcript. Minimum percentage of reciprocal sequence overlap quantifies the congruence between the detected and the actual transcript. For example, detected transcripts A and C have both a minimum 100% sequence overlap but only detected transcript C has a minimum 100% reciprocal sequence overlap. Half of the sequence of detected transcript B is within the boundaries of the actual transcript having therefore a minimum 50% sequence overlap, but it only covers 20% of the actual transcript sequence having thus a minimum 20% reciprocal sequence overlap.
instances (N)). Accuracy is the number of correct results (TP + TN) divided by the total number of actual transcripts considered (P + N); i.e., proportion of results that are correct. 4.1. Datasets We assessed the performance of the various approaches using sequence reads from RNA-seq experiments conducted in three different bacteria: Rhodobacter capsulatus, Erwinia amylovora and Deinococcus radiodurans, and generated with two sequencing platforms: Ion Torrent and Illumina. 4.1.1. Rhodobacter capsulatus RNA-seq data RNA was isolated from R. capsulatus strain SB1003 during stationary phase and size-selected for RNAs shorter than 200 nt long to enrich for small transcripts. The isolated small RNAs were used for RNA library preparation for sequencing using an Ion Torrent Personal Genome Machine (PGM) system. In total, data from four RNA-seq experiments containing more than 6 million reads were used. After quality trimming the reads, reads were aligned to the R. capsulatus genome (assembly accession GCA 000021865.1) using the Torrent mapper tmap (version 3.0.1). Tmap was executed with the parameters: -B 18 -a 2 -v stage1 map1 map2 map3. These sequencing data were also used in another study for the genome-wide identification of candidate sRNAs in R. capsulatus (Pe˜ na-Castillo, Gr¨ ull, et al., submitted for publication). To create a test data set for our comparative assessment, we obtained the genome annotation for R. capsulatus (release 21.75) from EnsemblBacteria.17 R. capsulatus gene models were generated by Ensembl using the Ensembl Bacteria pipeline.18 Then we selected all annotated transcripts shorter than 200 nucleotides in length and we counted the number of reads aligned to these 176 small transcripts using the script htseq-count available in HTSeq (version 0.5.4p5). The htseq-count script was executed using mode intersection-nonempty, feature type gene, and all other parameters set to default values. We then classified these small transcripts as “expressed” or “not-expressed” based on the number of reads aligned to them across 460
Pacific Symposium on Biocomputing 2016
the four samples. Small transcripts (including tRNAs, rRNAs and mRNAs) with at least 10 reads aligned to them were classified as “expressed”, while transcripts with fewer than 5 reads aligned to them were classified as “not-expressed”. In our evaluation, the 90 expressed small transcripts were counted as positive instances, while the 74 not-expressed transcripts were counted as negative instances. 4.1.2. Erwinia amylovora RNA-seq data We obtained E. amylovora RNA-seq data containing more than 53 million reads from NCBIGEO19 (accession numbers GSM1300251, GSM1300250, GSM1300248, and GSM1300247). Details of the E. amylovora RNA-seq experiments are described elsewhere.20 In sum, sRNA libraries from E. amylovora Ea1189 were constructed from total RNAs using the Illumina TruSeq small RNA sample preparation kit and sequenced using an Illumina HiSeq 2000 system.20 We aligned reads to the E. amylovora ATCC 49946 genome (assembly accession GCA 000027205.1 ) using Bowtie221 (version 2.1.0) with the preset parameters of the –sensitive option. Seventeen E. amylovora sRNAs have had their expression and size confirmed by Northern blot and one more sRNA that was not detected by Northern blot has had its transcription start site mapped by 5’ RACE assay.20,22 These 18 sRNAs are listed in Table 1 of Ref. 20. We considered these 18 sRNAs as true sRNAs and used them to estimate the recall of the computational approaches. 4.1.3. Deinococcus radiodurans RNA-seq data We obtained D. radiodurans sequencing data containing more than 36 million reads from NCBI-GEO (accession number GSE64952). Details of the D. radiodurans RNA-seq experiments have been published previously.23 In sum, cDNA libraries were prepared from total RNAs that were extracted from irradiated or non-irradiated D. radiodurans R1 cells and used to construct a cDNA library using a NEBNext Small RNA Library Prep Set for Illumina. The library was then sequenced with an Illumina HiSeq 2000 system.23 We aligned reads to the D. radiodurans genome (assembly accession GCA 000008565.1) using Bowtie2 (version 2.1.0) with the preset parameters of the –sensitive-local option and allowing one mismatch in a seed alignment (-N 1). Tsai et al.23 confirmed by Northern blot and/or RT-PCR the expression of 33 sRNAs detected from the RNA-seq data. We considered these 33 sRNAs as true sRNAs and used them to estimate the recall of the computational approaches. 5. Results and Discussion In the following sections we present and discuss the performance of the five computational approaches to identify bacterial small transcripts in three case studies. 5.1. Case study 1: Detection of annotated small transcripts in R. capsulatus Using the aligned R. capsulatus reads as input, we executed each of the five computational approaches and identified the transcripts in the test data set predicted as expressed by each 461
Pacific Symposium on Biocomputing 2016
approach at ten different levels of overlap (from 10% to 100%). To do this we used the intersectBed tool available in BEDtools. Transcripts reported by Rockhopper to have at least an expression measurement of 10 were considered predicted as expressed. Those transcripts detected by TruHMM in at least three samples were considered predicted as expressed. RNAeXpress and sRNA-Detect both had a parameter specifying a minimum of 10 read coverage across all samples to report a transcript as expressed, thus no extra filtering was done to their output. Fig. 3 shows the recall, specificity and accuracy of the five systems as a function of the correctness of the predicted transcript. Transcript correctness was measured as either minimum percentage sequence overlap or minimum percentage reciprocal sequence overlap (see Fig. 2). The recall and accuracy of all systems (except Rockhopper) decreased as the required correctness of the predicted transcript increased. As Rockhopper uses the genomic coordinates of the annotated transcripts provided in the corresponding replicons to guide its search for expressed transcripts, its performance measurements remained nearly constant across the various overlapping levels. Among the systems determining the transcript boundaries directly from the sequencing data, sRNA-Detect had the least pronounced drop in performance as the required transcript correctness increased. At a minimum of 80% sequence overlap Rockhopper and sRNA-Detect are able to retrieve at least 63 (or 70%) of the 90 expressed transcripts, while all other approaches detected less than 23 (or 25%) of the expressed transcripts. In terms of specificity, most systems (except Rockhopper) were able to discriminate all negative instances as “not-expressed” at a minimum of 80% sequence overlap, while Rockhopper incorrectly identified as expressed 22 (or 29.7%) of the 74 “not-expressed” annotated transcripts bringing its specificity down to 70%. In terms of accuracy, sRNA-Detect outperforms all other systems up to a minimum 80% sequence overlap or a minimum 50% reciprocal sequence overlap. Above those transcript correctness levels, Rockhopper is the most accurate system for the identification of expressed known small transcripts. We looked at the length of the transcripts detected as expressed by each computational approach with a minimum 10% sequence overlap. Fig. 4 shows the length distribution of the predicted transcripts per computational approach. As can be seen from this figure, Rockhopper, sRNA-Detect and the RNA-eXpress TLA algorithm predicted transcripts that were mostly in the correct length range, while TruHMM and the RNA-eXpress Transcript algorithm predicted transcripts that were well above the average actual length of the expressed transcripts. This is likely due to the fact that both of these approaches try to join fragments that may belong to the same transcript but are disconnected in the RNA-seq data because of gaps in read coverage. Based on this finding and on the low recall rate achieved by TruHMM and the RNA-eXpress Transcript algorithm, we concluded that these two approaches were not suitable for the detection of small transcripts from prokaryotic sequencing data and excluded them from subsequent evaluations.
462
100 80 60
Recall (%)
40
60 40
0
0
20
40
60
80
100
20
60
80
100
100 80 60 40
Specificity (%)
80 60 40
Rockhopper sRNADetect RNAExpress_TLA RNAExpress_Transcript TruHmm
0
0
20
Rockhopper sRNADetect RNAExpress_TLA RNAExpress_Transcript TruHmm
20
Specificity (%)
40
Minimum % reciprocal sequence overlap
100
Minimum % sequence overlap
20
40
60
80
100
20
40
60
80
100
80 60 20
Rockhopper sRNADetect RNAExpress_TLA RNAExpress_Transcript TruHmm
0
0
20
Rockhopper sRNADetect RNAExpress_TLA RNAExpress_Transcript TruHmm
40
40
60
Accuracy (%)
80
100
Minimum % reciprocal sequence overlap
100
Minimum % sequence overlap
Accuracy (%)
Rockhopper sRNADetect RNAExpress_TLA RNAExpress_Transcript TruHmm
20
Rockhopper sRNADetect RNAExpress_TLA RNAExpress_Transcript TruHmm
20
Recall (%)
80
100
Pacific Symposium on Biocomputing 2016
20
40
60
80
100
20
Minimum % sequence overlap
40
60
80
100
Minimum % reciprocal sequence overlap
Fig. 3. Performance results for the identification of annotated small transcripts from R. capsulatus RNA-seq data. Left side plots show performance measurements as a function of the minimum percentage sequence overlap. Right side plots show performance measurements as a function of the minimum percentage reciprocal sequence overlap (see Fig. 2). Note that Rockhopper uses the genomic coordinates of the annotated small transcripts as input, while all other approaches estimate transcript boundaries directly from the RNA-seq data.
5.2. Case study 2: Detection of experimentally confirmed novel sRNAs in E. amylovora In this case study we assessed how many experimentally confirmed sRNAs Rockhopper, sRNADetect and the RNA-eXpress TLA algorithm were able to retrieve from E. amylovora RNA-seq 463
Pacific Symposium on Biocomputing 2016
1500
● ● ● ●
●
1000
● ● ●
500
Transcript length (bp)
● ●
●
● ● ● ● ● ●
0
● ● ● ●
Ensembl
Rockhopper sRNA−Detect
TLA*
Transcript*
TruHmm
Fig. 4. Length (nt) distribution of R. capsulatus expressed and annotated small transcripts. The box labelled as Ensembl shows the length of the small transcripts as provided in R. capsulatus genome annotation (release 21.75). The dashed horizontal line indicates the average length of the small transcripts based on the genome annotation used. * Algorithms available in RNA-eXpress. Table 1. Method RNA-eXpress TLA Rockhopper sRNA-Detect
Number of detected transcripts in E. amylovora RNA-seq data per method Total number of detected transcripts
Total number of detected novel transcripts
16,458 2,646 42,364
1,680 167 4,086
data. As the genomic coordinates of the confirmed sRNAs are not included in E. amylovora genome annotation, all systems (including Rockhopper) had to determine the sRNA boundaries directly from the RNA-seq data and thus their recall rate deteriorated as the required level of transcript correctness increased. Fig. 5 shows the systems’ recall rate as a function of transcript correctness. The total number of detected transcripts and the number of detected novel transcripts per approach are provided in Table 1. Novel transcripts are those transcripts that do not overlap with known annotated features such as mRNAs and rRNAs. As the RNA-eXpress TLA algorithm and sRNA-Detect end transcripts when a gap in coverage is encountered, both of them might detect multiple fragments corresponding to a single longer transcript, and hence report a larger number of detected transcripts. sRNA-Detect retrieved all 18 confirmed sRNAs up to a minimum percentage sequence overlap of 90%, while Rockhopper retrieved 6 (or 33.3%) of the 18 confirmed sRNAs at a minimum 90% sequence overlap and the RNA-eXpress TLA algorithm recovered one confirmed sRNA at the same minimum percentage sequence overlap. When transcript correctness is measured as minimum percentage reciprocal overlap, sRNA-Detect detected more confirmed sRNAs than those detected by the two other approaches up to a minimum reciprocal sequence 464
100 80 40
60
sRNA−Detect Rockhopper RNAExpress_TLA
0
0
20
40
Recall (%)
60
sRNA−Detect Rockhopper RNAExpress_TLA
20
Recall (%)
80
100
Pacific Symposium on Biocomputing 2016
20
40
60
80
100
20
Minimum % sequence overlap
40
60
80
100
Minimum % reciprocal sequence overlap
Fig. 5. Recall achieved by each computational approach during the identification of 18 experimentally confirmed E. amylovora sRNAs at various levels of transcript correctness.
overlap of 50%, above this point the RNA-eXpress TLA algorithm detected more confirmed sRNAs up to a minimum reciprocal sequence overlap of 90%. No computational approach was able to detect a single sRNA at a minimum 100% reciprocal overlap. These results indicate that the sRNAs predicted by sRNA-Detect are within the boundaries of the actual sRNA but fail to cover the whole sRNA actual sequence. This test also suggests that Rockhopper recall rates decrease when a priori knowledge of transcript boundaries is unavailable.
5.3. Case study 3: Detection of experimentally confirmed novel sRNAs in D. radiodurans Here we assessed the systems’ recall based on the number of experimentally confirmed sRNAs that the computational approaches were able to retrieve from D. radiodurans RNA-seq data. Fig. 6 shows the systems’ recall rate as a function of transcript correctness. At a minimum sequence overlap of 90%, sRNA-Detect recovered 29 (or 87.9%) of the 33 confirmed sRNAs, while the RNA-eXpress TLA algorithm retrieved 3 (or 9.1%) of the confirmed sRNAs and Rockhopper recovered one of them. Following the same trend as that seen in the E. amylovora case study, when transcript correctness is measured as minimum percentage reciprocal overlap, the RNA-eXpress TLA algorithm recovered more confirmed sRNAs than those recovered by sRNA-Detect and Rockhopper at a minimum percentage reciprocal overlap of 40% and above. However, when transcript correctness is measured as minimum percentage overlap, sRNADetect has higher recall rates than those of the other two approaches. The total number of detected transcripts and the number of detected novel transcripts per approach are provided in Table 2. 465
100 80 60
sRNA−Detect Rockhopper RNAExpress_TLA
0
0
20
40
Recall (%)
40
60
sRNA−Detect Rockhopper RNAExpress_TLA
20
Recall (%)
80
100
Pacific Symposium on Biocomputing 2016
20
40
60
80
100
20
Minimum % sequence overlap
40
60
80
100
Minimum % reciprocal sequence overlap
Fig. 6. Recall achieved by each computational approach during the identification of 33 experimentally confirmed D. radiodurans sRNAs at various levels of transcript correctness.
Table 2. Method RNA-eXpress TLA Rockhopper sRNA-Detect
Number of detected transcripts in D. radiodurans RNA-seq data per method Total number of detected transcripts
Total number of novel detected transcripts
17,687 2,302 6,740
1,168 47 828
6. Conclusions Our sRNA-Detect approach demonstrated higher recall rates than those of other standalone systems. Small transcripts predicted by sRNA-Detect tend to lie within actual transcript boundaries and be smaller in length than the actual transcripts as indicated by the drop in recall rates when transcript correctness is measured as minimum percentage reciprocal sequence overlap. The results from our first case study indicate that most approaches show high specificity suggesting that false positives might not be a critical concern in the systems’ performance; however, false positives may be detected if fragments from larger transcripts are present in the sequencing data. Thus, identified sRNAs should be further examined to distinguish authentic sRNAs. Criteria to consider in determining authentic sRNAs include secondary structure, phylogenetic conservation, and genomic context. If sRNAs are partially degraded, sRNA-Detect and the RNA-eXpress TLA algorithm may split transcripts into fragments with uniform read coverage. Based on our results, there is still room for improvement in the computational detection of bacterial small transcripts from RNA-seq data, especially in terms of achieving full recovery of transcript sequence. 466
Pacific Symposium on Biocomputing 2016
Acknowledgements LPC’s and ASL’s research programs are supported by NSERC Discovery grants. MG is supported by a fellowship of Memorial University’s School of Graduate Studies. References 1. O. A. Soutourina, M. Monot, P. Boudry, L. Saujet, C. Pichon, O. Sismeiro, E. Semenova, K. Severinov, C. Le Bouguenec, J.-Y. Copp´ee, B. Dupuy and I. Martin-Verstraete, PLoS Genet 9, p. e1003493 (May 2013). 2. I. Wilms, A. Overl¨oper, M. Nowrousian, C. M. Sharma and F. Narberhaus, RNA Biol 9, 446 (Apr 2012). 3. A. Mentz, A. Neshat, K. Pfeifer-Sancar, A. P¨ uhler, C. R¨ uckert and J. Kalinowski, BMC Genomics 14, p. 714 (2013). 4. M. J. Moody, R. A. Young, S. E. Jones and M. A. Elliot, BMC Genomics 14, p. 558 (2013). 5. R. McClure, D. Balasubramanian, Y. Sun, M. Bobrovskyy, P. Sumby, C. A. Genco, C. K. Vanderpool and B. Tjaden, Nucleic Acids Res 41, p. e140 (Aug 2013). 6. S. Li, X. Dong and Z. Su, BMC Genomics 14, p. 520 (2013). 7. S. C. Forster, A. M. Finkel, J. A. Gould and P. J. Hertzog, Bioinformatics 29, 810 (Mar 2013). 8. R. McClure, B. Tjaden and C. Genco, Front Microbiol 5, p. 456 (2014). 9. C. Toffano-Nioche, Y. Luo, C. Kuchly, C. Wallon, D. Steinbach, M. Zytnicki, A. Jacq and D. Gautheret, Methods 63, 60 (Sep 2013). 10. J. Goecks, A. Nekrutenko, J. Taylor and Galaxy Team, Genome Biol 11, p. R86 (2010). 11. V. Capece, J. C. Garcia Vizcaino, R. Vidal, R.-U. Rahman, T. Pena Centeno, O. Shomroni, I. Suberviola, A. Fischer and S. Bonn, Bioinformatics 31, 2205 (Jul 2015). 12. J. Kim, E. Levy, A. Ferbrache, P. Stepanowsky, C. Farcas, S. Wang, S. Brunner, T. Bath, Y. Wu and L. Ohno-Machado, Bioinformatics 30, 2826 (Oct 2014). 13. Y. Zhang, B. Xu, Y. Yang, R. Ban, H. Zhang, X. Jiang, H. J. Cooke, Y. Xue and Q. Shi, Bioinformatics 28, 1925 (Jul 2012). 14. S. Anders, P. T. Pyl and W. Huber, Bioinformatics 31, 166 (Jan 2015). 15. A. R. Quinlan and I. M. Hall, Bioinformatics 26, 841 (Mar 2010). 16. S. W. Burge, J. Daub, R. Eberhardt, J. Tate, L. Barquist, E. P. Nawrocki, S. R. Eddy, P. P. Gardner and A. Bateman, Nucleic Acids Res 41, D226 (Jan 2013). 17. P. J. Kersey, J. E. Allen, M. Christensen, P. Davis, L. J. Falin, C. Grabmueller, D. S. T. Hughes, J. Humphrey, A. Kerhornou, J. Khobova, N. Langridge, M. D. McDowall, U. Maheswari, G. Maslen, M. Nuhn, C. K. Ong, M. Paulini, H. Pedro, I. Toneva, M. A. Tuli, B. Walts, G. Williams, D. Wilson, K. Youens-Clark, M. K. Monaco, J. Stein, X. Wei, D. Ware, D. M. Bolser, K. L. Howe, E. Kulesha, D. Lawson and D. M. Staines, Nucleic Acids Res 42, D546 (Jan 2014). 18. Ensembl Bacteria Pipeline, http://ensemblgenomes.org/info/data/bacteria_pipeline. 19. T. Barrett, S. E. Wilhite, P. Ledoux, C. Evangelista, I. F. Kim, M. Tomashevsky, K. A. Marshall, K. H. Phillippy, P. M. Sherman, M. Holko, A. Yefanov, H. Lee, N. Zhang, C. L. Robertson, N. Serova, S. Davis and A. Soboleva, Nucleic Acids Res 41, D991 (Jan 2013). 20. Q. Zeng and G. W. Sundin, BMC Genomics 15, p. 414 (2014). 21. B. Langmead and S. L. Salzberg, Nat Methods 9, 357 (Apr 2012). 22. Q. Zeng, R. R. McNally and G. W. Sundin, J Bacteriol 195, 1706 (Apr 2013). 23. C.-H. Tsai, R. Liao, B. Chou and L. M. Contreras, Appl Environ Microbiol 81, 1754 (Mar 2015).
467