3. Received 1995 July 17; accepted 1995 August 25. ABSTRACT. Extended X-ray emission was ... In the images, strong X-ray emission from the host galaxy.
THE ASTROPHYSICAL JOURNAL, 453 : L13–L16, 1995 November 1 q 1995. The American Astronomical Society. All rights reserved. Printed in U.S.A.
DETECTION OF INVERSE-COMPTON X-RAYS FROM LOBES OF THE RADIO GALAXY FORNAX A H. KANEDA, 1 M. TASHIRO, 1 Y. IKEBE, 2 Y. ISHISAKI, 1 H. KUBO, 3 K. MAKISHIMA, 1 T. OHASHI, 4 Y. SAITO, 1 H. TABARA, 5 AND T. TAKAHASHI 3 Received 1995 July 17; accepted 1995 August 25
ABSTRACT Extended X-ray emission was detected with ASCA from the synchrotron double lobes of the radio galaxy Fornax A. This is thought to be the same emission as was detected with ROSAT. The excess X-rays exhibit very hard spectra, described by a power law of energy index 1.2 H 0.5. Since this index is consistent with the synchrotron radio index of 0.9 H 0.2, the X-rays are thought to arise when the radio-emitting relativistic electrons make inverse-Compton scattering off the cosmic microwave photons. Comparison of the X-ray and radio fluxes yields the lobe magnetic field intensity of 2– 4 mG. The relativistic electrons in the lobes are inferred to have an energy density close to that of the magnetic fields. Subject headings: magnetic fields — radiation mechanisms: nonthermal — radio continuum: galaxies — X-rays: galaxies 1. INTRODUCTION
2. OBSERVATION
It is known almost as a textbook case (e.g. Harris & Grindlay 1979) that relativistic electrons can release energy into radiation via the synchrotron radiation (SR) process and the inverse-Compton (IC) process, with a rate that is proportional to energy densities in the magnetic field u m 5 B 2 /8p and in the ‘‘soft’’ photons, respectively. The SR process has been observed widely, e.g., as in radio emission from lobes of radio galaxies. There, electrons of Lorentz factor g 5 10 3–5 and magnetic fields of typical strength B 1 1 mG are thought to produce SR radio photons of frequency n SR 1 4g 2 (B/mG) Hz. The relativistic electrons in the radio lobes must also make an IC scattering off the cosmic microwave background (CMB) photons with frequency n 1 10 11 (1 1 z) ( z is redshift) and boost them up to a frequency n IC 1 g 2 n, i.e., into X-ray and gamma-ray regions. Since the CMB energy density u CMB 5 4.1 3 10 213 (1 1 z) 4 ergs s 21 is precisely known, a comparison of the SR radio flux and the IC X-ray flux would allow us to directly estimate u m in lobes and to examine energy equipartition between particles and fields. However, searches for the IC X-rays from radio lobes have long been unsuccessful (Marshall & Clark 1981) or inconclusive (Feigelson et al. 1987; Morini, Anselmo, & Molteni 1989). Following the detection of synchrotron–self-Compton X-rays from radio hot spots of Cygnus A (Harris, Carilli, & Perley 1994), extended X-ray emission was finally detected with ROSAT from lobes of the radio galaxy Fornax A and interpreted as the long-sought IC emission (LaurentMuehleisen et al. 1994; Feigelson et al. 1995, hereafter FEA95). Using ASCA, we have independently detected the same X-ray radiation from the Fornax A radio lobes. The X-ray spectra obtained with ASCA strongly support the IC interpretation.
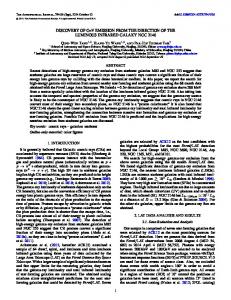
Fornax A (For A; NGC 1316) is the fourth strongest extragalactic radio source in the GHz region, exhibiting a prototypical double lobe morphology (Fig. 1a; Ekers et al. 1983). Since For A is located at outskirts of the relatively poor Fornax cluster of galaxies (e.g., Ikebe et al. 1992), its emission is expected to be rather clear of thermal X-ray contamination from the cluster environment. This property makes For A ideal for the search of the IC X-rays. We observed For A with ASCA (Tanaka, Inoue, & Holt 1994) on 1994 January 11, based on an AO-1 proposal which had been accepted before we knew the ROSAT result. The pointing direction during the observation was such that the For A lobes just fitted in the 1459 diameter field of view of the GIS (Gas Imaging Spectrometer; Kohmura et al. 1993) instrument (Fig. 1a), but remained mostly outside the 229 3 119 (2-CCD mode) field of view of the SIS (Solid State Spectrometer) instrument. Therefore, below we concentrate on the GIS data.
1
3. DATA ANALYSIS AND RESULTS
3.1. X-Ra y Images Figures 1b and 1c show X-ray images of For A obtained as a sum of the two GIS detectors (called GIS2 and GIS3). The non–X-ray background (NXB) has been subtracted using the data acquired when the X-ray telescope (XRT) is pointing to the night Earth, but the cosmic X-ray background (CXB) is not subtracted. The images have been corrected for the XRT vignetting and smoothed through convolution with the position-dependent point-spread function (PSF; 139 in diameter) of the XRT. In the images, strong X-ray emission from the host galaxy NGC 1316 is seen near the field center. In addition, the 1.5–7 keV image (Fig. 1b) reveals an apparently diffuse emission from the two lobe regions. For either lobe, the excess X-rays within the dashed region in Figure 1b amount to (0.5 H 0.1) 3 10 24 counts s 21 arcmin 22 in 1–7 keV per detector. Here and hereafter, all the errors refer to 90% confidence limits including both statistical and systematic errors. For the same regions and bandwidth, the NXB plus CXB becomes
Department of Physics, University of Tokyo, Bunkyo-ku, Tokyo, Japan
113. The Institute of Physical and Chemical Research, Wako, Saitama 351-01. Institute of Space and Astronautical Science, Sagamihara, Kanagawa, Japan 229. 4 Department of Physics, Tokyo Metropolitan University, Hachioji, Tokyo, Japan 192-03. 5 Department of Physics, University of Utsunomiya, Minemachi, Utsunomiya, Japan 320. 2 3
L13
L14
KANEDA ET AL.
Vol. 453
FIG. 1.—X-ray and radio maps of Fornax A in the J2000 coordinates. Arrows indicate presumed background point sources. (a) The ASCA GIS field of view (solid circle) superposed on the 1.4 GHz radio continuum map from Ekers et al. (1983). (b) The 1.5–7 keV X-ray image obtained by the GIS, shown after subtraction of the non–X-ray background, correction for vignetting, and smoothing. Contour levels are logarithmic, from 19% to 83% of the peak brightness, with the CXB level at 13%. The dashed lines show regions used to derive the lobe spectra. (c) Same as (b), but in the 0.7–1.5 keV band. The logarithmic contour levels range from 8% to 83%, with the CXB level at 5%. The dotted circles show regions used for estimating the off-lobe spectrum. (d) A map of the spectral hardness ratio defined as H/S, where H and S are signals in 1.5–7 keV and 0.7–1.5 keV, respectively, and calculated after subtracting the CXB. It is further smoothed with a Gaussian of s 5 1#5. Hardness was not calculated for shadowed regions, where the signal is weaker than the CXB plus 0.5 rms noise level. The contours (from lower to higher levels) correspond to the hardness ratios of 1.6, 1.9, 2.2, 2.6, and 2.9, or to energy indices of 1.2, 1.0, 0.8, 0.6, and 0.4.
(2.3 H 0.1) 3 10 24 counts s 21 arcmin 22 . Therefore the excess count significantly exceeds the background uncertainty. Due to limited resolution of the ASCA XRT, our X-ray images exhibit weaker resemblance to the radio lobe morphology than the ROSAT image does (FEA95). The ASCA X-ray lobes appear smaller than the radio lobes, and it is not obvious whether the observed X-ray emission is diffuse or due to collection of point sources. We in fact consider two particular enhancements in Figure 1 (arrows) to be background point sources because they have counterparts in the ROSAT point source list (Laurent-Muehleisen 1995). The dashed regions of Figure 1b have been chosen to avoid one of these sources, although the other point source still remains in the data accumulation region, contributing 120% to the excess count rate in the east lobe. In the subsequent data analysis, we
estimate its spectrum separately and take it into account as a fixed component. There are in fact a few more ROSAT point sources falling in the two integration regions. However, all of them are so weak and/or soft that their total contribution to the lobe X-ray flux is at most 125% in .1.5 keV. We therefore conclude that, except the two point sources, the X-ray emission we observed from the lobe regions is basically of diffuse nature and is identical to what ROSAT discovered. 3.2. X-Ra y Spectra Figure 2 shows the GIS spectra of the lobe X-rays for the two regions of Figure 1b, presented after subtracting both the NXB and the CXB. The background data were derived from
No. 1, 1995
INVERSE-COMPTON X-RAYS FROM FORNAX A
FIG. 2.—Background-subtracted X-ray spectra for the dashed regions in Fig. 1b, taken with the two GIS detectors and shown without removing the detector response. (a) The west lobe spectrum fitted with a sum of a power-law model with energy index 0.9, and a plasma emission model with temperature 0.95 keV and abundance of 0.4 solar. (b) Same as (a), but for the east lobe. The spectrum of a background point source is estimated separately using an integration region of 29 radius and included here as a power-law model of energy index 0.49 with a fixed normalization.
deep pointings onto blank sky regions (Ikebe 1995), and the errors in the obtained spectra are dominated by photon statistics. The lobe X-rays thus exhibit very hard spectra, which are significant up to 15 keV. This is also visualized clearly in the hardness map of Figure 1d. To examine the possibility of the lobe X-rays arising via thermal processes, we first fitted the total lobe spectrum by the plasma emission model (Raymond & Smith 1977) with free
L15
temperature and abundance. The energy band was limited to 1.7–7 keV to avoid contamination from ambient soft emission (§ 3.3). The fit is acceptable (x 2 /n 5 10.7/10), but the temper1E keV with a rather ature becomes as high as kT 5 5.8 23.2 unconstrained abundance. The inferred emission integral (* n e2 dV ) is 17 3 10 62 cm 23 for each lobe. If such a hot plasma were distributed uniformly within the lobes, its confinement would be a major difficulty, since the virial temperature of NGC 1316 and the Fornax cluster is 11 keV at most (e.g., Jones et al. 1995). Furthermore such a plasma is inferred to have a density n e 1 2 3 10 24 cm 22 and hence a thermal energy density 12 3 10 212 ergs cm 23 . This is comparable to or larger than the minimum nonthermal energy density u m 1 u e 1 5 3 10 213 ergs cm 23 in the lobes required to produce the radio emission, where u e is the energy density in relativistic electrons. This contradicts the dominance of nonthermal pressure in similar systems, e.g., the jet terminal lobes of SS 433 (Yamauchi, Kawai, & Aoki 1994). The thermal emission might alternatively arise in sheathlike hot regions of thickness 10.6[n e /(10 24 cm 23 )] 22 times the lobe radius, shock produced by the expanding lobes around them. However the inferred kT would require the lobe expansion velocity to be .10 8 cm s 21 , which seems .3 times larger than is suggested by the size and age (.10 8 yr; Ekers et al. 1983) of the lobes. Furthermore in this case the X-ray lobes should appear larger than the radio lobes because of rim brightening, which does not seem to be the case. All these considerations make the thermal interpretation difficult to accept. On the contrary, the lobe spectra can be fitted over the same 1.7–7 keV range better with a power-law model (Table 1). For either lobe, the X-ray energy index a thus determined is consistent with the radio index of 0.9 H 0.2 derived from published radio fluxes (Cameron 1971; Shimmins 1971; Ekers et al. 1983). This strongly suggests that the observed lobe X-rays are actually produced through the IC process by the same electron population that is generating the SR radio photons, since in such a case the radio and X-ray energy indices should take the same value a 5 ( p 2 1)/ 2, where p is power-law index of the electron spectrum. In addition, since the CMB photons dominate local synchrotron photons by 110 4 h times in energy density, where h is the lobe-filling factor, the X-rays are thought to arise via Comptonization of the CMB photons rather than via synchrotron–self-Compton process.
TABLE 1 X-RAY
AND
RADIO DATA
OF THE
FORNAX A LOBES
Parameter b
X-ray energy index . . . . . . . . . . . . . . . . . . . . . . . . . . . . . . . . . . . . . . . . . . Fit chi-squared/d.o.f. b . . . . . . . . . . . . . . . . . . . . . . . . . . . . . . . . . . . . . . . . Energy flux density at 1 keV (10 27 Jy) c . . . . . . . . . . . . . . . . . . . . . 1.4 GHz radio flux density (Jy) . . . . . . . . . . . . . . . . . . . . . . . . . . . . . . Magnetic energy density (10 213 ergs cm 23 ) . . . . . . . . . . . . . . . . . Root mean square magnetic field B (mG). . . . . . . . . . . . . . . . . . . Electron energy density d (10 213 ergs cm 23 ) . . . . . . . . . . . . . . . . .
AND THE
West Lobe
DERIVED QUANTITIES a East Lobe
1.4 H 0.7 0.7 H 0.9 3.9/5 2.3/5 0.9 H 0.4 1.1 H 0.5 53 31 4.9 H 1.6 2.3 H 1.0 3.5 H 0.6 2.4 H 0.6 (2.3 H 1.0)q 21 (4.2 H 2.0)q 21
East plus West 1.2 H 0.5 7.0/11 2.0 H 0.6 84 3.6 H 1.1 3.0 H 0.5 (3.0 H 1.3)q 21
a All the quantities are within the X-ray integration regions of Fig. 1b. The magnetic field is assumed to be constant and randomly oriented, and the radio and X-ray emissions are assumed to be isotropic. All the errors refer to single-parameter 90% confidence limits. b The 1.7–7 keV GIS spectra are fitted with a single power-law model. c The 0.7–7 keV GIS spectra are fitted with an a 5 0.9 power-law model and a kT 5 0.95 keV Raymond-Smith model. The listed quantity refers to the power-law component only. d Assuming an electron distribution over g 5 10 3–5 with p 5 2.8, together with q [ h(D/ 20 Mpc), where h is the lobe filling factor and D is the source distance.
L16
KANEDA ET AL. 3.3. Ambient Thermal Emission
We also find excess X-rays in regions orthogonal to the radio lobes. However this off-lobe emission is much softer; the spectrum accumulated over the two off-lobe regions of Figure 1c can be fitted well (x 2 5 8.4 for n 5 8) with the plasma emission model of temperature kT 5 0.95 H 0.41 keV, with the abundance fixed at 0.4 solar which is typical of elliptical galaxies (Awaki et al. 1994). The brightness of this soft emission increases steeply toward NGC 1316 (Fig. 1c), finally overwhelming the hard emission from NGC 1316. This is the reason that NGC 1316 itself does not show up in the hardness map of Figure 1d. We therefore presume that the off-lobe X-rays are thermal emission from the plasma halo gravitationally confined by the host galaxy (e.g., Awaki et al. 1994). As shown in Figure 2, the entire 0.7–7 keV lobe spectra have been fitted well by the sum of a lobe power-law model and a halo plasma emission model, in which a 5 0.9 and kT 5 0.95 are fixed while the component normalizations are left free. This procedure provides the final IC X-ray flux values (Table 1). We find the west lobe X-ray flux to be 10.1 mJ at 1 keV, which is consistent with the ROSAT value of 0.15 mJ within uncertainties of the two measurements. The surface brightness of the halo component in the lobe spectra is 20%– 60% of that required by the off-lobe spectrum. Therefore, the halo plasma seems somewhat evacuated in the lobes by relativistic electrons, as observed in some other systems (e.g., Carilli, Perley, & Harris 1994). 4. DISCUSSION
The present ASCA results on the For A lobes, together with those from ROSAT, provide the first strong evidence for the IC mechanism working on the CMB photons. Particularly, the nonthermal nature of the emission is a direct inference of the very hard ASCA spectra. By comparing the lobe X-ray fluxes thus determined with the radio fluxes integrated over the same regions, we estimate
the average magnetic energy density u m , and hence the rms field intensity B, both weighted by u e . Specifically we use equation (11) and Table 1 of Harris & Grindlay (1979) with a 5 0.9 ( p 5 2.8). As shown in Table 1, the calculation indicates B 5 2– 4 mG in both lobes. Interestingly, the estimated u m is close to u CMB , implying that the electrons lose energy almost equally by the two emission processes. We may also solve equation (10) of Harris & Grindlay (1979) for the electron spectrum to estimate u e based on the IC X-ray flux and the size of the data integration regions, but without using the radio flux. Although the result depends on the source distance D, the lobe-filling factor h, and the electron spectrum, the values of u e derived under plausible assumptions given in Table 1 are fairly close to u m . Therefore, as discussed by FEA95, the energy equipartition seems to grossly hold between particles and fields in the lobes, unless the proton energy density overwhelms u e or h ,, 1. Furthermore, the possibly smaller size of the X-ray lobes than the radio lobes suggests a positive gradient in the SR to IC emissivity ratio and hence in the u m /u e ratio. This resembles the calculation of Kennel & Coroniti (1984) who revealed that the ratio u m /u e in the postshock region of the Crab’s relativistic pulsar wind becomes of order 0.1–2, with an outward increase. Finally, the halo plasma density and pressure are estimated to be (2–3) 3 10 24 cm 23 and 11 3 10 212 ergs cm 23 respectively, assuming that the halo has a line-of-sight extent of 50 kpc toward the off-lobe direction. This pressure appears comparable to the total lobe pressure (u m 1 u e ) 1 1 3 10 212 ergs cm 23 , suggesting that the lobes may be confined by the halo pressure, which in turn is confined by the gravity of NGC 1316. We thank S. A. Laurent-Muehleisen and E. D. Feigelson for information on the ROSAT results prior to publication. We also thank the members of the ASCA team for spacecraft operation and data acquisition.
REFERENCES Awaki, H., et al. 1994, PASJ, 46, L65 Cameron, M. J. 1971, MNRAS, 152, 439 Carilli, C. L., Perley, R. A., & Harris, D. E. 1994, MNRAS, 270, 173 Ekers, R. D., Goss, W. M., Wellington, K. J., Bosma, A., Smith, R. M., & Schweizer, F. 1983, A&A, 127, 361 Feigelson, E. D., Laurent-Muehleisen, S. A., Kollgaard, R. I., & Fomalont, E. B. 1995, ApJ, 449, L149 (FEA95) Feigelson, E. D., Wood, P. A., Schreier, E. J., Harris, D. E., & Reed, M. J. 1987, ApJ, 312, 101 Harris, D. E., Carilli, C. L., & Perley, R. A. 1994, Nature, 367, 713 Harris, D. E., & Grindlay, J. E. 1979, MNRAS, 188, 25 Ikebe, Y. 1995, Ph.D. thesis, Dept. of Physics, Univ. of Tokyo Ikebe, Y., et al. 1992, ApJ, 384, L5
Jones, C., et al. 1995, ApJ, submitted Kennel, C. F., & Coroniti, F. V. 1984, ApJ, 283, 694 Kohmura, Y., et al. 1993, Proc. SPIE, 2006, 78 Laurent-Muehleisen, S. A. 1995 private communication Laurent-Muehleisen, S. A., Feigelson, E. D., Kollgaard, R. I., & Fomalont, E. B. 1994, in The Soft X-Ray Cosmos, ed. E. M. Schlegel & R. Petre (New York: AIP), 418 Marshall, F. J., & Clark, G. W. 1981, ApJ, 245, 840 Morini, M., Anselmo, F., & Molteni, D. 1989, ApJ, 347, 750 Raymond, J. C., & Smith, B. W. 1977, ApJS, 35, 419 Shimmins, A. J. 1971, Australian J. Phys. Astrophys. Suppl., 21, 1 Tanaka, Y., Inoue, H., & Holt, S. S. 1994, PASJ, 46, L37 Yamauchi, S., Kawai, N., & Aoki, T. 1994, PASJ, 46, L109