Microscopy Microanalysis
Microsc. Microanal. 10, 425–434, 2004 DOI: 10.1017/S1431927604040140
AND
© MICROSCOPY SOCIETY OF AMERICA 2004
Determination and Correction of Position Detection Nonlinearity in Single Particle Tracking and Three-Dimensional Scanning Probe Microscopy Christian Tischer,1 Arnd Pralle,2 and Ernst-Ludwig Florin 1 * 1
Cell Biology and Biophysics Programme, European Molecular Biology Laboratory, Meyerhofstrasse 1, 69117 Heidelberg, Germany 2 Department of Molecular Cell Biology, University of California–Berkeley, Berkeley, CA 94720, USA
Abstract: A general method is presented for determining and correcting nonlinear position detector responses in single particle tracking as used in three-dimensional scanning probe microscopy based on optical tweezers. The method uses locally calculated mean square displacements of a Brownian particle to detect spatial changes in the sensitivity of the detector. The method is applied to an optical tweezers setup, where the position fluctuations of a microsphere within the optical trap are measured by an interferometric detection scheme with nanometer precision and microsecond temporal resolution. Detector sensitivity profiles were measured at arbitrary positions in solution with a resolution of approximately 6 nm and 20 nm in the lateral and axial directions, respectively. Local detector sensitivities are used to reconstruct the real positions of the particle from the measured position signals. Key words: single particle tracking ~SPT!, three-dimensional position detection, detection nonlinearities, optical tweezers, optical trap, thermal noise imaging, three-dimensional scanning probe microscopy, Brownian motion, local mean square displacement ~MSD!
I NTR ODUCTION Single particle tracking ~SPT! has become a widespread method in areas such as cell biology, soft condensed matter physics, and single molecule biophysics. It also forms a fundamental part of a novel three-dimensional scanning probe microscope based on optical tweezers ~Ashkin et al., 1986! that uses a trapped nanoparticle as a sensor to mechanically probe complex three-dimensional samples such as polymer networks ~Fig. 1; Tischer et al., 2001!. The power of SPT stems from the fact that the position of a single particle can be determined with extraordinary precision limited mainly by the signal-to-noise ratio of the detection scheme. Even though scattered or emitted light from the particle is used to determine its position, the diffraction limit does not apply in SPT because only the center position of a diffraction-limited spot has to be determined. This can be achieved either by calculating the center position of an image of the particle within the camera’s field of view or by measuring the position directly using a position-sensitive photodiode. Such detection schemes can
Received April 22, 2003; accepted July 30, 2003. *Corresponding author. E-mail:
[email protected]
yield subnanometer precision using visible or near-infrared light. Due to their wide applications, a plethora of particle tracking methods that differ in precision and bandwidth have been developed. Video particle tracking methods, using fluorescence or differential interference contrast ~DIC! imaging, are widespread methods because they are readily implemented in standard light microscopes ~Saxton & Jacobson, 1997!. Using wide field imaging, precise position measurements were achieved in one ~Denk & Webb, 1990!, two ~De Brabander et al., 1985!, and three dimensions ~Kao & Verkman, 1994; Gosse & Croquette, 2002; Speidel et al., 2003!. However, these methods are limited by the frame rate, produce an enormous amount of data, and require elaborate off-line computing. Most methods for fast and precise SPT are based on light scattering at dielectric particles in strongly localized electromagnetic fields ~Prieve & Frej, 1990; BarZiv et al., 1997; Gittes & Schmidt, 1998!, which feature steep intensity gradients and therefore produce sensitive position signals. One disadvantage of the strong localization is that it causes nonlinear responses and cross talk between the components of the position signals. This is also an issue in our three-dimensional opticaltweezers-based scanning probe microscope, which uses the forward scattered laser light from the trapped sensor particle to determine its position ~Fig. 2!. Beyond this, local
426
Christian Tischer et al.
Figure 1. Three-dimensional scanning probe microscopy based on optical tweezers. A: Schematic drawing of the experimental setup and the detection scheme. B: Example of three-dimensional thermal noise imaging in a polymer network ~agar network!. The sensor particle is trapped by a weak optical trap allowing the particle to explore its local environment by thermal position fluctuations. The thermal fluctuations are used in this particular implementation as “natural scanners” that randomly probe objects in the trapping volume. C: Thermal noise images are calculated from time series of three-dimensional position fluctuations of the sensor particle. The displayed surfaces are frequency isosurfaces, that is, positions at which the particle was found with the same frequency. Positions that are not accessible to the particle ~zero occupancy in the position frequency histogram! are occupied by the object. The small cube is 80 nm.
variations in index of refraction of the sample are a more general reason for distortions in the detector signal, because they result in changes in the intensity and in phase shifts of the scattered light used for interference-based position detection. For instance, optically dense nanostructures, such as cell cytoskeleton elements, can cause distortions of the detector signal that cannot be determined by independent reference measurements. Therefore, an in situ method is required that allows one to characterize the presence of detection signal distortions and provides means to correct them. In this study, we present a method that enables us to perform an in situ determination of detector nonlinearity in situations where the tracer particle diffuses in a medium with homogeneous viscosity. Under this assumption, the mobility of the particle is spatially invariant and provides a local calibration standard. Correction factors are then calcu-
lated for each position from the ratio of the measured to the theoretical diffusion constant. The spatial resolution of our method depends on the mobility of the particle and on the bandwidth of the position detector. Sufficient detector bandwidth is also essential to separate the free diffusive motion of the particle from drifts induced by optical or magnetic forces. The correct positions of the particle in the optical trap can be calculated using the measured local detector sensitivities. Using these corrected position measurements, we demonstrate that, in an optical trap, apparent deviations from a harmonic trapping potential are mainly due to detector nonlinearity. Finally, we would like to point out that the method presented is not restricted to optical detection, but can be used for any detection scheme with sufficient bandwidth and precision, and does not require any modification of the instrument.
Position Detection in Single Particle Tracking
Figure 2. Schematics of the three-dimensional position detection. The forward scattered laser light from the particle and the unscattered laser light are projected onto the quadrant photodiode ~QPD!. The resulting interference pattern on the QPD is sensitive to the position of the particle in the trap. The lateral position of the interference pattern corresponds to the lateral position of the particle in the trap, and the total intensity ~SZ! corresponds to its axial position.
M ATERIAL
AND
M ETHODS
Setup The experiments were performed with the photonic force microscope ~PFM; Florin et al., 1998; Rohrbach et al., 2003!, a scanning probe microscope based on optical tweezers with a detector for the determination of the three-dimensional position of the trapped particle ~Pralle et al., 1999!. A
427
1064-nm laser beam ~IRCL-1000-1064-S, CrystaLaser, USA! is expanded 203 by a telescope ~S6ASS2320/126, Sill Optics, Germany! attenuated by variable neutral-density filters and coupled into a custom-built inverted microscope frame ~EMBL, Germany!. An objective lens ~UPlanApo 603 NA1.2, Olympus, Japan! focuses the expanded laser beam through a coverslip to generate the optical trap. The position of the focus relative to the surface of the coverslip is controlled by piezotranslators ~Tritor 102 Cap, Piezosysteme Jena, Germany!. To measure the three-dimensional position of the particle inside the trap, the forward scattered laser light from the particle and the unscattered laser light are collected by a detection lens ~IR-Achroplan 633 NA0.9, Carl Zeiss, Germany! and projected onto a quadrant photo diode ~QPD; G6849, Hamamatsu Photonics, Japan! by a planoconvex lens with a focal length of 50 mm. The scattered and unscattered laser light generate an interference pattern on the QPD ~Fig. 2!. The resulting signals are fed into a custom-built preamplifier ~Öffner MSR-Technik, Germany!, which provides two differential signals, SX~t ! and SY~t !, and one signal that is proportional to the total light intensity, SZ~t !. For small displacements from the focal center, the differential signals from the QPD, SX~t ! and SY~t !, are proportional to the lateral displacements of the particle in the optical trap and the total signal SZ~t ! to the axial displacement. Custom-built differential amplifiers ~Öffner MSR-Technik, Germany! adjust the preamplifier signals for optimal digitization by the data acquisition board ~PCI6110, National Instruments, USA!. Figure 1 schematically shows this setup as used in three-dimensional scanning probe microscopy. Trapping experiments were performed exclusively on polystyrene beads ~Polybead polystyrene microspheres, Polysciences, USA! with a radius of 267 6 5 nm that were diluted by a factor of 10,000 in bi-distilled water without further modification. In all cases, a bead was trapped 10 mm above the surface of the coverslip and the QPD position signals were acquired for 5 s at 1 MHz.
Determination of Trap Stiffness Optical traps are often approximated as a superposition of three harmonic forces acting perpendicular to each other. Recent theoretical calculations support the validity of this approximation ~Rohrbach & Stelzer, 2002!. Thus, the trap can be characterized by spring constants k x and k y for the lateral and k z for the axial direction. These spring constants are determined from the autocorrelation functions of the position time traces of the Brownian movement of a bead within the trapping potential. The autocorrelation functions decay exponentially as e 2t/t with characteristic time constants tx 5 k x /g, ty 5 k y /g, and tz 5 k z /g. Because the viscous drag on a sphere with radius r in a solution with viscosity h is given by Stoke’s law g 5 6phr ~h ' 0.001 Ns/m 2 for water at 208C!, the decay times directly yield the spring constants ~Pralle et al., 1998!. In this study, two
428
Christian Tischer et al.
and further effects determining the shape of the PSDs can be found in Gittes and Schmidt ~1997!.
Calculation of Local Diffusion Constants A common way to measure the diffusion constant of a single Brownian particle is the calculation of its mean square displacement ~MSD! from a time series of position measurements. In one dimension, the MSD is given by ~Box et al., 1994! MSD~t ! [ ^~ x~t ' 1 t ! 2 x~t ' !! 2 & 5
Figure 3. Log-log plot of the normalized power spectral density of the QPD signals of the Brownian movement of a sphere in an optical trap. SX~t ! and SY~t ! are the differential signals, SZ~t ! is the sum signal. The two solid lines indicate the 1/f 2 decay of the PSD. Total acquisition time: 5 s; sampling rate: 1 MHz; trapping stiffness: k x ' 2.8 mN/m, k y ' 2.5 mN/m, and k z ' 0.42 mN/m; polystyrene sphere: r 5 267 nm.
different trapping laser powers were used: “strong trap” with approximately 10 mW in the focus, yielding k x ' 15 mN/m, k y ' 12 mN/m, and k z ' 1.6 mN/m ~used for data in Fig. 5! and “weak trap” with 2 mW, k x ' 2.8 mN/m, k y ' 2.5 mN/m, and k z ' 0.42 mN/m ~used for data in Figs. 3, 6, and 7!.
Noise and Bandwidth of the Position Detection System The method presented utilizes the random diffusion of a small suspended particle ~Brownian motion! as a calibration standard for the position detector. The frequency band governed by free diffusive motion can be identified in the power spectral density ~PSD! of the detector signals; it is inversely proportional to the square of the frequency and therefore identified as a linear decay in a log-log plot of the PSD. Figure 3 shows the PSDs of the three signals for a trapped sphere. The PSDs of the differential signals SX~t ! and SY~t ! appear linear in the log-log plot from approximately 2 to 200 kHz, whereas the PSD of the sum signal SZ~t ! appears linear from approximately 0.2 to 20 kHz. Therefore, these frequency bands can be used in our experiments for the analysis of the free diffusive motion of the trapped sphere. The reason for the plateau of the PSDs at low frequencies is the confinement of the particle motion by the optical trap. The deviation of the PSDs from a linear decay at high frequencies has several causes, including aliasing and laser intensity noise. Detailed discussions of these
1 N 2 t/dt
N2t /dt
(
~ x~idt 1 t ! 2 x~idt !! 2,
~1!
i51
where 1/dt is the sampling frequency and N is the total number of position measurements. For a freely diffusing particle, the MSD is directly proportional to t times the diffusion constant D ~Einstein, 1905!: MSD~t ! 5 2Dt. To measure the local diffusion constant around a given point x 0 within the trapping volume, the MSD is evaluated in an interval @x 0 2 dx, x 0 1 dx# . Because each interval within the trap is sampled by the particle only randomly, the local MSD has to be calculated from those parts of a time series that fall into this interval. We call this function MSDL for local MSD, and it is defined as MSDL ~ x 0 , t ! [
1 N
(
x 02dx,x ~t ' !,x 01dx
~ x~t ' 1 t ! 2 x~t ' !! 2. ~2!
The sum is over the square of all displacements with starting point in the interval of interest. N is the number of terms in the sum, which is equal to the number of times the particle visited the interval. This concept is readily extended to three dimensions where the MSDL is calculated from those parts of the times series in which the particle is found in a given volume element. For instance, to determine the MSDL in the volume element depicted in Figure 4A, only the colored parts of the time traces in Figure 4B would contribute. Formally, the MSDL for particle movements in the x direction within the volume element dV~r0 ! around r0 is given by MSDL ~r0 , t ! [
1 N
(
~ x~t ' 1 t ! 2 x~t ' !! 2,
~3!
r ~t ' ![dV ~ r0 !
where r~t ' ! 5 ~ x~t ' !, y~t ' !, z~t ' !! is the position of the particle at time t ' and N is the total number of visits in dV~r0 !. The local diffusion constant D is then given by MSDL ~r0 , t !/2t, which can be calculated for various time scales t. However, t is one factor that determines the spatial resolution of the measurement, because the particle on
Position Detection in Single Particle Tracking
429
Figure 4. Confined Brownian motion in an optical trap and local high-resolution single particle tracking. A: The optical trap confines the diffusion of the particle to the shaded region ~trapping volume! by exerting a force directed toward the center of the trap ~cross!. The particle explores the trapping potential by Brownian movement ~black solid line!. A volume element ]V~r0 ! within the trapping volume is frequently visited due to the confinement by the trap. B: Time series of particle position signals along the x, y, and z axes. The green and blue marked intervals correspond to visits of the same volume element but at different times as schematically indicated in A. The evaluation of the colored time traces yields the local mobility of the particle in the volume element dV~r0 !.
average explores a distance of Dx 5 6!2Dt. For instance, a 500-nm sphere moves on average about 3 nm in 5 ms in water at room temperature. The spatial resolution in the measurement of the local diffusion constant is therefore limited to !2Dt evaluated at the time lag t at which D is measured. A second factor limiting the spatial resolution is the size of the volume element dV~r0 !. Thus, there exists a trade-off between spatial resolution and accuracy, because decreasing the size of dV~r0 ! reduces the probability that the particle is found within this volume element and thereby reduces the number of points N available to calculate the MSDL . In general, this approach is especially useful for strongly confined particles, because the stronger the confinement, the more frequently each volume element is visited within a given time. The confinement can be due to an external force field such as an optical or magnetic trap or it can be caused by closed three-dimensional structures. If the three-dimensional position time trace of the particle is precisely known, the presented formalism could be used, for instance, to measure local changes in the viscosity of the medium in three dimensions and with nanometer resolution. However, this study focuses on using the concept of MSDL measurements for an improved recon-
struction of the position time traces from the measured signal time traces, as this is the precondition for any further investigations.
Determination of Local Detector Sensitivities The local detector sensitivity can be determined in a homogenous solution from the measured QPD signals SX~t !, SY~t !, and SZ~t !. For simplicity, we will discuss the formalism only for the x-axis. The experimental results will be given for all three dimensions. The key idea is to apply the MSDL described in the preceding section directly to the uncalibrated position time trace: MSD*L ~SX 0 , t ! [
1 N
(
SX 02dSX,SX ~t !,SX 01dSX
~SX~t ' 1 t ! 2 SX~t ' !! 2 . ~4!
This evaluation yields the mean square signal fluctuation in a small interval @SX 0 2 dSX, SX 0 1 dSX # around a given
430
Christian Tischer et al.
signal SX 0 . The star on MSDL denotes that the MSDL is determined from the uncalibrated signal time trace, and therefore has units of voltage 2 ~V 2 ! instead of area ~m 2 !. The signal SX 0 corresponds to a certain position x 0 of the particle within the optical trap. If the signal SX~t ! depended perfectly linearly on the position x ~t !, MSD*L ~SX 0 , t ! would be independent of SX 0 because temporal changes of the signal are caused by the particle motion that is independent of the position x 0 , given that the medium is homogenous. However, if there are nonlinearities in the detector response, MSD*L ~SX 0 , t ! will depend on SX 0 because the particle movements appear amplified or diminished in the signal time trace, depending on the respective slope of the signal as a function of the position. If the signal SX~t ! does not change abruptly as a function of the position x~t ! and the time lag t is sufficiently small, the difference between the two signals in the sum of equation ~4! can be approximated by SX~t ' 1 t ! 2 SX~t ' ! '
]SX ]x
6
~ x~t ' 1 t ! 2 x~t ' !!, ~5! x ~t ' !
that is, the change in the signal is the product of the local detector sensitivity at x~t ' ! and the position change during the time lag t ' . This relation can be used to relate the mean square signal fluctuations, MSD*L , to the local detector sensitivity: MSD*L ~SX 0 , t ! [
1 N
'
]x SX6SX0 N
(
SX 02dSX,SX ~t !,SX 01dSX
~SX~t ' 1 t ! 2 SX~t ' !! 2
( ~ x~t ' 1 t ! 2 x~t ' !! 2 5 ~]x SX6SX ! 2 2Dt. 0
R ESULTS Measurement of Local MSD in a Force Field on Different Time Scales A freely diffusing particle moves randomly due to the thermal motion of the molecules in the surrounding solution ~Brownian motion!. If the solution is homogenous, the MSDL is independent of the particle position and can be used as a calibration standard for the position detection system as described above. However, a particle in an optical trap experiences a trapping force F~ x!, causing an additional drift of the particle towards the trap center. The relative contribution of the trapping force to the motion of the particle depends on the timescale t and on the position x within the trapping potential. To demonstrate this effect, the position time traces of a sphere in a particularly “strong trap” ~see Materials and Methods! were evaluated. In Figure 5 the time lag dependence of the MSDL is shown in relation to the position autocorrelation time tx , which sets the time scale on which the trapping force causes the particle to return from a displaced position to the trap center. For times much longer than tx , the MSDL is constant and much smaller than for a free particle for both the displaced ~ x 0 5 35 nm! and the centered particle ~ x 0 5 0 nm!, because the optical trap confines the movement. The MSDL of the displaced particle is larger than that of the centered particle, because the drift to the trap center contributes to the MSDL . For a transient period comparable to the position autocorrelation time tx , the force-induced drift causes the MSDL of the displaced particle to be larger than that of a free particle. This is not the case for the centered particle, because here the net optical forces are zero and no additional drift is induced. For times much shorter than the position autocorrelation time, the movement of the sphere approaches that of a free particle independent of the position in the optical trap. This is due to the fact that, for short time lags t, the MSDL is approximated by
~6! Solving for ]x SX6SX0 finally yields the relation that allows one to compute the local detector sensitivity from the measured signal time trace:
]x SX6SX0 5
!
MSD*L ~SX 0 , t ! . 2Dt
~7!
In the derivation of equation ~6!, the averaged local mean square displacements were replaced by 2Dt, implying that the motion of the particle is primarily determined by free diffusion. This is a nontrivial assumption for a particle inside an optical trap, because the trapping force causes a position-dependent drift towards the trap center. The significance of this effect will be discussed in the next section.
MSDL ~ x, t ! ' 2Dt 1
1 F~ x! 2 t 2. g2
~8!
The relative force contribution ~RFC! of the force in the harmonic potential of an optical trap can therefore be quantified by the ratio of the “force-term” and the “diffusion-term”: RFC~ x, k x , t ! '
1 F~ x! 2 t 2/~2Dt! 5 k x2 x 2 t/~2k B Tg!, ~9! g2
where F~ x! has been replaced by 2k x x and D has been replaced by k B T/g. The RFC increases linearly with the time lag t at which the MSDL is determined. Thus, at sufficiently short time lags, the MSDL of a particle in a force field approximates that of a freely diffusing particle and is almost
Position Detection in Single Particle Tracking
431
Figure 5. Local mean square displacement ~MSDL ! along one axis of a sphere at two different positions in an optical trap, x 0 5 0 nm and x 0 5 35 nm, and on different time scales relative to the position autocorrelation time tx . The solid line is the theoretical MSD for free diffusion in the absence of trapping forces, that is, 2Dt. Total acquisition time: 5 s; sampling rate: 1 MHz; trapping stiffness: k x ' 14 mN/m; position autocorrelation time: tx ' 300 ms; polystyrene sphere: r 5 267 nm.
independent of the particle position. This allows one to use the MSDL as a calibration standard for the position detection system even in the presence of a force field. For the example in the next section, the maximal relative force contributions at the rim of the trap were: RFCx ~150 nm, 2.8 mN/m, 5 ms! ' 0.025 in the lateral direction and RFCz ~300 nm, 0.42 mN/m, 50 ms! ' 0.021 in the axial direction.
Measurement of Local Detector Sensitivities along x, y, and z in Solution To determine the local detector sensitivities, a bead was captured in a weak trap so that it could explore a large volume. The detector sensitivities were calculated using ]x SX6SX0 5
!
MSD*L ~SX 0 , t ! , 2Dt
]y SY 6SY0 5
!
MSD*L ~SY0 , t ! , 2Dt
]z SZ6SZ 0 5
!
MSD*L ~SZ 0 , t ! . 2Dt
~10!
For the calculation we chose a time lag t 5 5 ms for the lateral directions ~ x, y! and t 5 50 ms for the axial direction ~z!. These values ensured that the measured sensitivities are negligibly affected by the trapping forces on one hand and by instrument noise on the other hand. The signal-to-noise level along the optical axis was lower than along the lateral direction, and thus only a smaller bandwidth could be used ~see Fig. 3!. However, the axial force constant is also smaller, and therefore the force-induced drift does not contribute
significantly to the measured local mean square displacements ~see preceding section!. Figure 6A shows the measured detector sensitivities and the position signal histograms along each axis. Positions at the rim of the trap are less populated, resulting in an increased statistical noise in the determination of the local detector sensitivities. Because this statistical error is inversely proportional to the square root of the number of points in each bin, the accuracy can be increased by longer data acquisition. As shown in Figure 6A, the detection sensitivities along the x- and y-axes have their maximum at the trap center and decrease to about 90% of the maximum at the rim. Along the axial direction, the detector sensitivity decreases continuously from positions close to the geometrical focus towards the detector side by more than a factor of two. This behavior of the detector sensitivities in both the lateral and the axial direction is in agreement with theoretical predictions for Rayleigh scatterers ~Pralle et al., 1999! and for arbitrary spheres in arbitrarily focused beams ~Rohrbach et al., 2003!. Further, the maximal detector sensitivity is higher in the x direction ~;22 mV/nm! than in the y direction ~;19 mV/nm!, although both signals are identically amplified by the electronics. This is an effect of the linear polarization of the laser light, which introduces an asymmetry between x and y. This polarization effect is also the reason for the difference in the trapping stiffness in the x and y direction ~k x ' 2.8 mN/m, k y ' 2.5 mN/m; Rohrbach et al., 2003!.
Reconstruction of the Particle Positions from the Measured Local Detector Sensitivities In the previous section, we demonstrated the measurement of local detector sensitivities from a record of thermal position fluctuation signals. Here we proceed further and
432
Christian Tischer et al.
Figure 6. Determination and correction of position detector nonlinearities. A: Measured detector sensitivities ~circles! and position signal histograms ~crosses!. The detector sensitivities were calculated from the local MSD measurements at 5 ms ~SX and SY ! and 50 ms ~SZ!, respectively. B. Local mean square displacements ~circles! and position frequency histograms ~crosses! calculated from the corrected position time traces. The MSDL were calculated at 5 ms ~ x, y! and 50 ms ~z!, respectively. A Gaussian profile was fitted to the position histograms ~solid line!. Total acquisition time: 5 s; sampling rate: 1 MHz; trapping stiffness: k x ' 2.8 mN/m, k y ' 2.5 mN/m, and k z ' 0.42 mN/m; polystyrene sphere: r 5 267 nm.
show how the particle positions can be reconstructed from the local sensitivities. The detector sensitivity ]x SX is the derivative of the measured signal SX with respect to the position. The position can be therefore reconstructed by integration: ]x SX 5
5
dSX dSX ] dx 5 ] x~SX ! dx ]x SX
E
1 dSX ' 1 const. ]x SX6SX '
~11!
Using this formula and the previously measured detector sensitivity ]x SX for the x direction, and the respective ones
for y and z, the calibrated position traces were reconstructed from the detector signals SX~t !, SY~t !, and SZ~t !. The offset was chosen so that the origin of the coordinate system is at the trap center. From the resulting calibrated position time traces, position histograms and MSDL were calculated. As shown in Figure 6B, the MSDL are now independent of the position in the trap, demonstrating that the calibration worked properly. The corrected position histograms have Gaussian profiles, indicating that the approximation of a harmonic potential for an optical trap is appropriate in all three dimensions. Interestingly, although the shape of the uncalibrated axial signal histogram ~Fig. 6A, lower panel! is asymmetric, the corrected positions yield a symmetric Gaussian distribution. This distortion of the measured histogram is due to the strong increase in detection sensitivity toward
Position Detection in Single Particle Tracking
433
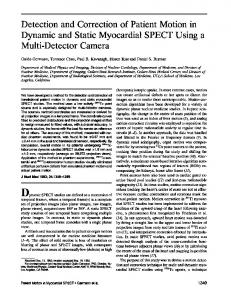
Figure 7. Quadrant photodiode signals along the x, y, and z axes as a function of the particle’s position. The dashed lines show the position signal obtained by scanning an immobilized particle through the focus as indicated in the insets. The solid lines show the reconstructed position signal using MSDL measured on the trapped particle in solution.
the geometrical focus, stretching the histogram. Consequently, a calibration of the z-signal ignoring the spatial variation of the detector sensitivity would result in an asymmetric position histogram, possibly leading to a wrong interpretation of the trapping potential as well as to a distortion of images of structures probed by thermal noise imaging.
Comparison of the Local Detector Sensitivities Measured in Solution and Scanned over an Immobilized Particle A standard method to calibrate single particle tracking detectors is to scan over a particle immobilized on a solid substrate ~“fixed particle scan”—FPS; see, e.g., Pralle et al., 1999!. Although widely used, FPS has the drawback that the detection response in solution, where the actual experiment is carried out, could differ from the detection response on the coverslip. Likely reasons for this are spherical aberrations of the lens system ~Hell & Stelzer, 1995! as well as optical effects at interfaces that arise from the direct contact of the particle with the coverslip ~Lukosz & Kunz, 1977; Enderlein et al., 1999!. We therefore tested how an FPS measurement compares to the detector sensitivities acquired by MSDL measurements in solution. The particle was trapped far from the coverslip and the thermal position fluctuations were recorded for 5 s with a bandwidth of 1 MHz. The detection sensitivities were determined as described above. Then, the particle was positioned on the coverslip and allowed to adsorb. The FPS signals were acquired by scanning the laser focus over the immobilized particle with the piezotranslators as indicated in the insets for Figure 7. The FPS reveals a detection signal that is linear in the center region. At larger displacements from the center, the slope decreases to zero followed by a change in sign. This decrease in the slope is the reason for the decrease in the lateral sensitivities shown in Figure 6A. The direct comparison of the FPS signal to the detector response that
was measured by MSDL shows that the FPS yields slightly higher detection sensitivity in the x- and y-directions, that is, the slope of the signal is steeper by a factor of approximately 1.1. As mentioned above, this discrepancy could be due to spherical aberrations, because the MSDL was measured in a distance of 10 mm from the coverslip, or due to specific effects of light scattering at interfaces ~Lukosz & Kunz, 1977; Enderlein et al., 1999!. The axial signals are in excellent agreement and clearly show that the trapped sphere approaches the nonlinear detection regime, causing the severe decrease in sensitivity as shown in Figure 6A, bottom.
S UMMARY
AND
D ISCUSSION
We have presented a general method that uses locally calculated mean square displacements of a Brownian particle to detect spatial changes in the sensitivity of a detector that measures the position of the particle. The method was applied to a microsphere in an optical trap, where the three-dimensional position was measured by an interferometric detection scheme. It was shown that the measured sensitivities can be used to correct the distorted position signals using the diffusion constant of the trapped particle as a calibration standard. This was readily possible because the particle was suspended in pure water with spatially invariant viscosity. Apparently, the position signal correction will be more difficult in nonhomogenous environments with space-dependent viscosity or viscous drag. The accuracy of the measurement of the local particle mobility by MSDL , and thus the accuracy of the position correction, increases with the number of position measurements at each resolved local volume element. Hence, the method is especially suitable for strongly confined particles because here diffusion of the particle is an efficient process to sample the whole volume that is covered by the position
434
Christian Tischer et al.
detection scheme. The time needed to sample larger volumes increases considerably because the average distance explored by diffusion increases only with the square root of time. The spatial resolution of MSDL measurements depends on a combination of the diffusion constant D of the particle and the detection bandwidth. The resolution is limited 21 by 2Dfmax , where fmax is the maximal rate at which the position of the particle can be precisely measured. For a microsphere with an diameter of 535 nm, we could precisely measure the position at least up to 200 kHz in the lateral ~ x, y! direction and up to 20 kHz in the axial ~z! direction, yielding a maximal spatial resolution in determining the MSDL of approximately 6 nm in the lateral direction and 20 nm in the axial direction in water at room temperature. In conclusion, MSDL measurements can be readily implemented in any SPT setup where the movements of the particle are confined to a certain volume and where the position detector operates at sufficiently high bandwidth. Moreover, MSDL does not require any extra reference measurements but can be applied in situ. This is particularly useful for SPT applications where calibration measurements on fixed particles are not possible due to complex environments such as in three-dimensional scanning probe microscopy ~Fig. 1!. We therefore expect MSDL measurements to become a standard method for calibrating fast high-resolution position detectors in single particle tracking.
!
A CKNOWLEDGMENTS We thank Alexander Rohrbach for helpful discussion, Dirk Neumayer for software development, and Alexander Jonas and Jim Swoger for carefully reading the manuscript.
R EFER ENCES Ashkin, A., Dziedzic, J.M., Bjorkholm, J.E. & Chu, S. ~1986!. Observation of a single-beam gradient force optical trap for dielectric particles. Opt Lett 11, 288. BarZiv, R., Meller, A., Tlusty, T., Moses, E., Stavans, J. & Safran, S.A. ~1997!. Localized dynamic light scattering: Probing single particle dynamics at the nanoscale. Phys Rev Lett 78, 154–157. Box, G.E.P., Jenkins, G.M. & Reinsel, G.C. ~1994!. Time Series Analysis: Forecasting and Control, 3rd ed., Upper Saddle River, NY: Prentice Hall. De Brabander, M., Geuens, G., Nuydens, R., Moeremans, M. & De Mey, J. ~1985!. Probing microtubule-dependent intracellular motility with nanometer particle video ultramicroscopy ~Nanovid ultramicroscopy!. Cytobios 43, 273–283.
Denk, W. & Webb, W.W. ~1990!. Optical measurement of picometer displacements of transparent, microscopic objects. Appl Opt 29, 2382–2391. Einstein, A. ~1905!. On the movement of small particles suspended in a stationary liquid demanded by the molecularkinetic theory of heat. Ann Phys 17, 549–560. Enderlein, J., Ruckstuhl, T. & Seeger, S. ~1999!. Highly efficient optical detection of surface-generated fluorescence. Appl Opt 38, 724–732. Florin, E.-L., Pralle, A., Stelzer, E.H.K. & Hörber, J.K.H. ~1998!. Photonic force microscope calibration by thermal noise analysis. Appl Phys 66, 75–78. Gittes, F. & Schmidt, C.F. ~1997!. Signals and noise in micromechanical measurements. In Methods in Cell Biology (Laser Tweezers in Cell Biology), Sheetz, M. ~Ed.!, pp. 129–154. Orlando, FL: Academic Press. Gittes, F. & Schmidt, C.F. ~1998!. Interference model for backfocal-plane displacement detection in optical tweezers. Opt Lett 23, 7–9. Gosse, C. & Croquette, V. ~2002!. Magnetic tweezers: Micromanipulation and force measurement at the molecular level. Biophys J 82, 3314–3329. Hell, S.W. & Stelzer, E.H.K. ~1995!. Lens aberrations in confocal fluorescence microscopy. In Handbook of Biological Confocal Microscopy, Pawley, J.B. ~Ed.!, pp. 347–354. New York: Plenum Press. Kao, H.P. & Verkman, A.S. ~1994!. Tracking of single fluorescent particles in three dimensions: Use of cylindrical optics to encode particle position. Biophys J 67, 1291–1300. Lukosz, W. & Kunz, R.E. ~1977!. Light emission by magnetic and electric diploes close to a plane interface. J Opt Soc Am 67, 1607–1615. Pralle, A., Florin, E.-L., Stelzer, E.H.K. & Hörber, J.K.H. ~1998!. Local viscosity probed by photonic force microscopy. Appl Phys 66, 71–73. Pralle, A., Prummer, M., Florin, E.-L., Stelzer, E.H.K. & Hörber, J.K.H. ~1999!. Three-dimensional high-resolution particle tracking for optical tweezers by forward scattered light. Microsc Res Tech 44, 123–134. Prieve, D.C. & Frej, N.A. ~1990!. Total internal reflection microscopy: A quantitative tool for the measurement of colloidal forces. Langmuir 6, 396. Rohrbach, A., Kress, H.K. & Stelzer, E.H.K. ~2003!. Threedimensional tracking of small spheres in focused laser beams: Influence of the detection angular aperture. Opt Lett 28, 411–413. Rohrbach, A. & Stelzer, E.H.K. ~2002!. Trapping forces, force constants and potential depths for dielectric spheres in the presence of spherical aberrations. Appl Opt 41, 2494–2507. Saxton, M.J. & Jacobson, K. ~1997!. Single-particle tracking: Applications to membrane dynamics. Annu Rev Biophys Biomol Struct 26, 373. Speidel, M., Jonás, A. & Florin, E.-L. ~2003!. Three-dimensional tracking of fluorescent nanoparticles with subnanometer precision by use of off-focus imaging. Opt Lett 28, 69–71. Tischer, C., Altmann, S., Fisinger, S., Hörber, J.K.H., Stelzer, E.H.K. & Florin, E.-L. ~2001!. Three-dimensional thermal noise imaging. Appl Phys Lett 79, 3878–3880.