Tarım Makinaları Bilimi Dergisi (Journal of Agricultural Machinery Science) 2011, 7 (1), 19-25
Determination of Some Soil Parameters with Electromagnetic Induction Sensor
1
Uğur YEGÜL1, Ufuk TÜRKER2, Babak TALEBPOUR3
Ankara University, Faculty of Agriculture, Department of Farm Machinery, 06110 Dışkapı/Ankara-TURKEY
[email protected] Received (Geliş Tarihi): 06.05.2011
Accepted (Kabul Tarihi): 09.07.2011
Abstract: This research was carried out in 5 da field in Haymana Research Center of Agricultural Faculty with 7 different apple varieties. The aim of this study was to determine relationship between soil electrical conductivity with some soil properties such as cation Exchange capacity, soil clay, soil silt, soil moisture content, field capacity and etc. Electromagnetic induction sensor was used known as EM38 which is working with electromagnetic principle. EM38 was connected to handheld field computer (Allegro CX) and to GPS receiver for needed location information data. EM38 sensor was used at a height of 20 cm from the ground, without contacting with soil. Electrical conductivity map of the field were developed from the data by using GIS based software. Soil physical and chemical properties of soil sampling points were analyzed statistically and its relationship with electrical conductivity was explored. In order to check the accuracy of the soil electrical conductivity values obtained from laboratory analyses were compared with the sensor readings for the same sampling points. With reference to result, high relationship was found between soil EC and sensor EC readings with r2= 0.89. Relationships were found between EC and SO4 with r2=0.83, EC and CEC with r2=0.74, EC and soil moisture content with r2=0.55; EC and Mg with r2=0.56; EC and clay content with r2=0.53; EC and sand content with r2=0.44; EC and wilting point with r2=0.42; EC and field capacity with r2=0.36; respectively. It can be concluded that EMI sensor is fast and very vesatile tool for soil electrical conductivity measurements as well as for some soil parameters. Results have shown that some of soil parameters such as CEC, SO4, moisture content and clay content can be determined with EMI sensors. Key words: Electrical conductivity, electromagnetic soil parameters, EM38-sensor
INTRODUCTION Applying the right amount of agricultural inputs at the right time and at the right place in the field is what many refer to as “precision agriculture.” To practice precision agriculture, the farmer must first have good field maps showing how much and where to apply the inputs across the field. A soil EC map does not identify how much change in inputs is needed across the field, but helps to quickly view the entire field’s soil differences and identify where soils change across the field. Precision agriculture is a production system that promotes variable management practices within a field, according to site conditions. This system is based on new tools and sources of information provided by modern technologies. These include the
global positioning system (GPS), geographic information systems (GIS), yield monitoring devices, soil, plant and pest sensors, remote sensing, and variable-rate technologies for applicators of inputs. Soil electrical conductivity, which is known as EC, is the ability of soil to conduct electrical current. EC is expressed in milliSiemens per meter (mS/m). The apparent soil electrical conductivity (ECa) is a soil parameter that is used increasingly in precision agriculture (King et al., 2001; Lund et al., 1998). It can be determined relatively easily on farmland using appropriate measuring devices such as the Geonics EM38 instrument. A high measuring rate of more than 100 ha per day is achievable and more than 100 individual location-tagged values can be recorded per 19
Determination of Some Soil Parameters with Electromagnetic Induction Sensor
hectare. The EM38 (Geonics Limited, Canada) does not need any direct ground contact for the soil measurements, so that measurements can also be conducted on cultivated fields. The level of the measurement signal for soil electrical conductivity depends on the soil porosity, soil moisture content, concentration of dissolved electrolytes in the moisture contained in the soil, soil temperature, and the amount and composition of colloids (cation exchange capacity) (McNeill, 1980a). Electrical conductivity signal primarily reflects soil moisture content and cation exchange capacity. The fact that maps of soil electrical conductivity can be interpreted as maps showing variations in soil clay content explains the strong interest shown in this measurement for precision agriculture. The textural properties of a soil are directly or indirectly critical for recommendations concerning soil cultivation, sowing, base fertilising and the first nitrogen application. (Domsch et al., 1999; James et al., 2000). MATERIALS and METHOD Study site This research was carried out in 5 da field with 7 different apple varieties that located in Haymana Research and Application Center of Agricultural Faculty of Ankara University. The Soil texture is clay.
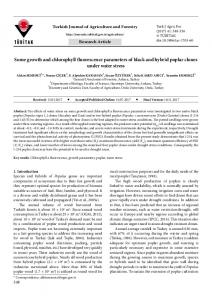
Figure 1. Map showing the satellite image
Electromagnetic induction sensor (EM38) The EM38 is about 1 m long and is light-weight enough to be carried in one hand. The unit is powered by a single 9 volt battery that lasts approximately 16 to 20 hours (Davis et. al., 1997). Apparent soil electrical conductivity can be measured remotely with EM38. An EM transmitter coil located at one end of the instrument induces circular eddy-current loops in the soil. The magnitude of these loops is directly proportional to the EC of the soil in 20
the vicinity of that loop. Each current loop generates a secondary electromagnetic field that is proportional to the value of the current flowing within the loop. A fraction of the secondary induced electromagnetic field from each loop is intercepted by the receiver coil of the instrument, and the sum of these signals is amplified and formed into an output voltage, which is related to a depth-weighted bulk soil EC, ECa. The receiver coil measures amplitude and phase of the secondary magnetic field. The amplitude and phase of the secondary field will differ from those of the primary field as a result of soil properties (e.g., clay content, water content, and salinity), spacing of the coils and their orientation, frequency, and distance from the soil surface (Hendrickx and Kachanoski, 2002). The EM38 has an intercoil spacing of 1 m, which results in a penetration depth of roughly 0.75 and 1.5 m in the horizontal and vertical dipole orientations, respectively. The EM38 has had considerably greater application for precision agriculture because the root zone extends roughly to 1.5 m. A detailed discussion of the equipment and its operation can be found in Hendrickx and Kachanoski (2002). The EM-based ECa sensor most often used in agriculture is the EM38 (Geonics Limited, Mississauga, ON, Canada). Details of the EM-sensing approach are given by McNeill (1980, 1992). The EM38 is a lightweight bar and was initially designed to be carried by hand and provide stationary ECa readings. To implement mobile data acquisition with this unit, it is necessary to assemble a data collection system, including a cart or sled to transport the sensor, a tow vehicle, a data collector or computer, an analog-to-digital converter, and a GPS receiver (e.g., Jaynes et al., 1993; Cannon et al., 1994; Sudduth et al., 2001). The EM38 requires the user to complete a daily calibration procedure before use. Changes in ambient conditions such as air temperature, humidity, and atmospheric electricity (spherics) can affect the stability of EM38 measurements. EM38 system is adaptable to a wide variety of data collection conditions. This lightweight system requires little power and makes it possible to collect data under wet or soft soil conditions. EM surveys are conducted by introducing electromagnetic energy into geological materials using a current source that passes over the Earth’s surface but does not make physical contact. A sensor in the device measures the resulting electromagnetic field
Uğur YEGÜL, Ufuk TÜRKER, Babak TALEBPOUR
that this current induces. The strength of this secondary electromagnetic field is directly proportional to the EC of the soil. Handheld field computer The Allegro CX desing as ergonomic, lightweight. This design makes Allegro easy to use for extended periods while moving to and from data collection sites in the field. EM38 was connected to handheld field computer (Allegro CX) and to GPS receiver. Handheld field computer stored EC values and geographical information data. (http://www.junipersys.com/, 2010) GPS Receiver SporTrak Color GPS Mapping Receiver connected to EM38 and handheld field computer. Handheld GPS receiver prodived GPS geographical information data. (http://www.magellangps.com/, 2010) Penetrologger The penetrologger consists of: the penetrologger with force sensor, a bi-partiteprobing rod, a cone, the depth reference plate, a communication port and a GPS antenna. The cone is screwed on the probing rod, which is connected with a quick coupling to the force sensor on the penetrologger. Now the cone is pushed slowly and regularly into the soil. The depth reference plate, which is on the soil surface, reflects the signals of the ultrasonic sensor, which results in a very accurate depth measurement. The depth reference plate is also used to reflect the signals which are used to control the penetration speed. The measured resistance to penetration and the GPS coordinates are stored in the internal logger of the penetrologger. Depending on the application and the expected resistance to penetration, various cones can be connected to the probing rods. Optional is the possibility of soil moisture measurement with an external soil moisture sensor (1 measurement per penetration). The penetrologger is capable of directly storing and processing the measurements from 1000 penetrations something that makes the instrument particularly suitable when a large number of measurements are needed. The penetrologger has a built-in monitor of the penetration speed (downward pressure that is too quick or bumpy gives results that are not representative of the soil). The method is very accurate and has a large measuring range. The penetrologger can be used in civil engineering, soil
science, agriculture, sports field maintenance and park and public garden management. Penetrologger was connected to PC and stored data was transfered. (http://www.eijkelkamp.com/, 2010) Study Fields Data were collected on Haymana Research and Application Center field. The EM sensor used in this research (Geonics EM38) has a spacing of 1 m between the transmitting coil located at one end of the instrument and the receiver coil at the other end. Calibration controls and a digital readout of ECa in millisiemens per meter (mS/m) are included, and an analog data output allows data to be recorded on a handheld field computer. The EM38 was operated in the vertical dipole mode providing an effective measurement depth of approximately 1.5 m. The EM38 was combined with a data acquisition computer and handheld GPS system. This sensor is approximately one meter in lenght and three and a half kilograms in weight which is light enough to carry with one hand. For this reason, measurements were made by hand. Data were recorded on a 1 second interval, corresponding to a 1-m data spacing. 1254 individual ECa measurements were obtained but 490 ECa measurements used. Data obtained by GPS were associated with each sensor reading to provide positional information with an accuracy of 1.5 m or better. Soil cores were taken at 0.1-m increments to a depth of 0.3 m. A total of 12 soil samples were taken. Soil resistance and moisture contents were measured from 35 different location at the field near root region of trees by a penetrologger and moisture meter.
Figure 2. Showing map of raw EC spots taken by EM38
21
Determination of Some Soil Parameters with Electromagnetic Induction Sensor
Figure 5. Showing soil cores taken by field
EC map creation
Figure 3. EM38 soil conductivity and soil samples EC conductivity maps, respectively
Figure 4. Showing soil samples taken by field with penetrologger
22
The data are recorded in a file and stored on a PCMCIA card. An EC data file from the EM38 has three columns. The first and second columns contain longitude and latitude information. The third column contain EC data. A software program is needed to create an EC map. There are different software programs available on the market that can create maps from datapoint files such as, Surfer (GoldenSoftware, Inc.), ArcView (ESRI), and Global Mapper (Global Mapper). All spatial data were entered into a GIS using the commercial software ESRI ArcGIS 9.3.1. (ESRI, 2010). Maps of the soil resistance and soil physico-chemical properties were prepared by interpolating the measurements at the 12 sample sites values and 35 diffrent spot using inverse distance weighting (IDW), respectively. At this particular study site, IDW was selected as the preferred method of interpolation because it was consistently more accurate than kriging based on the use of the mean squared error as the main criterion when comparing measured to predicted values for the majority of physicochemical properties. Maps of ECa measurements were also prepared. Stored data were transferred PC from handheld filed computer by the help with bluetooth. These data extension were .R38. In order to process these data which Dat38W software used. These processed data extension were .G38. These data was opened with wordpad and saved with extension of .txt. These extension of .txt data were prepared with Microsoft Office Excel. As an and these prepared data were converted to soil EC and soil properties maps with GIS based software. This software was ESRI ArcgGIS.
Uğur YEGÜL, Ufuk TÜRKER, Babak TALEBPOUR
Clay
EC
%
Sand
EC
Mg
Silt SO4
Figure 6. Showing EC (mS/m), clay content, sand content, and silt content maps, respectively
F.C.
Clay
WP
Figure 7. Showing clay content, field capacity and, wilting point, respectively
CEC
Figure 8. Showing EC (mS/m), Mg content, SO4 content, and CEC values, respectively
Statistical analysis Soil physical and chemical properties of soil sampling points were analyzed statistically and its relationship with electrical conductivity was explored. In order to check the accuracy of the soil electrical conductivity values obtained from laboratory analyses were compared with the sensor readings for the same sampling points. These explored soil properties were SO4, CEC, soil moisture content, Mg, clay content, sand content, wilting point, field capacity and soil EC and sensor EC readings. Soil parameters and sensor Ec readings were analysed for evaluating correlations between parameters by lineer analyses method in excel. RESULTS and DISCUSSION With reference to result, high relationship was found between soil EC and sensor EC readings with r2= 0.89. Relationships were found between EC and SO4 with r2=0.83, EC and CEC with r2=0.74, EC and soil moisture content with r2=0.55; EC and Mg with r2=0.56; EC and clay content with r2=0.53; EC and sand content with r2=0.44; EC and wilting point with r2=0.42; EC and field capacity with r2=0.36; respectively. Similar results can be seen by number of researcher studies.
23
Determination of Some Soil Parameters with Electromagnetic Induction Sensor
Cinthia (2001) made studies on this issue and
southern half of the study area. Strong correlation
found that bulk density, percentage clay, EC1:1, and
was obtained between ECa and the soil properties of
pH were positively correlated with ECa; all other soil
the saturation extract (ECe; Cl−, HCO3−, SO42−, Na+,
parameters and surface residue mass were negatively correlated. With regard to Hartsock (2000), soil electrical conductivity was positively related to soil Ca (r2=0.59; Shelby Co.) and Mg (r2 = 0.56; Shelby Co.) and soil moisture (r2=0.72, across locations), and inversely related to depth to a clay increase (r2=0.38, Hardin Co.; r2 = 0.27, r2 = 0.66 Shelby Co.), depth to 2
bedrock (r
= 0.33, Shelby Co.), and depth to
fragipan (r = 0.80, Shelby Co). Domsch (2004) in his work found that, the of
determination
properties were poorly correlated, including: volumetric water content, bulk density, percent clay, saturation percentage, exchangeable sodium percentage, Mo, CaCO3, gypsum, total N, Ca2+ in the saturation extract, and exchangeable cations (K+, Ca2+, and Mg2+). Weiterman found that (2002), in 1999 these values were regressed with the EM38 readings to yield a soil moisture map. There was an excellent
2
coefficient
K+, and Mg2+), exchangeable Na+, and SAR. Other
for
the
correlation of 0.96 at this time.
regression
function between weighted clay content and EC was
CONCLUSIONS
0.55. A factor score comprising weighted clay and silt
High relationship was found between soil EC and
2
contents showed a closer connection with the EC (R
sensor EC readings with r2= 0.89. Relationships were
= 0.67). This means that the weighted silt content
found between EC and SO4 with r2=0.83, EC and CEC
also influenced soil electrical conductivity.
with r2=0.74. ECe
It can be concluded that EMI sensor is fast and
(electrical conductivity of the saturation extract)
very versatile tool for soil electrical conductivity
varying from 4.83 to 45.3 dS/m, SAR (sodium
measurements. Results have shown that some of soil
According to Corwin and Lesch
(2005),
adsorption ratio) from 5.62 to 103.12, and clay
parameters such as CEC, SO4, moisture content and
content from 2.5 to 48.3%. Spatial trends showed
clay content can be determined with EMI sensors
high areas of salinity and SAR in the center of the
electrical conductivity readings.
REFERENCES http://www.esri.com/software/arcgis/index.html, 2010. http://www.geonics.com/, 2010. http://www.junipersys.com/, 2010. http://www.magellangps.com/, 2010. http://www.eijkelkamp.com/, 2010. Cannon, M.E., R.C. McKenzie, and G. Lachapelle. 1994. Soil salinity mapping with electromagnetic induction and satellite-based naviga tion methods. Can. J. Soil Sci. 74:335–343. Cinthia K. J., Doran J. W., Duke H. R., Wienhold B. J., Eskridge K. M., and Shanahan J. F. 2001. Field-Scale Electrical Conductivity Mapping for Delineating Soil Condition, Soil Sci. Soc. Am. J., Vol. 65, NovemberDecember 2001. Corwin, D.L., Lesch, S.M. 2005. Characterizing soil spatial variability with apparent soil electrical conductivity Part II. Case study, 46, p. 135-152. Davis, J. G., Kitchen, N. R., Sudduth, K. A., Drummond, S. T. 1997. Using Electromegnatic Induction to Characterize Soils. Better Crops and Plant Food. No. 4. Potash and Phosphate Institute. Domsch H., Giebel A. 2004. Estimation of Soil Textural Features from Soil, Electrical Conductivity Recorded Using the EM38, Institute of Agricultural Engineering
24
Bornim, 14469 Potsdam, Germany, Precision Agriculture, 5, 389–409, 200. Domsch, H. and Kuhn, R. 1999. Use of the global positioning system to determine field loading by transport vehicles. In: Proceedings of the International Workshop Agricultural Transport, edited by G. Weise (Justus-Liebig Universita¨ t Giessen, Germany), pp. 39–49. Hartsock, N. J., Mueller T. G., Thomas G. W., Barnhisel R. I., Wells K. L. and Shearer S. A., Robert P.C. et al. 2001. Soil Electrical Conductivity Variability, Proc. 5th International Conference on Precision Agriculture. ASA Misc. Publ., ASA, CSSA, and SSSA, Madison,WI, 2000. Hendrickx, J.M.H., andR.G.Kachanoski. 2002. Indirectmeasurement of solute concentration: Nonintrusive electromagnetic induction. p. 1297–1306. In J.H. Dane and G.C. Topp (ed.) Methods of soil analysis. Part 4. SSSA Book Ser. 5. SSSA, Madison, WI. James, I. T., Waine, T. W., Bradley, R. I., Godwin, R. J. and Taylor, J. C. 2000. A comparison between traditional methods and EMI scanning for determining soil textural boundaries. AGENG 2000, Paper 00-PA-014, Warwick, UK. Jaynes,D.B., T.S.Colvin, and J.Ambuel. 1993. Soil type and crop yield determinations from ground conductivity surveys. ASAE Paper 933552. ASAE, St. Joseph, MI.
Uğur YEGÜL, Ufuk TÜRKER, Babak TALEBPOUR King, J. A., Dampney, P. M. R., Lark, M., Mayr, T. R. and Bradley, R. I. 2001. Sensing soil spatial variability by electro-magnetic induction (EMI): Its potential in Precision Farming. In: Proceedings of Third European Conference on Precision Agriculture, edited by G. Grenier and S. Blackmore, (agro Montpellier, France), pp. 419–424. Lund, E. D., Colin, P. E., Christy, D. and Drummond P. E., 1998. Applying soil electrical conductivity technology to Precision Agriculture. In: Proceedings of the fourth International Conference on Precision Agriculture, edited by P. C. Robert, R. H. Rust and W. E. Larson, (ASACSSA-SSSA, Madison, WI, USA), pp. 1089–1100. McNeill, J.D. 1980a. Electrical conductivity of soils and rocks (Geonics Ltd., Mississauga, Ontario, Canada, Technical Note TN-5).
McNeill, J.D. 1980. Electromagnetic terrain conductivity measurement at low induction numbers. Tech. Note TN6. Geonics Limited. Mississauga, ON, Canada. McNeill, J.D. 1992. Rapid, accuratemapping of soil salinity by electro magnetic ground conductivity meters. p. 209– 229. In Advances in measurement of soil physical properties: Bringing theory into practice. SSSA Spec. Publ. 30. SSSA, Madison, WI. McNeill, J. D. 1980b. Electromagnetic terrain conductivity measurement at low induction numbers. (Geonics Ltd., Mississauga, Ontario, Canada, Technical Note TN-6). Sudduth, K.A., S.T. Drummond, and N.R. Kitchen. 2001. Accuracy issues in electromagnetic induction sensing of soil electrical conductivity for precision agriculture. Comput. Electron. Agric. 31:239 264.
25