and getLatestInformationWithImage is a list of Ship objects. .... exCallsign Ship station formerly assigned this call sign. ...... equipment model designation, trade name, military project code name, geographic location may also be included.
Copy No. _____ Defence Research and Development Canada
Recherche et développement pour la défense Canada
DEFENCE
&
DÉFENSE
Determining the consistency of information between multiple systems used in maritime domain awareness Marie-Odette St-Hilaire OODA Technologies Inc. Prepared by: OODA Technologies Inc. 4891 Av. Grosvenor Montreal, QC H3W 2M2
Project Manager: Anthony W. Isenor, 902-426-3100 ext. 106 Contract Number: W7707-098207 Contract Scientific Authority: Anthony W. Isenor, 902-426-3100 ext. 106
The scientific or technical validity of this Contract Report is entirely the responsibility of the contractor and the contents do not necessarily have the approval or endorsement of Defence R&D Canada.
Defence R&D Canada – Atlantic Contract Report DRDC Atlantic CR 2010-025 July 2010
This page intentionally left blank.
Determining the consistency of information between multiple systems used in maritime domain awareness Marie-Odette St-Hilaire
Prepared by: OODA Technologies Inc. 4891 Av. Grosvenor, Montreal Qc, H3W 2M2 Project Manager: Anthony W. Isenor 902-426-3100 Ext. 106 Contract Number: W7707-098207 Contract Scientific Authority: Anthony W. Isenor 902-426-3100 Ext. 106
The scientific or technical validity of this Contract Report is entirely the responsibility of the contractor and the contents do not necessarily have the approval or endorsement of Defence R&D Canada.
Defence R&D Canada – Atlantic Contract Report DRDC Atlantic CR 2010-025 July 2010
Principal Author
Original signed by Marie-Odette St-Hilaire Marie-Odette St-Hilaire Approved by
Original signed by Francine Desharnais Francine Desharnais Head/Maritimes Information and Combat Systems Section Approved for release by
Original signed by Ron Kuwahara for Calvin Hyatt Head/Document Review Panel
c Her Majesty the Queen in Right of Canada as represented by the Minister of National
Defence, 2010 c Sa Majest´e la Reine (en droit du Canada), telle que repr´esent´ee par le ministre de la
D´efense nationale, 2010
Abstract Multiple public web sites can be used to obtain ship-related information that is relevant to maritime domain awareness (MDA). However, the quality or timeliness of this information can be suspect. In this work, a software application, called the consistency application, is developed for the cross comparison of ship-related information from multiple data sources. The consistency application allows a researcher to cross compare the information from these multiple data sources and generate a comparison score for the source specific ship information and also for the data source as a unit. This allows the researcher to assess the consistency of the information provided from the data source as compared to other sources. The consistency application presently links the Automated Ship Image Acquisition (ASIA) system and the SeaSpider application. Information from the International Telecommunication Union is also utilized as both a data source and a means to identify single ship entities.
´ Resum e´ De multiples sites Web publics fournissent des renseignements sur les navires. Cette information a trait a` la connaissance de la situation maritime (CSM). Toutefois, la qualit´e et l’actualit´e de cette information ne sont pas assur´ees. Le pr´esent document d´ecrit une application logicielle de v´erification de la coh´erence qui a e´ t´e d´evelopp´ee dans le but de comparer des donn´ees sur les navires provenant de multiples sources. Cette comparaison permet a` l’application de v´erification de la coh´erence de g´en´erer une cote pour les renseignements sur chaque navire et pour les sources de donn´ees elles-mˆemes. L’utilisateur est donc en mesure d’´evaluer la coh´erence des renseignements provenant d’une source de donn´ees par rapport a` d’autres. L’application de v´erification de la coh´erence se connecte actuellement au syst`eme d’acquisition d’images de navires (ASIA) et a` l’application SeaSpider. Les renseignements provenant de l’Union internationale des t´el´ecommunications constituent e´ galement une source de donn´ees et servent aussi a` identifier les navires.
DRDC Atlantic CR 2010-025
i
This page intentionally left blank.
ii
DRDC Atlantic CR 2010-025
Executive summary Determining the consistency of information between multiple systems used in maritime domain awareness Marie-Odette St-Hilaire; DRDC Atlantic CR 2010-025; Defence R&D Canada – Atlantic; July 2010.
Background: The collection of data and information to support Maritime domain awareness (MDA) can take on many forms. In the Maritime Information and Knowledge Management group at DRDC Atlantic, the Automated Ship Image Acquisition System (ASIA) acquires photographs of ships as they transit the narrows of Halifax Harbour. The SeaSpider application supports MDA via the accumulation of web-based information on ship routes. A cross-comparison of the information available from the two data sources enables an assessment of the information consistency. Results: Software known as the consistency application was constructed under contract by OODA Technologies over a period of seven months, in support of the Applied Research Project 11HL Technologies for Trusted Maritime Situational Awareness. The consistency application provides a means for the cross comparison of information from multiple data sources, each providing ship-related information applicable to MDA. Ships are geo-located in a Google Earth display in a common web browser, using the positional information from one of the designated data sources. The available ship information is compared across the data sources and a simple score of consistency is provided for the ship information. Significance: Ship related information from public web based systems may be acquired from multiple web sites. The consistency application allows a researcher to cross compare the information from multiple data sources and generate a comparison score for the individual ship information and also for the data sources as a unit. Such a score allows the researcher to assess the capability of the data source to provide meaningful information for MDA purposes. This will allow the identification of those sources that provide the most reliable information for MDA purposes. Future Plans: The intent is to include additional data sources in the consistency application. This will increase the data available for cross comparison. Other data sources may include the Raw AIS Repository (RAISR), also developed at DRDC Atlantic, which would provide a more global coverage of ship positions. It is anticipated that external sources will include additional ship photographs.
DRDC Atlantic CR 2010-025
iii
Sommaire Determining the consistency of information between multiple systems used in maritime domain awareness ´ Marie-Odette St-Hilaire ; DRDC Atlantic CR 2010-025 ; R & D pour la defense Canada – Atlantique ; juillet 2010.
Contexte : La collecte de donn´ees et de renseignements en appui a` la connaissance de la situation maritime (CSM) prend de nombreuses formes. Au sein du groupe de gestion de l’information et du savoir maritimes (GISM), le syst`eme d’acquisition automatis´ee d’images de navires (ASIA) prend des photos des navires qui franchissent le passage du port d’Halifax. L’application SeaSpider appuie la CSM en accumulant des renseignements Web sur les itin´eraires des navires. La comparaison des renseignements disponibles dans les deux sources de donn´ees permet d’´evaluer la coh´erence de l’information. R´esultats : Le logiciel connu sous le nom d’application de v´erification de la coh´erence a e´ t´e d´evelopp´e dans le cadre d’un contrat de sept mois accord´e a` OODA Technologies en appui au projet de recherche appliqu´ee 11HL : Technologies assurant la fiabilit´e de la connaissance de la situation maritime. L’application de v´erification de la coh´erence permet de comparer des renseignements pertinents pour la CSM provenant de multiples sources de donn´ees sur les navires. Les navires sont g´eolocalis´es sur un affichage Google Earth dans un navigateur Web en fonction des renseignements de positionnement provenant d’une des sources de donn´ees. Les renseignements disponibles sur les navires provenant des diverses sources sont compar´es et une cote de coh´erence simple est g´en´er´ee. Importance : Les renseignements sur les navires peuvent provenir de multiples sites Web publics. Celle-ci permet de comparer les renseignements de multiples sources de donn´ees et de g´en´erer une cote pour les renseignements sur chaque navire et pour les sources de donn´ees elles-mˆemes. Les chercheurs sont donc en mesure d’´evaluer la capacit´e d’une source de donn´ees a` fournir des renseignements pertinents aux objectifs de la CSM, ce qui permet de d´eterminer les sources qui fournissent les renseignements les plus fiables. Perspectives : Nous pr´evoyons ajouter d’autres sources de donn´ees a` l’application de v´erification de la coh´erence. La quantit´e de donn´ees susceptibles d’ˆetre compar´ees sera ainsi accrue. Les autres sources de donn´ees qui pourraient eˆ tre utilis´ees comprennent le r´epertoire de donn´ees brutes du syst`eme d’information automatis´e (Raw AIS Repository RAISR), lui aussi d´evelopp´e a` RDDC Atlantique, qui fournirait des renseignements plus g´en´eraux sur la position des navires. On pr´evoit que les sources externes comprendront d’autres photographies des navires.
iv
DRDC Atlantic CR 2010-025
Table of contents Abstract . . . . . . . . . . . . . . . . . . . . . . . . . . . . . . . . . . . . . . . . .
i
R´esum´e . . . . . . . . . . . . . . . . . . . . . . . . . . . . . . . . . . . . . . . . .
i
Executive summary . . . . . . . . . . . . . . . . . . . . . . . . . . . . . . . . . . . iii Sommaire . . . . . . . . . . . . . . . . . . . . . . . . . . . . . . . . . . . . . . . .
iv
Table of contents . . . . . . . . . . . . . . . . . . . . . . . . . . . . . . . . . . . .
v
List of figures . . . . . . . . . . . . . . . . . . . . . . . . . . . . . . . . . . . . . .
ix
1
Scope . . . . . . . . . . . . . . . . . . . . . . . . . . . . . . . . . . . . . . . .
1
2
Data Sources . . . . . . . . . . . . . . . . . . . . . . . . . . . . . . . . . . . .
3
2.1
ASIA Data Source . . . . . . . . . . . . . . . . . . . . . . . . . . . . . .
3
2.1.1
ASIA Web Service . . . . . . . . . . . . . . . . . . . . . . . . .
3
2.1.1.1
Operations . . . . . . . . . . . . . . . . . . . . . . . .
4
2.1.1.2
Data Model . . . . . . . . . . . . . . . . . . . . . . .
4
SeaSpider Data Source . . . . . . . . . . . . . . . . . . . . . . . . . . . .
5
2.2.1
SeaSpider Web Service . . . . . . . . . . . . . . . . . . . . . . .
5
2.2.1.1
Operations . . . . . . . . . . . . . . . . . . . . . . . .
5
2.2.1.2
Data Model . . . . . . . . . . . . . . . . . . . . . . .
6
International Telecommunication Union (ITU) Data Source . . . . . . . .
7
2.3.1
ITU Application . . . . . . . . . . . . . . . . . . . . . . . . . .
7
2.3.1.1
Interaction with ITU Website . . . . . . . . . . . . . .
8
2.3.1.2
Database . . . . . . . . . . . . . . . . . . . . . . . . .
9
2.2
2.3
2.3.2
ITU Web Service . . . . . . . . . . . . . . . . . . . . . . . . . . 10 2.3.2.1
Operations . . . . . . . . . . . . . . . . . . . . . . . . 10
2.3.2.2
Data Model . . . . . . . . . . . . . . . . . . . . . . . 11
DRDC Atlantic CR 2010-025
v
3
Consistency Application Architecture . . . . . . . . . . . . . . . . . . . . . . . 13 3.1
3.2
4
5
6
Main Components . . . . . . . . . . . . . . . . . . . . . . . . . . . . . . 13 3.1.1
Data Source Clients . . . . . . . . . . . . . . . . . . . . . . . . . 13
3.1.2
Vocabulary Solution . . . . . . . . . . . . . . . . . . . . . . . . 15
3.1.3
CA Manager . . . . . . . . . . . . . . . . . . . . . . . . . . . . 16
3.1.4
CA Parameters . . . . . . . . . . . . . . . . . . . . . . . . . . . 16
3.1.5
Ship Matching . . . . . . . . . . . . . . . . . . . . . . . . . . . 17
3.1.6
Consistency Check . . . . . . . . . . . . . . . . . . . . . . . . . 17
Flow of Information . . . . . . . . . . . . . . . . . . . . . . . . . . . . . 17 3.2.1
Flow In . . . . . . . . . . . . . . . . . . . . . . . . . . . . . . . 17
3.2.2
Flow Out . . . . . . . . . . . . . . . . . . . . . . . . . . . . . . 20
Vocabulary Solution . . . . . . . . . . . . . . . . . . . . . . . . . . . . . . . . . 23 4.1
Approach Justification . . . . . . . . . . . . . . . . . . . . . . . . . . . . 23
4.2
Alignment of Data Entering the Consistency Application . . . . . . . . . 25
4.3
Alignment of Data Exiting the Consistency Application . . . . . . . . . . 27
Ship Matching . . . . . . . . . . . . . . . . . . . . . . . . . . . . . . . . . . . . 28 5.1
Authoritative Source . . . . . . . . . . . . . . . . . . . . . . . . . . . . . 28
5.2
Comparison Group . . . . . . . . . . . . . . . . . . . . . . . . . . . . . . 29
5.3
Ship Matching Algorithm . . . . . . . . . . . . . . . . . . . . . . . . . . 29
Consistency Check . . . . . . . . . . . . . . . . . . . . . . . . . . . . . . . . . 34 6.1
Consistency Checking Process . . . . . . . . . . . . . . . . . . . . . . . 35
6.2
Items Comparison . . . . . . . . . . . . . . . . . . . . . . . . . . . . . . 35 6.2.1
Hard Comparison . . . . . . . . . . . . . . . . . . . . . . . . . . 37 6.2.1.1
vi
Example 1 . . . . . . . . . . . . . . . . . . . . . . . . 38
DRDC Atlantic CR 2010-025
6.2.1.2 6.2.2
6.2.3
7
8
9
Example 2 . . . . . . . . . . . . . . . . . . . . . . . . 39
Soft Comparison . . . . . . . . . . . . . . . . . . . . . . . . . . 39 6.2.2.1
Levenshtein String Comparison . . . . . . . . . . . . . 40
6.2.2.2
Thresholds . . . . . . . . . . . . . . . . . . . . . . . . 41
6.2.2.3
Example 1 . . . . . . . . . . . . . . . . . . . . . . . . 42
6.2.2.4
Example 2 . . . . . . . . . . . . . . . . . . . . . . . . 42
Pattern Comparison . . . . . . . . . . . . . . . . . . . . . . . . . 43 6.2.3.1
Example 1 . . . . . . . . . . . . . . . . . . . . . . . . 44
6.2.3.2
Example 2 . . . . . . . . . . . . . . . . . . . . . . . . 44
Data Model . . . . . . . . . . . . . . . . . . . . . . . . . . . . . . . . . . . . . 46 7.1
Multi Dimensional Representation of the Data . . . . . . . . . . . . . . . 46
7.2
Consistency Evolution in Time . . . . . . . . . . . . . . . . . . . . . . . 47
7.3
Consistency Application Database . . . . . . . . . . . . . . . . . . . . . 49
7.4
Database Population . . . . . . . . . . . . . . . . . . . . . . . . . . . . . 51
Consistency Application Web Service . . . . . . . . . . . . . . . . . . . . . . . 54 8.1
Operations . . . . . . . . . . . . . . . . . . . . . . . . . . . . . . . . . . 54
8.2
Data Model . . . . . . . . . . . . . . . . . . . . . . . . . . . . . . . . . . 54
Consistency Application Client . . . . . . . . . . . . . . . . . . . . . . . . . . . 57 9.1
Mapping Between Display Components and the Cube . . . . . . . . . . . 58 9.1.1
Statistics at the Ship Level: Item Table . . . . . . . . . . . . . . . 58
9.1.2
Statistics at the Source and Item Levels: Source Consistency Table 59
10 Suggested Enhancements . . . . . . . . . . . . . . . . . . . . . . . . . . . . . . 61 10.1
ASIA Database . . . . . . . . . . . . . . . . . . . . . . . . . . . . . . . . 61
10.2
Consistency Tracking per Ship . . . . . . . . . . . . . . . . . . . . . . . 62
DRDC Atlantic CR 2010-025
vii
10.3
Vocabulary Solution . . . . . . . . . . . . . . . . . . . . . . . . . . . . . 63
10.4
Time Dependant Items Comparison . . . . . . . . . . . . . . . . . . . . . 63
10.5
Addition of Digital Seas as a Data source . . . . . . . . . . . . . . . . . . 64
10.6
Position of the Information on Visual Display . . . . . . . . . . . . . . . 65
10.7
Selection of the Ship Image . . . . . . . . . . . . . . . . . . . . . . . . . 65
10.8
ITU Information Extraction . . . . . . . . . . . . . . . . . . . . . . . . . 66
References . . . . . . . . . . . . . . . . . . . . . . . . . . . . . . . . . . . . . . . . 67 List of symbols/abbreviations/acronyms/initialisms . . . . . . . . . . . . . . . . . . 69 Glossary . . . . . . . . . . . . . . . . . . . . . . . . . . . . . . . . . . . . . . . . . 70
viii
DRDC Atlantic CR 2010-025
List of figures Figure 1:
Figure 2:
Figure 3:
Figure 4:
Figure 5:
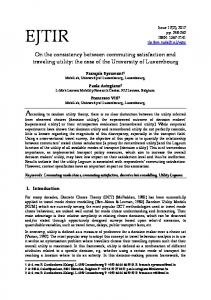
Main components and context of the Compare MDA project. The SeaSpider and Automated Ship Image Acquisition (ASIA) data sources are used ’as is’. The Compare MDA project developed those parts encompassed by the dashed line. What is referred as the Compare-MDA framework in this document includes all components of the diagram. . . . . . . . . . . . . . . . . . . . . . . . . . . . . . . .
2
QueryParameter data structure for ASIA web service. The QueryParameter object is the input of operations getInformation, getLatestInformation, getInformationWithImage and getLatestInformationWithImage. . . . . . . . . . . . . . . . . . . .
5
Ship data structure for ASIA web service. The output of operations getInformation, getLatestInformation, getInformationWithImage and getLatestInformationWithImage is a list of Ship objects. . . . . . . . . . . . . . . . . . . . . . . . . . . .
6
QueryParameter data structure for SeaSpider web service. The QueryParameter object is the input of operations getInformation, getLatestInformation and getInformationWithSource. . . . . . .
7
Ship data structure for SeaSpider web service. The output of operations getInformation, getLatestInformation and getInformationWithSource is a list of Ship objects. . . . . . . . . . .
8
Figure 6:
QueryParameter data structure for ITU web service. The QueryParameter object is the input of operation getInformation. . . . 11
Figure 7:
Ship data structure for ITU web service. The output of operation getInformation is a list of Ship objects. . . . . . . . . . . . . . . . . . 12
Figure 8:
Consistency Application Functional Diagram and Context. The main three layers for communication, control and logic are indicated. . . . . . 14
Figure 9:
The data source clients. The individual clients interface using SOAP messages, to the web services at each data source. The web service (i.e., small gray box under each data source) represents the web service business logic, the interface to the data source (i.e., WSDL file with all published operations) and the web service client stubs. . . . . . . . . . . 15
DRDC Atlantic CR 2010-025
ix
Figure 10: UML diagram showing the data source client interface. Source clients are shown across the top of the figure. Each client must have the methods: invoke; getNewShips; getLastEntry. . . . . . . . . . . . . . . . 16 Figure 11: High level representation of the information flow in and out of the Consistency Application (CA). Data flows into the CA from the data sources. The vocabulary solution matches similar ship items, to provide the ability to match the ship entity (i.e., ship matching) across the sources. This allows the consistency check to be performed. The CA then builds queries to further support the checking of the ship data from the data sources. . . . . . . . . . . . . . . . . . . . . . . . . . . . . . . 18 Figure 12: Information flow in the CA. Individual data sources provide responses to queries in the language of the data source. The Clients, with the help of the vocabulary solution, then modify the language to align with the language used in the CA. Ship matching is then performed, followed by the consistency checking among the data sources. . . . . . . . . . . . . . 19 Figure 13: Example of a data flow from the data source clients. The vocabulary alignment defines comparison groups to be used by the consistency checking component. In this figure, each of the three data sources provide ship names that are variations of ”Queen”. The ship matcher determines that two distinct physical entities exist. Thus, two Comparison Groups are created. These Comparison Groups are then sent to the consistency checker. . . . . . . . . . . . . . . . . . . . . . . 21 Figure 14: Information flow out the CA. Information flows from the CA Manager to the data source specific clients, in the language of the CA. The Clients, with the help of the vocabulary solution, modify the language to align with the web services at the specific data sources. . . . . . . . . 22 Figure 15: AuthoritativeSource class definition . . . . . . . . . . . . . . . . . . . . 29 Figure 16: Comparison group object. . . . . . . . . . . . . . . . . . . . . . . . . . 29 Figure 17: Main processes of the ship matching component. Data source responses are divided into those responses that contain a Unique Identifier (UID) and those that do not. Comparison groups are generated for each division. 30 Figure 18: Flow chart of the ’with uid’ list processing. . . . . . . . . . . . . . . . . 32 Figure 19: Flow chart of the ’without uid’ list processing. . . . . . . . . . . . . . . 33 Figure 20: Consistency check component process . . . . . . . . . . . . . . . . . . 45
x
DRDC Atlantic CR 2010-025
Figure 21: Averages over matches: Decomposition of sources in items, decomposition of item in ships. . . . . . . . . . . . . . . . . . . . . . . 46 Figure 22: Value for one ship of one item of the source. The gray dot represents the match value between the name of ship1 as provided by source1, compared to the names for the same ship from other sources. . . . . . . . 48 Figure 23: Statistics for one item of the source. . . . . . . . . . . . . . . . . . . . . 49 Figure 24: Overall statistics for a source. . . . . . . . . . . . . . . . . . . . . . . . 50 Figure 25: Ships are added and statistics is building up. . . . . . . . . . . . . . . . 51 Figure 26: Time filtering of consistency statistics. . . . . . . . . . . . . . . . . . . 51 Figure 27: Query data structure for CA web service. The Query object is the input of the operation getInformation. . . . . . . . . . . . . . . . . . . . . 55 Figure 28: Output structure of the operation getInformation. Note that itemList of SourceStat is always empty. . . . . . . . . . . . . . . . . . . . . . . . 55 Figure 29: Output structure of the operation getSourceStatistics. Note that sourceList of ItemStat is always empty. . . . . . . . . . . . . . . . . . . 56 Figure 30: Consistency Application web client interaction with the Compare-MDA framework. The client queries the CA web service to get the comparison results and the ASIA web service for the pictures. . . 57 Figure 31: Match scores of the web page item table are located in a single slice of the cube. In this example, the slice is made at the level of OOCL Malaysia. . . . . . . . . . . . . . . . . . . . . . . . . . . . . . . . . . . 58 Figure 32: Each match displayed in the web page item table corresponds to a cell in the cube. All matches of the table thus correspond to an entire slice of the cube. The slice is made at the Ship level (OOCL Malaysia ship). The averaged consistency among sources is computed with the gray cells of the cube. . . . . . . . . . . . . . . . . . . . . . . . . . . . . . . 59 Figure 33: The average consistency of a source, for a given item is computed using the matches contained in a single column of the cube. In this example, the ITU consistency for flag is computed using the match scores in the column starting at the intersection of ITU and Flag. The general source consistency is computed with the matches contained in a vertical slice of the cube. In that example, the ASIA consistency is an average of the matches contained in the slice made at the ASIA source. . . . . . . . . . 60
DRDC Atlantic CR 2010-025
xi
This page intentionally left blank.
xii
DRDC Atlantic CR 2010-025
1
Scope
The objectives of the ”Compare Maritime Domain Awareness” (Compare MDA) contract were to: – Join parallel applications: SeaSpider and ASIA, – Compare information from disparate sources, – Quantify a source consistency, – Add an external data source, – Display comparison results in a Google Earth environment, and To fulfill these objectives, the Compare-MDA framework was developed (see Figure 1). The framework is a Service Oriented Architecture (SOA) built to compare the information from diverse data sources all providing information relevant to Maritime Domain Awareness (MDA). The framework allows an assessment of the consistency of information contained in the data sources (i.e., ASIA and SeaSpider databases) and visualization of the consistency results within a Google Earth environment. In addition to the data sources exposed as web services, the Consistency Application (CA) and its web client, an Universal Description Discovery and Integration (UDDI) repository [1] has been set up. A software component was also developed to publish web services to the repository (identified as Service Publisher in Figure 1). This document summarizes all the technical activities and achievements of the Compare MDA contract. It includes: – A description of the data sources, including the initial two sources and a third source developed specifically for the project (Section 2) – A description of the Consistency Application architecture (Section 3) – A description of the main components of the Consistency Application, including details of all decision making algorithms. These main components are: Vocabulary Solution (Section 4), Ship Matching (Section 5) and Consistency Check (Section 6). – A description of the data model and storage (Section 7) – A description of the web interface developed to expose the Consistency Application (Section 8) and the Web Client used to visualized consistency results and ship information (Section 9). We have also inserted a final section: – A view toward the future and suggested enhancements (Section 10).
DRDC Atlantic CR 2010-025
1
Figure 1: Main components and context of the Compare MDA project. The SeaSpider
and ASIA data sources are used ’as is’. The Compare MDA project developed those parts encompassed by the dashed line. What is referred as the Compare-MDA framework in this document includes all components of the diagram.
2
DRDC Atlantic CR 2010-025
2
Data Sources
The consistency application provides a means for the cross comparison of information from multiple data sources, each providing ship-related information applicable to Maritime Domain Awareness (MDA). From a technical point of view, a data source is a web service exposing a database. In the current state of the Compare-MDA framework, there are three data sources: ASIA Data Source, SeaSpider Data Source and ITU Data Source. A service-based architecture was developed to expose the data source functionalities using standardized interface description. It provides a standard means for services to communicate over a network. The main advantage of having data sources as web services is re-usability. The framework was designed so that web services are loose-coupled. Therefore, the reuse of these data sources within other frameworks or to enhance the current framework to include other systems (wrapped as Web Service (WS)) and link them with other applications is facilitated by the architecture.
2.1
ASIA Data Source
The Automated Ship Image Acquisition (ASIA) system collects high-resolution ship photographs in Halifax Harbour, with minimal human intervention. The basic idea of the system is to use ship self-reports from the Automatic Identification System (AIS) to direct a digital camera towards a ship, compose the shot automatically and then store the resulting photo on the system. See [2] for more information about the ASIA system. The information contained in the AIS reports and the location of the ship images on the system are stored in a database.
2.1.1
ASIA Web Service
The ASIA Web Service is a web service interface to the ASIA Database (DB). This web service is a particular type or category of service, known as a data service. The service is independent from the ASIA application, which means that if the ASIA application stops, the web service continues to offer its services. In other words, the web service logic is decoupled from the ASIA application. The ASIA data service only exposes the information contained in the ASIA DB and does not offer any operation to modify this information. The ASIA web service, called AsiaDataSourceService, allows access to ship-related data contained in the ASIA system. In the ASIA DB, a ship is uniquely defined by its Maritime Mobile Service Identity (MMSI) number. Ship data returned from the service includes MMSI number and additional complex types containing static and dynamic in-
DRDC Atlantic CR 2010-025
3
formation about the ship. An important feature of the ASIA application is that it takes visual images of ships. These images are stored and linked to the DB. The ASIA web service provides an interface to the ASIA DB and offers operations to acquire the thumbnail versions of the ship images. The service transfers each image into the returning service message using the Message Transmission Optimization Mechanism (MTOM) protocol, a W3C Recommendation designed for optimizing the electronic transmission of attachments (see [3] for details about MTOM and [4] for its use with Axis2). 2.1.1.1
Operations
The operations offered by the ASIA web service are described in Table 1. The operation getInformation gets the ship information contained in the ASIA database satisfying the input query parameters. All ship reports are contained in the response. The getLatestInformation does the same, but only includes the last report of each ship in the response. getInformationWithImage and getLatestInformationWithImage does the same thing, but also includes a thumbnail version of the ship image in the response. Operation getNewShips retrieves all ship names from the ASIA DB with a GPS time equal or higher than the input time and getLatestEntryTime gets the GPS time of the last report recorded in the DB. Finally, getImageById gets the thumbnail version of the ship image corresponding to the input image ID, as it is stored in the ASIA DB. Name Input getInformation QueryParameter getLatestInformation QueryParameter getInformationWithImage QueryParameter getLatestInformationWithImage QueryParameter getNewShips Date getLatestEntryTime getImageById String Table 1: ASIA Web Service Operations
2.1.1.2
Output Array of Ship Array of Ship Array of Ship Array of Ship Array of String String Array of byte
Data Model
Most operations take a QueryParameter object as input and output an array of Ship objects. The structure of QueryParameter and Ship objects are illustrated in Figure 2 and 3 respectively.
4
DRDC Atlantic CR 2010-025
Figure 2: QueryParameter data structure for ASIA web service. The QueryParameter object is the input of operations getInformation, getLatestInformation, getInformationWithImage and getLatestInformationWithImage.
2.2
SeaSpider Data Source
The SeaSpider application was developed at DRDC Atlantic to automate the collection of publicly available web-based information on ship traffic. SeaSpider runs continuously, acquiring information about marine vessels from sources of information published on the internet. SeaSpider is fine-tuned to search for, organize, and display ship information about locations (ports), dates and times, and activities (arrival, in berth, departure). SeaSpider stores the acquired information in a database. See [5] for more information about the SeaSpider system.
2.2.1
SeaSpider Web Service
The SeaSpider Web Service, called SeaSpiderDataSourceService, is a web service interface to the SeaSpider DB. The SeaSpider web service also only exposes the information contained in the SeaSpider DB, without the possibility of modifying its content. Similar to the ASIA service, this implementation means the SeaSpider application continues to be responsible for updating the SeaSpider database, while the SeaSpider web service is responsible for providing those data to other applications. The SeaSpider web service also offers operations which return data pertaining to specific ships depending on the input query parameters. In the SeaSpider DB, a ship is uniquely defined by its name. In this case, the returned data from the service contains the ship name plus other complex data types containing static and dynamic information specific to the ship. 2.2.1.1
Operations
The operations offered by the SeaSpider web service are described in Table 2. The operation getInformation gets all ships and their activities from the SeaSpider DB. All ship descriptions match the input query. getInformationWithSource does the same
DRDC Atlantic CR 2010-025
5
Figure 3: Ship data structure for ASIA web service.
The output of operations getInformation, getLatestInformation, getInformationWithImage and getLatestInformationWithImage is a list of Ship objects.
thing but each activity comes with its latest information source, i.e. its last page downloaded. The getLatestInformation does the same, but only includes the last activity of each ship in the response. Operation getNewShips retrieves all ships names from the SeaSpider DB with an activity snapshot (information source) downloaded after or at the same input date and getLatestEntryTime gets the date when the last source was downloaded. It corresponds to the timestamp of the last seaspider entry. 2.2.1.2
Data Model
Most operations take a QueryParameter object as input and output an array of Ship objects. The structure of QueryParameter and Ship objects are illustrated in Figure 4 and 5 respectively.
6
DRDC Atlantic CR 2010-025
Name Input Output getInformation QueryParameter Array of Ship getInformationWithSource QueryParameter Array of Ship getLatestInformation QueryParameter Array of Ship getNewShips Date Array of String getLatestEntryTime String Table 2: SeaSpider Web Service Operations
Figure 4: QueryParameter data structure for SeaSpider web service. The QueryParameter object is the input of operations getInformation, getLatestInformation and getInformationWithSource.
2.3
ITU Data Source
The ITU data source is based on the ITU website search capability 1 . An application was developed to fill a local database with the ITU website information about ships. This application and the local database are wrapped as a web service and exposed as a data source. The ITU data source provides information about ships upon request. It looks first in the local DB to get the information. If the ship is absent from the local DB, a query is submitted to the ITU website in an attempt to retrieve the ship information and then update the ITU local DB.
2.3.1
ITU Application
The ITU application is an interface to the ITU website’s search page. It performs the following actions: 1. Create a connection to the ITU search web page. 2. Send the inputs to the web page. 3. Process the response. 4. Return the output. 1. http://www.itu.int/online/mms/mars/ship_search.sh
DRDC Atlantic CR 2010-025
7
Figure 5: Ship data structure for SeaSpider web service. The put of operations getInformation, getLatestInformation getInformationWithSource is a list of Ship objects. 2.3.1.1
outand
Interaction with ITU Website
The ITU search web page sends queries to its server using the HTTP POST method. It is possible to send a request remotely to a web page using the HTTP POST method with Java NET libraries and classes URL, URLEncoder and URLConnection. With those classes, actions 1 and 2 above are covered by the following steps: Step 1 Create the URL object needed to create the connection, the simplest constructor would be that of a String representing that Uniform Resource Locator (URL). Step 2 Use the URL object to get a URLConnection to the remote resource and to set the content type. Step 3 Get a DataOutputStream and start sending to that resource. Step 4 Get a BufferedReader and start getting a response. The resource response is a HyperText Markup Language (HTML) string containing the data needed to produce the output (e.g., flag, ship name, etc.). In order to process the response (Step 3), the HTML string has to be parsed, i.e. the HTML tag hierarchy embedded from the document is used to extract target information in the document. Note that this approach is very sensitive to the response structure. A change in the results layout may jeopardize the information extraction procedure. See Section 10.8 for possible solutions to the problem. The impact of a change in the website design on the ITU WS is limited. If a query is
8
DRDC Atlantic CR 2010-025
sent to the ITU web service and the ship description satisfying this query is not in the local database, the query is sent to the ITU web page. If the response can’t be parsed correctly, no ship description will be sent back by the ITU WS. 2.3.1.2
Database
The local ITU database runs on a MySQL server and contains a single table: ituTable. This table, which is now available to the MIKM group, contains all the information made available by the ITU website 2 : name Ship name. mmsi MMSI number (numeric code). owner Owner of the ship, which is the name of the licensee or the owner of the ship. hours Hours of service (alpha-numeric code). callsign Ship’s call sign (alpha-numeric code). type Ship’s type (alpha code 3 ). correspondence Correspondence or nature of service of the ship (alpha code). flag Administration and/or Geographical Area to which the MID has been allocated, indicated by the full name. selcalNo Selective calling number of the ship (alpha code). associatedMmsi MMSI number associated with parent ship (alpha-numeric code). rtgBand Ship’s radiotelegraphy (RTG) band. Frequency bands used for radiotelegraphy transmissions (alpha code). radioInstallation Ship’s radio installation, such as Inmarsat A, B, C, VHF DSC, etc. personCapacity Capacity of persons on board (passengers and crew) aaInfo Particulars concerning the termination or cancellation of accounting authority responsibilities (dates preceded by the abbreviations TER or CAN respectively). lastUpdate Date of the last update of this ship information. aaic Accounting Authority Identification Codes: identified by their accounting authorities identification codes (AAICs) in accordance with ITU-T Recommendation or by a numerical references to notes designating other entities to which accounts for the mobile station may be sent. boats Indicates the number of lifeboats on board fitted with radio apparatus. 2. Details about each of these fields can be found in http://www.itu.int/ITU-R/terrestrial/ mars/help/index.asp 3. ITU alpha code mapping for type can be found at http://www.itu.int/ITU-R/terrestrial/ mars/help/table-2.pdf
DRDC Atlantic CR 2010-025
9
Epirbs Emergency Position-Indicating RadioBeacon: A station in the mobile service the emissions of which are intended to facilitate search and rescue operations (alpha code). grossTonnage Ship’s gross register tonnage. A common measurement of the internal volume of a ship with certain spaces excluded. One ton equals 100 cubic feet; the total of all the enclosed spaces within a ship expressed in tons each of which is equivalent to 100 cubic feet. epirbidCode Ship’s Epirb ID Code. The identification code for alerting devices of the GMDSS, in accordance with the most recent versions of the ITU-R Recommendations exCallsign Ship station formerly assigned this call sign. exShipName Ship station formerly registered with this name. inmarsatNo Ship’s Inmarsat numbers (numeric code). vesselIdNo The International Maritime Organization (IMO) number or national registration number. selcalNo Selective call numbers assigned by Administrations in accordance with RR Article 19, Section V, of the Radio Regulations.
2.3.2
ITU Web Service
The ITU Web Service, called ItuDataSourceService, is a web service interface to the ITU DB and the ITU website. Unlike ASIA and SeaSpider web services, the ITU web service may update the ITU DB. The ITU WS also offers operations which return data pertaining to specific ships depending on the input query parameters. In the ITU DB, a ship is uniquely defined by the combination of its MMSI, call sign and name. In this case, the returned data from the service contains at least one of these items plus other complex data types containing only static information specific to the ship. No dynamic information is available. 2.3.2.1
Operations
The operations offered by the ITU web service are described in Table 3. The operation getInformation gets all ships from the ITU DB that matches the query parameters. getMmsiListSize gets the number of different MMSI from the ITU DB while getCallsignListSize gets the number of different callsigns.
10
DRDC Atlantic CR 2010-025
Name Input Output getInformation QueryParameter Array of Ship getMmsiListSize Integer getCallsignListSize Integer Table 3: ITU Web Service Operations 2.3.2.2
Data Model
The getInformation operation takes a QueryParameter object as input and outputs an array of Ship objects. The structure of QueryParameter and Ship objects are illustrated in Figure 6 and 7 respectively.
Figure 6: QueryParameter data structure for ITU web service. The QueryParameter object
is the input of operation getInformation.
DRDC Atlantic CR 2010-025
11
Figure 7: Ship data structure for ITU web service.
The output of operation
getInformation is a list of Ship objects.
12
DRDC Atlantic CR 2010-025
3
Consistency Application Architecture
The Consistency Application and its context are illustrated in Figure 8. The functional components of the CA are enclosed in the light-gray box. The CA is composed of three main layers (from top to bottom): communication (i.e., yellow box), control (i.e., orange box) and logic (i.e., dark gray box). The communication layer is composed of the data source clients and the vocabulary solution. The data source clients represent a group of software components that are responsible for the interface to the data sources and the CA control. The second component, the vocabulary solution, is responsible for aligning the vocabularies from the diverse data sources with the CA vocabulary. The control layer orchestrates the data flow in the CA according to the user defined parameters. The CA manager deals with the timing of queries to the individual sources. The characteristics of the manager are controlled via input parameters. Finally, the logic layer creates ship entities based on data source responses. This layer is also responsible for the comparison of ship items across sources. This layer is also responsible for the storage of comparison results and ship attributes. Section 3.1 briefly describes the role of each component in the three layers of the CA while section 3.2 describes the data flow inside the CA.
3.1
Main Components
The following sections briefly describe the role of each component of the CA. Entire sections will be dedicated to the more complex components (e.g., vocabulary solution, ship matching, and consistency check).
3.1.1
Data Source Clients
Data source clients are a subcomponent in the communications layer. These clients provide the interface between the data source and the CA, as described in Figure 9. At the time of writing, there are three clients which separately connect to one of three data sources: ASIA, SeaSpider and ITU. However, the CA design allows the easy addition of data sources and therefore must allow the easy addition of data source clients. See [1] for technical details on the addition of a data source and its client. The first role of a data source client is to provide an interface to a particular data source. In this constructed framework, the data source is a web service. In this context of web services, the client code interacts with the web service client stub. In this case, the stub is a
DRDC Atlantic CR 2010-025
13
Figure 8: Consistency Application Functional Diagram and Context. The main three lay-
ers for communication, control and logic are indicated. piece of Java code which is based on the WSDL description of the web service. Technical aspects about the interaction of the data source client with the data source are out of the scope of this document. The second role of a data source client is to interface with the CA itself, or more precisely with the control layer. In order to interface with the CA, each data source client must implement the DataSourceClient interface. As described in Figure 10, the interface contains three methods: invoke, getNewShips and getLastEntry. The method invoke is used to get ship descriptions from a data source corresponding to the criteria of the input query. The method getNewShips retrieves the list of the ship names having activities/reports reported by the source since the input date. The getLastEntry method gets the date when the last activity/report was recorded by the source. Details about the role of each of these methods in the CA data flow can be found in Section 7.4. This simple design allows the easy addition
14
DRDC Atlantic CR 2010-025
Figure 9: The data source clients. The individual clients interface using SOAP messages,
to the web services at each data source. The web service (i.e., small gray box under each data source) represents the web service business logic, the interface to the data source (i.e., WSDL file with all published operations) and the web service client stubs. of new data sources for comparison by the CA.
3.1.2
Vocabulary Solution
Each data source provides data independently of all the other sources. Each data source provides its data using the vocabulary of the specific data source. This means that each data source has its own naming convention to describe the data it contains. Thus, the particular parameter naming used by the data source must be aligned with all the other data source naming conventions. To do this, we construct a CA naming convention. The CA naming convention is constructed to suit the specific needs of this project, and does not represent a vocabulary based on any particular standard. The naming convention used at each data source is aligned to the CA naming convention vocabulary. This aligning is performed by the vocabulary solution component. The vocabulary solution component is a simple class which maps each data source ship attribute to its corresponding CA attribute. This mapping is essential to allow the CA to compare the attributes from multiple sources. Details about this component can be found in section 4.
DRDC Atlantic CR 2010-025
15
Figure 10: UML diagram showing the data source client interface. Source clients are
shown across the top of the figure. Each client must have the methods: invoke; getNewShips; getLastEntry.
3.1.3
CA Manager
The CA Manager component is part of the control layer. The CA Manager orchestrates the chain of events leading to the comparison of ship items among sources. The Manager is a scheduled task that builds queries that are then sent to the data sources. The CA Manager receives the responses from the data sources, and then passes these responses on for additional analysis. The Manager also deals with new ships being reported by the data sources. The Manager ensures that for every new ship having activities/reports reported by one of the data sources, a comparison of the ship attributes is made among sources. For details about the flow of events orchestrated by the CA Manager, refer to Section 7.4.
3.1.4
CA Parameters
The CA Parameters component is part of the control layer. This component is a class that acts like a configuration file. The user-defined parameter definitions are located in this class. Those parameters control: – the data sources used for comparison – the source acting as the Authoritative Source (AS) – the ship items used in any comparison and the kind of comparison they require – the data source providing the position of the ship (for geo-referenced display), and
16
DRDC Atlantic CR 2010-025
– the end point location of the data source web services (URL) These parameters are defined in a class. Thus, it would be straightforward to expose the parameters using a Graphical User Interface (GUI).
3.1.5
Ship Matching
Ship matching is part of the logic layer. The basic function of the CA is to compare similar information from multiple sources. Therefore, one capability of the CA is related to the identification of consistent and inconsistent information from these sources. However, the information cannot be compared until we first establish that the objects being compared are in fact the same object. Thus, the CA must also search and identify the same objects from the multiple source responses. This search and identification capability is rendered by the ship matching algorithm. The description of this process can be found in section 5.
3.1.6
Consistency Check
The consistency check component is the heart of the CA. It is responsible for the comparison of the ship items among the data sources and stores the comparison results. Since ship items differ in their nature (i.e., some are ID numbers like IMO and other are descriptive strings (potentially containing typos) like ship name), different comparison approaches must be applied depending on the nature of the item. The different comparison techniques are detailed in section 6.
3.2
Flow of Information
This section describes the flow of information in and out of the CA. The focus of this section is the data moving between the main components of the CA. Figure 11 is a high level illustration of the data flow out of and into the CA. The information flowing into the CA originates from the data source and ends in the CA DB. The information flowing out of the application goes from the CA Manager to the data sources, in the form of query information.
3.2.1
Flow In
The data flowing into the CA is illustrated in Figure 12. Note that some components were removed to simplify the diagram. The diagram shows the flow of data into the CA. The following steps describe this sequence. 1. Each of the data sources sends its response to a query made by the CA. The response, if any, is a list of ship descriptions. These descriptions use the data source vocabulary. All ships in the response meet the conditions set out in the query criteria. 2. Data source clients receive their responses.
DRDC Atlantic CR 2010-025
17
Figure 11: High level representation of the information flow in and out of the CA. Data
flows into the CA from the data sources. The vocabulary solution matches similar ship items, to provide the ability to match the ship entity (i.e., ship matching) across the sources. This allows the consistency check to be performed. The CA then builds queries to further support the checking of the ship data from the data sources. 3. Each data source client uses the vocabulary solution component to translate the ship description from the data source vocabulary into the CA language. In other words, it uses the vocabulary solution to create a consistent representation of the ship, based on the CA vocabulary. 4. Data source responses (aligned with the CA vocabulary) are sent to the ship matching component. It is the CA Manager (not shown in the diagram) that is responsible for linking the client responses to the ship matching component. Note that the data don’t change between the clients and the ship matching functionality. 5. The ship matching component looks in all data source responses to find ship entities. A ship entity, called a Comparison Group (CG), is the group of data returned from all the data sources, which represents information on one ship. Otherwise said, a CG is an object that contains all data source responses describing the same ship entity. The
18
DRDC Atlantic CR 2010-025
Figure 12: Information flow in the CA. Individual data sources provide responses to
queries in the language of the data source. The Clients, with the help of the vocabulary solution, then modify the language to align with the language used in the CA. Ship matching is then performed, followed by the consistency checking among the data sources. ship matching component takes the data source response expressed in CA vocabulary (i.e. lists of CA ships), and outputs a list of CGs. 6. The consistency check functionality compares similar information in each CG. It takes a CG (ship entity) as input and compares the value of each attribute among sources. It stores the results of these comparisons, which are normalized scores, into the CA DB. It is also responsible for the storage of the ship attributes reported for each source. Example
To illustrate a part of this process, let us consider the following example. Suppose a query is made to the data sources: Query(shipname = ”queen”). All data source responses will contain descriptions of ships having a name that contains the string ”queen”. In a mathematical type notation, the three responses from the three data sources may look like: name=Queen Victoria
DRDC Atlantic CR 2010-025
19
shipname=IceQueen n1=Queen III
The responses use the vocabulary of the individual data source, as indicated by the use of name, shipname, and n1. The responses are then translated into the CA vocabulary and sent to the ship matching algorithm. The data source responses, after being transformed into CA ships, are illustrated in Figure 13. Note that only the values of the ship names are illustrated. The ship matching algorithm then detects CA ships that belong together, i.e. it detects the data that describes the same ship. The comparison group is then created. In this example, two CGs are instantiated: one is made from responses of the three sources and the other one contains ship descriptions from sources 1 and 2 only. Again, only ship names are illustrated. Finally, those CGs are sent to the comparison check. For CG 1, the consistency check functionality will compare available ship items of the three sources. For instance, in the case of the name, we can see that sources 1 and 3 provide the same value, but source 2 has a slightly different ship name.
3.2.2
Flow Out
The data exiting the CA is illustrated in Figure 14. This diagram shows the main states of the data when it flows from the CA Manager towards the data sources. The following steps describe this sequence of states. 1. The CA Manager builds a query to be sent to the data sources. The query is a restriction on a particular ship item (e.g., shipname = ”queen”). The query is built using the CA vocabulary. 2. The query is received by each of the data source clients. 3. Each data source client uses the vocabulary solution to translate the query into the language particular to the data source. In other words, the vocabulary solution is used by the client to express a CA ship item restriction into a ship item description understandable by the specific data source. 4. The query is sent to each data source.
20
DRDC Atlantic CR 2010-025
Figure 13: Example of a data flow from the data source clients. The vocabulary alignment
defines comparison groups to be used by the consistency checking component. In this figure, each of the three data sources provide ship names that are variations of ”Queen”. The ship matcher determines that two distinct physical entities exist. Thus, two Comparison Groups are created. These Comparison Groups are then sent to the consistency checker.
DRDC Atlantic CR 2010-025
21
Figure 14: Information flow out the CA. Information flows from the CA Manager to the data source specific clients, in the language of the CA. The Clients, with the help of the vocabulary solution, modify the language to align with the web services at the specific data sources.
22
DRDC Atlantic CR 2010-025
4
Vocabulary Solution
When services communicate, they do not necessarily use the same vocabulary. To interact successfully, a third party must intervene to find correspondences (i.e., mappings) between the terms used in the service’s vocabularies. Since each data source provides data independently with its own parameter names, the CA requires a functionality to align the vocabularies in the external data sources. There are three possible approaches to solve the vocabulary alignment problem: 1. Express the vocabularies with a formal description language, such as Web Ontology Language (OWL), and apply automatic alignment methods. 2. Express the vocabulary mapping with protocols and data formats, using technologies such as eXtensible Markup Language (XML) tags and schemas (e.g., vocabularyspecific XML language bindings). 3. Develop ad-hoc application specific mapping methods. The third approach was chosen: the vocabulary solution consists of a single static class offering alignment methods. The vocabulary solution associates the parameter names from the different sources. For every data source, two methods need to be developed. One method builds CA ship object from the data source information, while the second method builds a query for the data source from the CA information. In the first case, alignment methods are taking data source information as input and generating CA ship objects as output. In the second case, alignment methods take CA ship properties as input and return queries formulated in the vocabulary of the data source. The next section justifies the choice of the third approach to solve the CA vocabulary alignment problem.
4.1
Approach Justification
The use of ontologies to map vocabularies is, in a broad sense, the context of the semantic web. In that context, description languages are required to provide a formal description of the concepts, terms, and relationships within a given knowledge domain. Some of these description languages include Resource Description Framework (RDF) and OWL ([6] and [7] respectively for specifications). However, programs that read OWL documents that conform to a particular ontology cannot automatically relate the concepts in this ontology to concepts expressed in a second ontology. Such relationships can only be formed through the creation of explicit mappings
DRDC Atlantic CR 2010-025
23
between the concepts in the different ontologies. Creating this mapping is the alignment problem. Several tools/frameworks were developed to solve that problem (see [8] list for examples of such tools). The main motivation behind the use of description languages such as OWL, is to express the complexity of the knowledge domain in an explicit manner that allows computation. The complexity of the knowledge domain necessitates the use of the expressive description languages. In our case, the data source vocabularies represent concepts, terms and relationships that are limited to ship descriptions (i.e., the ship static and dynamic information). Such a small set of terms does not warrant the use of an ontology. As well, implementing such an ontology for the description and validation of each data source vocabulary would require considerable effort. It is believed that the project would not have gained from such a high level abstraction for the data source vocabulary. The second approach consists of building an XML file that contains all vocabulary bindings and develop an interface to this file. This XML vocabulary definition would describe the names of data source parameters (i.e., it would describe the data source vocabulary). It would also describe the meaning of the terms and relationships between the terms. The main issue with the second approach is the interface development. Two kinds of interfaces could be used to bridge between the XML description and the application: Vocabulary-independent and vocabulary-specific interfaces. Application code that performs computations on XML data utilizing a vocabulary-independent interface can be complex and in many instances tightly coupled to the data layout specified by the schema. The vocabulary-independent interfaces are low-level and rarely provide enough applicationspecific semantics to allow direct computations on the data. An alternative approach is the vocabulary-specific interface which bridges generic XML concepts and the applicationspecific ones. Vocabulary-specific interfaces can be generated automatically from schema definitions and provide developers with a more robust and intuitive interface to the underlying data. Tools are available, such as Java Architecture for XML Binding (JAXB), which automatically generates vocabulary-specific data access interfaces. See [9] for details about vocabulary-specific data access interfaces. This second approach was initially envisaged as the solution to the vocabulary problem for the CA. In this case, the XML file would have to contain all the CA vocabulary and the equivalents from all the data sources. To investigate this approach, an Axis2 SOAPengine was used to build web services and their client stubs automatically from the WSDL description. Using this methodology, objects and get/set methods were automatically generated for each data source web service response. In other words, at the level of the data source clients, we had objects and methods created to access the data source content as represented by the data source response. In that context, the vocabulary mapping problem was at the level of mapping data source response objects to the CA ship objects. After
24
DRDC Atlantic CR 2010-025
investigation, the technique of a vocabulary-specific XML language bindings was judged to be overly complex. The effort required to design and develop the data access interface was judged more important and thus efforts in this area were considered more beneficial than the vocabulary-specific XML language bindings.
4.2
Alignment of Data Entering the Consistency Application
As described in section 3.2.1, the data originating from the diverse data sources need to be aligned with the CA vocabulary. In concrete terms, this means a mapping is required to relate ship properties from the different data source vocabularies to the CA ship properties. To fulfill this goal, the vocabulary solution offers methods to translate each data source response (expressed as a list of ship objects) into a list of ship objects as expressed in the CA vocabulary; i.e. CAShips. These methods are listed below: – asiaToCaShips: asiaShip → CAShip – seaspiderToCaShips: seaspiderShip → CAShip – ituToCaShips: ituShip → CAShip The following is a pseudo code example to illustrate the behavior of these methods aligning data coming in the CA. CAShip asiaToCAShip( asiaShip ) { CAShip.setTime( asiaShip.getGPSTime() ); CAShip.setPort( asiaShip.getDestination( )); ... return CAShip; } In order to compare ship attributes, extra information manipulation was required. The following methods were implemented to modify the data: – asiaToCAType, ituToCAType – ituToCAFlag, toCAFlag – toCATime In ASIA, the ship type is defined with a numeric code (AIS ship type code), while in ITU it is defined with an alphabetic code. In order to match those ship types with other data source types, these numeric/alpha codes are translated by the vocabulary solution into a self describing ship type. This self describing ship type is created specifically for the CA.
DRDC Atlantic CR 2010-025
25
SeaSpider ITU Russia Russian Federation Irish Republic Ireland United Kingdom United Kingdom of Great Britain and Northern Ireland Table 4: Names used by SeaSpider and ITU to represent the same country
The following example illustrates the kind of ship type mapping performed by these two methods: – asiaToCAType: ”30” → ”Fishing Vessel” – ituToCAType: ”MM CON” → ”Merchant Container Ship” In a similar way, the ship flag (country name) description from ITU is also slightly modified to allow comparison. ITU sometimes provides a flag with details in parentheses. The ituToCAFlag functionality removes the parentheses and the content of the parentheses. For instance, if the ITU flag is ”Bahamas (Commonwealth of the)”, the returned value will be ”Bahamas”. Also, the symbol ”&” is changed to the word ”and”. Moreover, slightly different names can be used to describe the same country. So far, we found the three cases listed in table 4. The goal of the Consistency Application is to compare similar data items to develop added confidence in these data. For that reason, it was decided to align, when possible, the country name. Therefore, the toCAFlag functionality modifies the flag value the following way: – Flag value Russian Federation is changed to Russia – Flag value Irish Republic is changed to Ireland – Flag value United Kingdom of Great Britain and Northern Ireland is changed to United Kingdom It is expected that other cases implying different country names for the same country will arise. It is recommended to compare all country appellations for SeaSpider and ITU to find such differences. In the cases where a difference is found, it is straightforward to add a rule to toCAFlag to modify the country name, like described above. Time is reported by ASIA and SeaSpider as a formated string ”YYYY-MM-DD HH:MM:SS”. In order to ease maintenance and data base interactions, the time is not stored as a string in the CA. A date/time expression is stored as the number of seconds since January 1, 1970. Therefore, the method toCATime is required to transform a date/time expression from a string to the number of seconds since January 1, 1970.
26
DRDC Atlantic CR 2010-025
4.3
Alignment of Data Exiting the Consistency Application
As described in section 3.2.2, the data exiting the CA needs to be aligned with the diverse data sources vocabularies. This means we need to create a query that is understandable for each data source, but based on a single CA query. In concrete terms, this means we need to map CA ship properties to the different data source ship properties. This is accomplished with vocabulary solution methods that transform a CA query object into a particular data source query object. This query is then directly sent to the data source by SOAP messaging. These methods are listed below: – caToAsiaQuery: caQuery → asiaQuery – caToSeaSpiderQuery: caQuery → seaspiderQuery – caToItuQuery: caQuery → ituQuery The following is pseudo code to illustrate the behavior of these methods aligning the data exiting the CA. AsiaQuery caToAsiaQuery( caQuery ) { asiaQuery.setShipName( caQuery.getName() ); ... return asiaQuery; }.
DRDC Atlantic CR 2010-025
27
5
Ship Matching
The identification of a single ship across the data sources is the responsibility of the ”Ship Matching” process. This process identifies data source objects that correspond to the same physical entity (i.e., a singular physical ship). The Ship Matching process starts after each data source has responded to a query made by the CA; and immediately after the data source responses have been aligned with the CA vocabulary. The process has been generalized for all kinds of data sources, not only ASIA and SeaSpider. The key aspect is what is called the ship UID. There are many identifiers for ships, including the MMSI, IMO number, SCONUM, etc. However, there is no single unique identifier for all ships. In the CA, we construct a CA specific unique identifier. For the CA, the UID is formed from a combination of ship items. Using the nomenclature and data items found in the present AS, we construct the UID using ITU MMSI plus CallSign for the specific ship. This section is divided as follow: subsection 5.1 describes the authoritative source concept and its role in the CA; subsection 5.2 presents the comparison group object; and last part describes the ship matching algorithm.
5.1
Authoritative Source
The Ship Matching process uses the AS to connect ship descriptions together. The AS provides a trusted data item used to link ship descriptions: UIDs and ship name. It is currently based on the ITU web service. As mentioned above, for ITU, the UIDs are MMSI and CallSign. The CA architecture allows one to easily switch the AS, without impacting the ship matching algorithm. The procedure to change the AS is described in [1]. An AS must implement the Authoritative Source interface (see Figure 15). The interface is made from only two methods: getUidNames and getShipWithUid. The first method is used to determine the names of the UIDs that the AS can provide. Since the AS is currently based on the ITU web service, this method now returns CallSign and MMSI. The second method returns a CAShip corresponding to an input UID name and value pair. From a programmatic point of view, a data source can also be an AS. For a data source to be an AS, the associated data source client just has to implement the AuthoritativeSource interface (along with the DataSourceClient interface). The AS is used to linked the ship descriptions together and is not used as a ground truth
28
DRDC Atlantic CR 2010-025
to validate the ship item values. A source is selected to be an AS based on its ability to provide UIDs.
Figure 15: AuthoritativeSource class definition
5.2
Comparison Group
A Comparison Group (CG) is an object which contains all ships objects corresponding to the same ship entity, including the AS ship. The consistency check is performed on the ships of a CG. Figure 16 is a visualization of the CG. Each CG has a ship UID, to uniquely define a ship in the CA. This UID is the combination of the AS CallSign and MMSI.
Figure 16: Comparison group object.
A CG represents a ship entity in the CA. It is constructed from all the CAShip objects representing this ship, each CAShip object being the response of a data source. Therefore, a CG is made from each data source response describing this ship entity. A CG can’t have more than one comparison ship for each data source.
5.3
Ship Matching Algorithm
The full process of ship matching is described below. Steps 2, 3, 4 and 5 of the process are visualized in figure 17. The matching processing is described in the following steps:
DRDC Atlantic CR 2010-025
29
Figure 17: Main processes of the ship matching component. Data source responses are
divided into those responses that contain a UID and those that do not. Comparison groups are generated for each division. 1. Get the responses from all data sources for a query and align it to the CA data model. The output of this pre-matching step is the data source responses composed of CA ship objects. (a) A query is sent to all data sources, based on user defined parameters (e.g., from-to dates) (b) Each data source sends a response (e.g., list of ships) (c) The data source responses are translated into the CA language. At this stage, a list of CA ship objects from each data source is available, in the vocabulary of the CA. 2. Classify the responses from the data sources. At this stage, a response is considered to be a list of CA ship objects. The goal of this classification is to create two lists of responses: responses with the UID and responses without the UID. A source response is classified in the ”with uid” list if its ship object has at least one of the AS UIDs as a data item. Otherwise, a source response is classified in the ”without uid” list. The output of this step is the non-modified data source responses classified into two lists: with and without UIDs lists. 3. Process all ships identified in the ”with uid” list. This process is illustrated by the diagram flow in figure 18. The output of this process is a list of Comparison Groups. A Comparison Group is an object which will contain all ship objects corresponding to the same ship entity, including the AS ship (later the consistency check will be performed on the ships of these Comparison Groups):
30
DRDC Atlantic CR 2010-025
(a) Loop over all ship objects (disregarding the source) contained in the ”with uid” list. For each ship, determine the UID value for that ship. (b) From each UID value, query the AS to identify the corresponding ship. The AS identified ship will be used to link the ship objects having that UID with ships that don’t have the UID as part of the data source (e.g., SeaSpider). (c) Create a Comparison Group with the current ship and its corresponding AS ship. A Comparison Group (CG) is an object which will contain all ship objects corresponding to the same physical ship entity, including the AS ship (later the consistency check will be performed on the ships in a Comparison Group). (d) Look in the remaining list ”with uid” for ships (from other sources) with the same UID values as the AS. Add each matching ship to the CG and then remove the ship from the ”with uid” list. This avoids processing the ship twice. (e) Add the CG to a local list of CGs. 4. Process all ships contained in the ”without uid” list. The goal of this process is to match all ships contained in this list with the ships in the appropriate Comparison Group created in the previous step. The output of this process will be the same Comparison Group list, but with the ship list enhanced with ships from the ”without uid” list. This process is illustrated by the diagram flow in figure 19. Loop over all ship objects (disregarding the source) of the ”without uid” list. For each ship, determine which CG, if any, represents the ”‘best fit”’ for that ship. To determine the best fit: (a) For each ship contained in the ”without uid” list, evaluate the Levenshtein distance between its name and the name defined for the Comparison Group. The CG name is itself defined by the ship name from the AS (see 6.2.2.1 for details about this metric). The Levenshtein distance is termed the ”Comparison Group’s score”. It is noted by S in the flow chart. (b) Select the CG having the best Levenshtein score (SBest ), i.e. the smallest distance. There are two additional criteria for the selection of a CG for a given ship without UID: – The best CG must have a score equal or greater than 0.85 (85%), i.e. SBest ≥ 0.85. See 6.2.2.2 for justifications for this threshold. – There should be no other CG with a similar distance between its AS name and the current ship’s name. The threshold on the score is 0.025 (2.5%). In other words, if there is at least one other CG with a similar score S: |SBest − S| ≤ 0.025, no CG will be associated with this ship. (c) If a CG was selected for a ship contained in the ”without uid” list, add the ship object to this Comparison Group. 5. Filter Comparison Groups with at least two ship objects.
DRDC Atlantic CR 2010-025
31
Figure 18: Flow chart of the ’with uid’ list processing.
The procedure of using ship name to determine the same physical ship, is difficult and always open to debate. However, it is felt that allowing ship names to be used in the processing, allows the system to potentially incorporate diverse data sources. Ship name is typically included in data sources that describe ships. Thus, allowing ship names to be used in the comparison provides an algorithm that is sufficiently abstract to allow other diverse data sources. Note that one deficiency of the algorithm is its dependence on the ”with uid” list. The algorithm does not allow comparisons to be created when comparison groups contain only ships ”without uid”. This means that at least one data source must have the complete UID of the ship, for that ship to be included in the comparison generated by the CA.
32
DRDC Atlantic CR 2010-025
Figure 19: Flow chart of the ’without uid’ list processing.
DRDC Atlantic CR 2010-025
33
6
Consistency Check
The goal of the consistency check component is to identify consistent and inconsistent data among the sources and store comparison results and ship attributes. Prior to quantifying the source consistency regarding data items, the data item that can be compared must be identified. Some ship attributes can be compared, while others cannot be compared. Moreover, even for ship items that can be compared, we must make sure that at least two sources provide information about these items. Obviously, at least two data sources must be reporting on the same ship item to allow a comparison. A data item that can be compared is usually static, meaning that it will not change (or at least limited change) through time. Therefore the position is not a comparable data item. Moreover, some data items can’t be compared in the actual state of the CA. For instance, the CA does not have a functionality to compare visual images of a ship. The Table 5 describes which comparable items each data sources provide. Item ASIA SeaSpider ITU Ship Name X X X Port Name X X Flag X X Type X X X MMSI number X X CallSign X X IMO X X Table 5: Ship Items to compare. As noted in the text, comparable ship items should be static. Thus, port name (i.e., destination) is a problematic item to use in comparison.
Items to compare are user defined. From the CA Ship attributes, it can be selected which ones are going to be compared and with which kind of comparison. These settings are made in the CAParameter configuration class (see Section 3.1.4). Therefore, if data sources providing the size of the ship (as with ASIA) are added to the CA, it will be possible to add this item for comparison. This section is divided as follow: subsection 6.1 describes the consistency checking process and subsection 6.2 defines the source match and the different kinds of comparison.
34
DRDC Atlantic CR 2010-025
6.1
Consistency Checking Process
The consistency check component (see Figure 12) takes Comparison Groups as input and stores the consistency among sources and the attributes for the ship entities described by the CGs. This component’s process is illustrated in Figure 20.
The flow chart describes the consistency checking process when a single CG is taken as input. A CG, as described in Section 5.2, is an object encapsulating the information to compare about a ship entity. All the ship information to compare is contained in the CG. The consistency check algorithm, for a single CG, goes as follows: 1. Verify if the ship represented by the CG was compared. A CG was already compared if: – The Comparison Group UID is already in the ship table of the CA DB. – The Comparison Group is composed of the same number of ships as in the previous comparison. In other words, this ship is reported by the same number of sources (or less) than in the previous comparison. 2. For each item, decide if the item can be compared for that CG. An item can be compared if there are at least two sources providing non-null information for it. 3. Get the comparison type for that item (user defined): hard, soft or pattern comparison. Compare the item values among sources with the appropriate comparison mechanism. 4. Store the comparison output: a match score for each source providing non-null information for that item. 5. Store the item value for each source (having a non-null value for that item). 6. Once all items have been compared, for each remaining item (items not for comparison, e.g. position, picture id, ... ), store its value for each source providing non-null information for that item.
6.2
Items Comparison
This subsection describes the comparison component (yellow box in Figure 20) of the consistency check. The output produced when comparing ship’s items among sources is a score called match. This match reflects how the information provided by the source agrees with the information produced by the other sources. In other words, a source’s match quantifies its ability to provide information that can be confirmed by other sources, or how well the provided information matches with output from the other sources. This score is evaluated for each comparable item, for a given ship. Therefore, for a given
DRDC Atlantic CR 2010-025
35
ship entity, a match score is computed at each source, for each non-null item value, as illustrated in Table 6. Item Ship Name (I1 )
ASIA (S1 ) M(I1 , S1 )
SeaSpider (S2 ) M(I1 , S2 )
Port Name (I2 )
M(I2 , S1 )
M(I2 , S2 )
ITU (S3 ) M(I1 , S3 )
Sources Consistency X 1 M(I1 , S j ) 3 j∈Sources 1 2
X
M(I2 , S j )
j∈Sources
M(I3 , S2 )
Flag (I3 )
M(I3 , S3 )
1 2
X
M(I3 , S j )
j∈Sources
M(I4 , S1 )
Ship Type (I4 )
M(I4 , S2 )
M(I4 , S3 )
1 3
X
M(I4 , S j )
j∈Sources
M(I5 , S1 )
MMSI number (I5 )
M(I5 , S3 )
1 2
X
M(I5 , S j )
j∈Sources
M(I6 , S1 )
CallSign (I6 )
M(I6 , S3 )
1 2
X
M(I6 , S j )
j∈Sources
M(I7 , S1 )
IMO (I7 )
M(I7 , S3 )
1 2
X
M(I7 , S j )
j∈Sources
Averaged Match
1 6
X
M(Ii , S1 )
1 4
i∈Items
X
M(Ii , S2 )
i∈Items
1 6
X
M(Ii , S3 )
i∈Items
Table 6: Statistics Computation for a Ship Entity. In each cell (exception to the diagonal),
a match is computed. For each data item, the source consistency, which is the average of all matches for that item, can be computed. For each source, an average match (over all items) can also be computed. For a given ship entity, the match M(Ii , S j ), where Ii is the ith item and S j is the jth source, is a normalized score (0 ≤ M ≤ 1), computed as: N X
Sim(Ii , S j , Sk )
k=1,k6= j
, (1) N −1 where N is the total number of sources having a non-null value for item Ii . The similarity function Sim takes the results of the jth and kth sources for item i and compares them, i.e. it returns a score between 0 and 1 for each comparison: M(Ii , S j ) =
Sim : (Ii , S j , Sk ) 7→ [0, 1]
(2)
The match score described by equation 1 can be visualized with a matrix. For instance, the matches of ASIA, SeaSpider and ITU for the ship name(I1 ) and the flag(I3 ), are given in Tables 7 and 8 respectively. Note that Sim is symmetric with respect to the sources (i.e. Sim(Ii , S j , Sk ) = Sim(Ii , Sk , S j )), which reduces calculation.
36
DRDC Atlantic CR 2010-025
I1 S1
ASIA (S1 )
S2
Sim(I1 , S2 , S1 )
S3
Sim(I1 , S3 , S1 )
I3 S1 S2 S3
SeaSpider (S2 ) Sim(I1 , S1 , S2 )
ITU (S3 ) Sim(I1 , S1 , S3 )
Match M(I1 , S1 ) = (Sim(I1 , S1 , S2 ) +Sim(I1 , S1 , S3 ))/2 Sim(I1 , S2 , S3 ) M(I1 , S2 ) = (Sim(I1 , S2 , S1 ) +Sim(I1 , S2 , S3 ))/2 Sim(I1 , S3 , S2 ) M(I1 , S3 ) = (Sim(I1 , S3 , S1 ) +Sim(I1 , S3 , S2 ))/2 Table 7: Match computations for I1 .
ASIA (S1 ) SeaSpider (S2 ) ITU (S3 ) Match N/A N/A N/A N/A Sim(I3 , S2 , S3 ) M(I3 , S2 ) = Sim(I3 , S2 , S3 ) N/A Sim(I3 , S3 , S2 ) M(I3 , S3 ) = Sim(I3 , S3 , S2 ) Table 8: Match computations for I3 .
The remainder of this section is dedicated to defining the similarity function Sim. Depending on the nature of the ship item, similarity (and thus Sim) is defined differently depending on the type of comparison made. For a hard comparison, similar means exactly the same. For the soft comparison, similar results mean typographic errors are allowed. While in the case of the pattern comparison, having similar results means that some parts of both results are the same. As mentioned in section 3.1.4, the type of comparison is user-defined. In the default setting, types are set as in Table 9. Item Comparison Type Ship Name Soft Port Name Pattern Flag Hard Ship Type Pattern MMSI number Hard CallSign Hard IMO Hard Table 9: Default Comparison Types by Items
6.2.1
Hard Comparison
The hard comparison performs an exact comparison, i.e. it verifies if two sources provide the exact same information.
DRDC Atlantic CR 2010-025
37
Formally, in the context of hard comparison, the similarity function Sim is defined as: � 1, R(Ii , S j ) == R(Ii , Sk ); Sim(Ii , S j , Sk ) = (3) 0, otherwise. R(Ii , S j ) is the result of Ii provided by S j . Therefore, the match produced by a hard comparison can be simplified as: Number of sources having the same result as S j for Ii Number of sources used to compare that result Number of sources, other than S j , having exactly R(Ii , S j ) as result = , N −1
M(Ii , S j ) =
(4) (5)
where N is the total number of sources having a non-null value for item Ii . Usually, the hard comparison is preferred for items with a numeric value or items where typographic errors are unlikely to happen (e.g., flag). 6.2.1.1
Example 1
For this example, let us study a case using the MMSI ship item. The results of each source are as follow: – ASIA (S1 ): 636012464 – SeaSpider (S2 ): N/A – ITU (S3 ): 636012464 Following equation 1, the match for ASIA and ITU are M(MMSI, S1 ) =
Sim(MMSI, S1 , S3 ) = 1, 1
M(MMSI, S3 ) =
Sim(MMSI, S3 , S1 ) = 1. 1
If instead we had: – ASIA (S1 ): 636012463 – SeaSpider (S2 ): N/A – ITU (S3 ): 636012464
38
DRDC Atlantic CR 2010-025
then the matches would have been: M(MMSI, S1 ) = Sim(MMSI, S1 , S3 ) = 0 and M(MMSI, S3 ) = Sim(MMSI, S3 , S1 ) = 0, because they differ by one digit. 6.2.1.2
Example 2
For this example of hard comparison, let us consider a fictitious case using 5 data sources providing non-null results for the CallSign (I6 ): – S1 : 3FIB6, – S2 : 3FCV6, – S3 : 3FIB6, – S4 : 3FCV6, – S5 : 3FIB6. Following equation 1, the match for S1 is given by: M(I6 , S1 ) =
Sim(I6 , S1 , S2 ) + Sim(I6 , S1 , S3 ) + Sim(I6 , S1 , S4 ) + Sim(I6 , S1 , S5 ) 4
=
0+1+0+1 = 0.5. 4
In the same way, for S2 , we have: M(I6 , S2 ) =
Sim(I6 , S2 , S1 ) + Sim(I6 , S2 , S3 ) + Sim(I6 , S2 , S4 ) + Sim(I6 , S2 , S5 ) 4
0+0+1+0 = 0.25. 4 And by symmetry, the matches for the other sources are: M(I6 , S3 ) = M(I6 , S5 ) = 0.5 and M(I6 , S4 ) = 0.25. =
6.2.2
Soft Comparison
The soft comparison is based on the distance between two strings: the closer two strings are, the higher the similarity. Soft comparison is for items with a value usually described by two words or less (non-numeric value) and where typographic errors are frequent. The ship name is a typical example of a ship attribute where a soft comparison is required.
DRDC Atlantic CR 2010-025
39
For the soft comparison, the similarity function Sim is defined as: if Lev(R(Ii , S j ), R(Ii , Sk )) ≥ 0.99; 1, 0.5, if 0.85 ≤ Lev(R(Ii , S j ), R(Ii , Sk )) < 0.99; Sim(Ii , S j , Sk ) = 0, otherwise.
(6)
Lev(R(Ii , S j ), R(Ii , Sk )) is the Levenshtein score, between 0 and 1, based on the Levenshtein distance between strings R(Ii , S j ) and R(Ii , Sk ). The closer two strings are, the higher the score is (see [10] for details about Levenshtein distance). The concept of soft comparison was introduced because of the potential problems when dealing with ship names. There is greater potential for misspellings in ship names, or for abbreviations or general shortening of ship names. This causes variations in the ship names reported from the sources. For example, variations such as ”OOCL Malaysia” and ”OCCL Malaysia”, or ”King of the sea” and ”King of sea” are common. During this study, we observed that the Levenshtein metric is robust enough to handle ship name typographic errors and can be used to set a threshold value to evaluate the similarity of two ship name character strings. 6.2.2.1
Levenshtein String Comparison
The two most frequent reasons a word is misspelled (using a keyboard) are: typing mistake or phonetic mistake. Different types of algorithms are required to detect each kind of misspelling. We assumed that in the context of this study, typing mistakes (typographic errors and variations in the format) would be the cause of observed misspellings in ship names. To detect typing mistakes for relatively short expressions, the Levenshtein metric is the most frequently used. It makes the assumption that the word is not necessarily misspelled, but rather mistyped. When computing the proximity of two words with the Levenshtein metric, operations such as changing a letter, deleting or adding a character, inserting a blank space, or interchanging two adjacent letters are performed on the first word. If these steps result in the second word, then the number of steps is used to estimate how far the first word was from the second. To measure the proximity of words the Levenshtein distance notion is used. To obtain the score in percentage, the following transformation is applied: score = 1 − (number of operations/length of the longest string) Levenshtein score, which is inversely proportional to the metric, is also used in the ship matching algorithm (see Section 5.3) to match ships without UID. In that case, we rely on the ship name to identify that a ship description corresponds with another ship.
40
DRDC Atlantic CR 2010-025
6.2.2.2
Thresholds
In the ship name comparison and ship matching based on ship name, where the Levenshtein score is used, the same threshold is applied. This threshold estimates the lower bound of the Levenshtein score between a ship name and what could be considered as the same ship name but with a typographic error included. There is no widely adopted value for such a threshold. It usually varies from 0.70 to 0.90. The choice of such a threshold depends on several factors: – Average expression length: a typographic error in a short expression has a greater impact on the score than in a long expression – Discrimination between lower and upper cases: the score considers the same letter in upper and in lower cases to be different characters – Presence of white spaces in the expression: the score detects white spaces In the case of ship names, the average expression length is 11 characters (including white spaces). This average was computed from the CA DB content. Since some sources were providing ship names in capital letters while other sources only provided lower case letters, we decided to convert all expressions to lower case before the comparison. Therefore, in the CA there is no discrimination between upper and lower case when comparing expressions. Finally, since ship names are often composed of several words, we take the white spaces into account in the comparison. However, we noticed that ship names reported by ASIA occasionally included double white spaces. Therefore, all multiple white spaces are converted into a single white space prior to comparison. From our observations, we estimated that two ship names (with the above properties) differ by more than a single typographic error when their score is lower than 0.85. The following
DRDC Atlantic CR 2010-025
41
list exposes some examples of ship names encountered by the CA: Lev(”sirijius”, ”sirius”) = 0.750 Lev(”sirijus”, ”sirius”) = 0.857 Lev(”espoir”, ”espoire”) = 0.857 Lev(”grace 1”, ”grace a”) = 0.857 Lev(”calabra”, ”calabria”) = 0.875 Lev(”discovery i”, ”discovery ii”) = 0.917 Lev(”jumping jack”, ”jumpin jack”) = 0.917 Lev(”roger m. jones”, ”roger m jones”) = 0.929
Moreover, during the development of the Application Test-Bed of the Multi-Sensor Integration Within a Common Operating Environment (MUSIC) Technology Demonstration Project (TDP) (see [11]), the 0.85 Levenshtein score was selected as the typographic indicator threshold. In the context of track fusion, the Levenshtein score was used to determine if two ship names could be the same. Track pairs with a Levenshtein distance score higher than 85% were considered sufficiently similar names, and thus considered as candidates for track fusion [12]. 6.2.2.3
Example 1
Suppose that for the same ship entity, the three sources provide the following ship names: – ASIA (S1 ): ”atlantc spruce”, – SeaSpider (S2 ): ”atlantic spruce”, – ITU (S3 ): ”atlantic spruce”. Using the similarity definition given in Equation 6 and knowing that Lev(”atlantic spruce”, ”atlantc spruce”) = 0.933, we have the following matches: Sim(Ship name, S1 , S2 ) + Sim(Ship name, S1 , S3 ) 0.5 + 0.5 = = 0.5, 2 2 Sim(Ship name, S2 , S1 ) + Sim(Ship name, S2 , S3 ) 0.5 + 1 M(Ship name, S2 ) = = = 0.75, 2 2 Sim(Ship name, S3 , S1 ) + Sim(Ship name, S3 , S2 ) 0.5 + 1 M(Ship name, S3 ) = = = 0.75. 2 2
M(Ship name, S1 ) =
6.2.2.4
Example 2
As a second example, let us consider a fictitious case where four sources provide the following ship names (I1 ):
42
DRDC Atlantic CR 2010-025
– – – –
S1 : S2 : S3 : S4 :
”SIR WILLIAM ALEXANDR” ”SIR WILLIAM ALEXANDER” ”SIR WILLIAM ALEXANDR” ”Sir William Alexander”
For this case, we have Lev(”SIR WILLIAM ALEXANDR”, ”SIR WILLIAM ALEXANDER”) = 0.952, and thus Sim(I1 , S1 , S2 ) + Sim(I1 , S1 , S3 ) + Sim(I1 , S1 , S4 ) 3 Sim(I1 , S2 , S1 ) + Sim(I1 , S2 , S3 ) + Sim(I1 , S2 , S4 ) M(I1 , S2 ) = 3 Sim(I1 , S3 , S1 ) + Sim(I1 , S3 , S2 ) + Sim(I1 , S3 , S4 ) M(I1 , S3 ) = 3 Sim(I1 , S4 , S1 ) + Sim(I1 , S4 , S2 ) + Sim(I1 , S4 , S3 ) M(I1 , S4 ) = 3
M(I1 , S1 ) =
0.5 + 1 + 0.5 3 0.5 + 0.5 + 1 = 3 1 + 0.5 + 0.5 = 3 0.5 + 1 + 0.5 = 3 =
= 0.67, = 0.67, = 0.67, = 0.67.
Note that all letters are converted to lower case prior to comparison.
6.2.3
Pattern Comparison
The pattern comparison was developed to compare complex expressions having usually more than two words, such as sentences. Pattern comparison is based on the recurrence of words among the different expressions to compare. A typical example of an item requiring pattern comparison is the ship type. Ship type requires this pattern matching because of the diversity in naming or coding conventions. The ASIA system contains ship type information as recorded in the AIS messages, which uses a numeric code system to represent ship type. For example, code 89 means: Tanker(s) No Additional Information. SeaSpider attempts to determine the ship type from the web information pages that it searches. Thus, SeaSpider can acquire an assortment of ship type names. The ITU data source identifies ship type based on another (and different) coding system. For example, in the ITU system the code ”MM OIL” means Merchant Oil Tanker. With this type of diversity, the various ship type codes are first converted into text strings. These text strings are then used in the pattern comparison. For the pattern comparison, the similarity function Sim is defined as: Sim(Ii , S j , Sk ) =
Number of expressions in common between S j and Sk Number of expressions in common among all sources
(7)
Two expressions are said to be in common when their Lev(., .) score is equal or higher than 0.85. In other words, the pattern comparison searches for intersections between the complex expressions to compare, and these intersections are built based on the soft similarity.
DRDC Atlantic CR 2010-025
43
Prior to running the pattern comparison, expressions to be compared are pre-processed. Meaningless expressions such as: ”ship”, ”vessel”, ”boat”, ”/”, ”.” and ”,” are removed. 6.2.3.1
Example 1
Suppose that for the same ship entity, three sources provide the following ship types: – ASIA (S1 ): ”Tanker Providing no Additional Information”, – SeaSpider (S2 ): ”Oil Products Tanker”, – ITU (S3 ): ”Merchant oil tanker”. The expressions in common among all sources are ”tanker” and ”oil”. The matches are thus M(Type, S1 ) =
Sim(Type, S1 , S2 ) + Sim(Type, S1 , S3 ) 1/2 + 1/2 = = 0.5 2 2
Sim(Type, S2 , S1 ) + Sim(Type, S2 , S3 ) 1/2 + 2/2 = = 0.75 2 2 Sim(Type, S3 , S1 ) + Sim(Type, S3 , S2 ) 1/2 + 2/2 M(Type, S3 ) = = = 0.75 2 2 M(Type, S2 ) =
Note that all three comparisons fail the 0.85 threshold.
6.2.3.2
Example 2
Again, suppose three sources provide the following ship types: – ASIA (S1 ): ”Passengers ship”, – SeaSpider (S2 ): ”Passenger/Ro-Ro cargo ship”, – ITU (S3 ): ”pleasure/leisure passenger ship”. After pre-processing, the types to compare are: – ASIA (S1 ): ”Passengers”, – SeaSpider (S2 ): ”Passenger Ro-Ro cargo”, – ITU (S3 ): ”pleasure leisure passenger”. The intersection of expressions among all sources is {passenger}. Using Equations 1 and 7, the matches are thus M(Type, S1 ) =
Sim(Type, S1 , S2 ) + Sim(Type, S1 , S3 ) 1/1 + 1/1 = =1 2 2
and similarly M(Type, S2 ) = M(Type, S3 ) = 1.
44
DRDC Atlantic CR 2010-025
Figure 20: Consistency check component process
DRDC Atlantic CR 2010-025
45
7
Data Model
This section describes how the statistics are computed from the match scores and used to described a source’s consistency. It describes how a source’s consistency is tracked in time and also gives explanations about how the data and the statistics are stored.
7.1
Multi Dimensional Representation of the Data
For a given ship, a match score is computed at each source, for each non-null item value, following Equation 1, Section 6.2. Since the match M(Ii , S j ) of source S j at item Itemi will differ from ship to ship, we’ll introduce the notation M(Ii , S j , Shipk ) to describe the match score computed at source S j for item Ii , for a given ship Shipk . All matches evaluated for a given source can be averaged over all ships and over all items, as illustrated in Figure 21. At the bottom level of the diagram, there are the computed
Figure 21: Averages over matches: Decomposition of sources in items, decomposition of
item in ships. matches for source 1 and the ship’s item Name, for all ships: M(Name, Source 1, Ship1 ) = 0.5, M(Name, Source 1, Ship2 ) = 1.0, ..., M(Name, Source 1, ShipN ) = 1.0. The middle level contains the averaged matches computed at source 1 for the items Name, Flag, etc. Using Name as an example, the average is evaluated among all ships using: N X
M(Name, Source 1, Shipk )
k=1
. (8) N The averaged match assessed to Source 1 is displayed in the top level of the diagram. The average is evaluated among all ships and all items: M X N X
M(Ii , Source 1, Shipk )
i=1 k=1
MN
46
,
(9)
DRDC Atlantic CR 2010-025
where M is the total number of ship items. This averaged match is a general assessment of the source consistency. Because the Match involves three parameters, it can be visualized within a three dimensional space. Let us use a cube to visualize all the match scores and all statistics that can be computed from it. The cube has a Source axis (Y axis in a Cartesian referential), an Item axis (X axis in a Cartesian referential) and a Ship axis (Z axis in a Cartesian referential). Figure 22 illustrates a single match M(Name, Source 1, Ship1 ) as a point in the cube. In Figure 23, the average of matches at Source 1 over all ships for the Name item is illustrated as the gray vertical column. This column represents the area involved in the evaluation of Equation 8. It means that we consider the matches of all ships for Source 1 (S1 on the Source axis) and item Name (Ii on the Item axis). This average represents a general assessment of the source consistency, for a given item. Finally, Figure 24 illustrates the averaged value of the Source 1 matches over all ships and all items. The gray box represents the area involved in the evaluation of Equation 9. It means that we consider the matches of all ships and all items for Source 1 (S1 on the Source axis). This average represents a general assessment of the source consistency.
7.2
Consistency Evolution in Time
There is no tracking of the source consistency per ship. When the items of a ship have been compared between two or more sources, the evaluation of this ship is considered complete. When new reports or activities are loaded for that ship, there are two possible options: 1. If a new source reports information about this ship, i.e. this source was not utilized when the items of that ship were initially compared, then the consistency results are updated for that ship. 2. If this ship is reported by the same sources (or fewer) than in the previous comparison, there is no update of consistency results. Tracking of the source consistency per ship was considered, but this option was rejected because of technical reasons. To update the consistency at every report/activity recorded by one of the data sources would have introduced a serious risk of creating a high-transaction volume environment and/or with bulky messages (XML). Messages flowing from data sources to CA have a large volume, and for high-transaction volume environments, XML parsers fail to process bulky messages efficiently and thus congest the bandwidth. See Section 10.2 for details about this architectural decision and recommendations related to the decision of introducing tracking into the framework. Since the goal is to assess the source consistency in general, not to track consistency for a
DRDC Atlantic CR 2010-025
47
Figure 22: Value for one ship of one item of the source. The gray dot represents the match
value between the name of ship1 as provided by source1, compared to the names for the same ship from other sources. particular ship, the evolution of a source consistency check will be done by the evolving statistics provided by the addition of new ships. When ships are added, statistics are building up. Using the cube visualization, it means that when new ships are compared, the cube height increases. Since ships are piling up on the cube, the ship on the top of the cube has the latest (more recent) time stamp (see Figure 25).
If consistency evolves in time then statistics could be taken on the latest slices of the cube to reflect that evolution. There are currently two ways to assess the consistency within a time window: 1. By deleting old data. 2. By filtering. The first approach is an irreversible solution. It cannot be undone since data is deleted from the table. However whether or not consistency was checked for a ship, since old data are
48
DRDC Atlantic CR 2010-025
Figure 23: Statistics for one item of the source.
erased, any new reports from this ship will generate a new consistency check. With the second approach, new data from a ship previously processed will still be filtered out because the filter will be based on the time stamp of the consistency check. Since the old checks are still in the table their time stamp may be outside the specified filter time window. Time filtering is illustrated using the cube in Figure 26. Both of these mechanisms are implemented in the CA web client.
7.3
Consistency Application Database
The consistency database is a major component in the framework. It contains the comparison results and ship attributes. This database is exposed with a web service to the framework and is used by the CA client to display comparison results. The consistency DB is a MySQL database that was designed to be extensible, i.e. it is possible to easily add information fields. Moreover, the consistency database is easy to
DRDC Atlantic CR 2010-025
49
Figure 24: Overall statistics for a source.
maintain. There is no excessive storage, statistics (averages) are computed by the application instead of being stored. The consistency DB is made up of six tables: – itemTable: Contains all ship items, regardless of use in a comparison by the CA. – sourceTable: Contains all data source names, and information about their role in the CA: used for comparison, AS, position source, time stamp of the latest report/activity. – statisticTable: Contains the types of statistics stored for the comparisons. For the moment, there is only the match. – shipTable: Contains all ships for which comparison have been performed between sources. – informationTable: Contains the value for each ship’s item, reported by all sources, and the time stamp provided by the source as associated with each entry. This table is used mainly by the CA web client to retrieve ship information. – consistencyTable: Contains all matches.
50
DRDC Atlantic CR 2010-025
Figure 25: Ships are added and statistics is building up.
Figure 26: Time filtering of consistency statistics.
7.4
Database Population
The SeaSpider and ASIA applications are intended to run continually, adding information to their respective DBs at regular time intervals. In order to process the new information added to the SeaSpider and ASIA databases, a mechanism is implemented to populate the CA tables on a scheduled time interval. This mechanism is described below. 1. At 4 hour intervals (i.e., an arbitrary time interval), the data source web services are used to query the data source to determine if new information exists at the data source (e.g., new reports or activities). The output of this step is a list of ship names that have new reports or activities available from the data source since the time of the last query. This process is detailed in the following steps: (a) Query each data source to learn if new activities/reports were recorded since a
DRDC Atlantic CR 2010-025
51
specific date. In the source table of the CA DB, the lastEntry field will correspond to the date when the last activity/report was acquired from each data source (i.e., value is initially at 0). It is this lastEntry value that is used to query the data sources to retrieve new information. Note that static data sources such as the ITU won’t return any new information (and therefore the lastEntry field is not updated). For the moment, it is expected that only ASIA and SeaSpider web services will produce new information between queries, but the architecture allows the additions of other dynamic data sources (see document about the addition of data sources [1]). (b) The result of each query to the specific data source is a list of ship names having new reports or activities recorded by the data source since the lastEntry date value. (c) Note that the first time this step is performed (i.e., when all data sources lastEntry value is set to 0), the returned list of ship names will include all ASIA and SeaSpider ship names. 2. For each name in the name list created by the query above, query all data sources for additional information on that ship. If the name consists of more than 4 letters, the query is constructed using the first four letters of the ship name plus a wild card character. Otherwise, the query uses the exact ship name. That way, each data source returns a list of ships with similar names, thus maximizing the likelihood of the source returning a name that may be matched to the original ship name. An internal list of query names (4 letters names) is maintained to avoid executing the query more than once with the same name. This list is dropped at the end of this step. 3. Store the new lastEntry value for each data source. 4. The responses from the data sources are aligned with the CA vocabulary, i.e. a CA ship object is created for each data source response. This step ensures the vocabulary used for parameters returned from each data source is consistent with the vocabulary of the CA. 5. Send the source responses to the Ship Matching algorithm. 6. Verify if the Comparison Groups produced by the Ship Matching process were already compared. A CG was already compared if: – The Comparison Group UID is already in the ship table of the CA DB. – The Comparison Group is composed of the same number of ships as in the previous comparison. In other words, this ship is reported by the same number of sources (or fewer) than in the previous comparison.
52
DRDC Atlantic CR 2010-025
If one of these conditions is not respected, then a consistency check is made on the CG and the resulting scores and ship attributes are stored in the consistency and information tables, respectively.
DRDC Atlantic CR 2010-025
53
8
Consistency Application Web Service
The CA Web Service, called CAService, is a web service interface to the CA DB. The CA web service only exposes the information contained in the CA DB, without the possibility of modifying its content. Similar to the ASIA and SeaSpider services, this implementation means the CA continues to be responsible for updating the CA database, while the CA web service is responsible for providing those data to other applications. The main purpose of the CA WS is to give access to the statistics on source consistency produced by the CA. The CA web service also offers an operation which returns data pertaining to specific ships depending on the input query parameters. In the CA DB, a ship is uniquely defined by the combination of its MMSI and call sign. In this case, the returned data from the service contains the ship name plus other complex data types containing static and dynamic information specific to the ship.
8.1
Operations
The operations offered by the CA web service are described in Table 10. The getInformation operation retrieves all ships from the CA DB that matches the query parameters. It provides source consistency among sources, at the ship level. getSourceStatistics gets the source consistency statistics. It associates an average score (on all items and all ships corresponding to the input time window) for each source, and an average score (on all ships corresponding to the input time window) for each item. Finally, the operation deleteHistory deletes everything in the CA DB related to ships with a time stamp equal or smaller than the input time. Name getInformation getSourceStatistics deleteHistory
Input Output Query Array of ShipStat String fromDate, String toDate Array of SourceStat String toDate Table 10: CA Web Service Operations
8.2
Data Model
The Query object (input of getInformation) is described in Figure 27. Operation getInformation returns an array of ShipStat objects, where each ShipStat object contains an array of ItemStat objects, with a SourceStat object associated to each ItemStat (see Figure 28). The output of getSourceStatistics is composed with the same objects, but
54
DRDC Atlantic CR 2010-025
embedded differently. The response is an array of SourceStat, with an array of ItemStat associated to each SourceStat ( see Figure 29).
Figure 27: Query data structure for CA web service. The Query object is the input of the operation getInformation.
Figure 28: Output structure of the operation getInformation. Note that itemList of
SourceStat is always empty.
DRDC Atlantic CR 2010-025
55
Figure 29: Output structure of the operation getSourceStatistics. Note that
sourceList of ItemStat is always empty.
56
DRDC Atlantic CR 2010-025
9
Consistency Application Client
The CA web client is used to visualize the CA comparison results and to geo-locate the ship’s information. It communicates with the CA web service to get comparison results for ships corresponding to query parameters and with the ASIA web service to get the ship picture, when it’s available (see Figure 30).
Figure 30: Consistency Application web client interaction with the Compare-MDA frame-
work. The client queries the CA web service to get the comparison results and the ASIA web service for the pictures. The web client uses the Google Earth Application Programming Interface (API) [13] for KML-based visual output. The Google Earth (GE) API is a JavaScript library used to add Earth plug-in objects on web sites. It provides programmatic access to the plug-in objects and the features inside of them. Using the API facilitates interaction between standard HTML elements and GE plug-in instances. No KML file is generated, because GE API handles object creation and display. The use of GE API enables the use of the GE 3D display directly within the CA client, therefore removing the burden of navigating through different application windows (GE and the web browser in this particular case). However, this solution limits portability of the client to the Windows platform only, since the GE API uses WinCOMM API, which is only available on the Microsoft Operating System. The complete description of all client components and functionalities is provided in the User Manual [14].
DRDC Atlantic CR 2010-025
57
9.1
Mapping Between Display Components and the Cube
This section links the three-dimensional visualization of the consistency statistics with the CA client display components. In the display, statistics are shown in two different components: Comparison window’s Item table and Source Consistency table.
9.1.1
Statistics at the Ship Level: Item Table
An item table is displayed on the web page for each ship that was used by the CA for comparison. Therefore, elements of the Consistency column of the item table correspond to a single slice of the cube, corresponding to the ship level (see Figure 31).
Figure 31: Match scores of the web page item table are located in a single slice of the cube. In this example, the slice is made at the level of OOCL Malaysia.
The slice is made at the Ship axis, resulting in a rectangle made with the Source and Item axes of the cube. The resulting rectangle is illustrated at the bottom right of Figure 32.
58
DRDC Atlantic CR 2010-025
Each cell of this rectangle corresponds to a match displayed in the item table. Moreover, the consistency among sources, which is represented by a traffic light visualization, is the average of the matches over sources. This average uses all cells in the gray row (i.e., lower right panel) in Figure 32.
Figure 32: Each match displayed in the web page item table corresponds to a cell in the
cube. All matches of the table thus correspond to an entire slice of the cube. The slice is made at the Ship level (OOCL Malaysia ship). The averaged consistency among sources is computed with the gray cells of the cube.
9.1.2
Statistics at the Source and Item Levels: Source Consistency Table
The Source Consistency web page table has a row for each ship item (see Figure 33). Each data source has an accompanying column. The intersection of the row (i.e., ship item) and the column (i.e., data source) contains a number, in percent, which represents the average of the source match scores over all ships. The Total row includes the average consistency for each source. This average is computed over the source match scores for each item. It assesses a global consistency score for the source. All information contained in this table is the result of average computations performed on the cube. Each cell (except cells at the Total row) contains an averaged value computed
DRDC Atlantic CR 2010-025
59
with data contained in a column of the cube (see Figure 33). The global consistency for a source is computed with the data contained in a vertical slice of the cube.
Figure 33: The average consistency of a source, for a given item is computed using the matches contained in a single column of the cube. In this example, the ITU consistency for flag is computed using the match scores in the column starting at the intersection of ITU and Flag. The general source consistency is computed with the matches contained in a vertical slice of the cube. In that example, the ASIA consistency is an average of the matches contained in the slice made at the ASIA source.
60
DRDC Atlantic CR 2010-025
10
Suggested Enhancements
This concluding section suggests improvement to be made to enhance the Compare-MDA framework. It also points out problems that will persist and may affect the framework.
10.1
ASIA Database
We suggest to migrate ASIA DB from Microsoft Access to MySQL for the following reasons: 1. Remote access. The remote access (from another computer on the same network) of an Access DB is very tricky. In the context of SOA, remote access to data stores should be possible, otherwise it limits possible configurations. For instance, the fact that ASIA data is in an Access DB forces one to deploy the ASIA WS on the same machine as where the ASIA DB is located. Since a web container is required to deploy a service, it forces one to have a web container running on the same machine as the ASIA DB. For future developments using the ASIA WS this may become a serious constraint. Remote access to a DB hosted by MySQL is quick and simple. MySQL provides standards-based drivers for JDBC, ODBC, and .Net enabling developers to build database applications in their language of choice. 2. Management of large databases. Access is not commonly used for large databases (e.g. hundreds of megabytes in size). MySQL can manage hundreds of megabytes of data, and more. 3. Multiple-user access. Although Access provides some data sharing capabilities, this is not really its strength. It has the feel of a single-user DBMS designed for local use. MySQL, on the other hand, easily handles many simultaneous users. It was designed from the ground up to run in a networked environment and to be a multi-user system that is capable of servicing large numbers of clients. 4. Cost. MySQL is free. Access is not. 5. Community. MySQL has a very large user and developer communities. Therefore a lot of documentation, examples and forums are freely available on the Web. Having access to these resources ease the development and maintenance tasks. This is not the case with Access. 6. Hardware choices. MySQL runs on several platforms; Access is a single-platform application. With an Access DB, the choice of hardware is limited through the use of the Microsoft operating systems. 7. Security. When Access tables are stored locally, it is easy to gain access to the tables. It’s possible to assign a database password, but many people routinely neglect to do so. When tables are stored in MySQL, the MySQL server manages security. Anyone attempting to access the data must know the proper user name and password for connecting to MySQL.
DRDC Atlantic CR 2010-025
61
8. Backup management. Migrating data to MySQL provides a benefit for backups and data integrity. With Access databases centralized in MySQL, data can be backed up using the regular MySQL backup procedures that already exist.
10.2
Consistency Tracking per Ship
Section 9.1.1 showed two figures, both of which contain a table showing the visual representation of the consistency calculation. This visual representation includes traffic-light colors indicating the consistency scores for data items of a single ship. We note here that there is no tracking of the data items temporal consistency. This means that we do not know any temporal changes in the consistency scores for those data items. Technical reasons motivated this choice. Updating the consistency scores at every report/activity recorded by one of the data sources would have introduced a serious risk of creating a high-transaction volume environment and/or with bulky messages (XML). The data source services were designed for re-usability. They were designed to expose their respective database, and they are loose-coupled to the CA. The downside of this aspect is that messages sent to the CA contain more information than is currently required. For instance, in the case of the ASIA web service (see Section 2.1.1), information about the ship’s size, estimated time of arrival, navigational status, rate of turn and much more are sent to the CA. Even if this information is not processed by the CA, the SOAP messages still need to be parsed. This parsing, when executed at high-frequency rate, may overload the system and increase chances for failure. Some architectural modification would have to be made to enable the tracking of a source consistency per ship. Loose-coupling allows possibility of reuse and scalability, but may introduce performance overhead for large number of users, services or traffic. On the other side, tight coupling limits the design scalability but allows high performance. Introducing tight coupling at the level of the communication between the data source services and the CA would be the way to enable source consistency tracking per ship, without adversely affecting performance. In concrete terms, it means the addition of operations for the ASIA and SeaSpider services dedicated to the CA. These operations would take as input only the ship name as parameter and would return only ship items that are currently compared by the CA or required by it (e.g. position, image ID,...). The use of such an operation would improve the CA performance in a tracking context, but reduce its usability. To illustrate the downside of such tight-coupling, let us consider the following situation. Suppose that two data sources are added to the framework. This addition would probably bring the opportunity to compare more ship items than the current six (name, port, type, flag, call sign and MMSI). In a tight-coupled framework, where data sources offer operations tailored for the CA, there is a high risk that these new comparison requirements have
62
DRDC Atlantic CR 2010-025
an impact on the other data source services. The operations designed for the CA would probably have to be modified to also return those new items to compare, if available. For the moment, loose-coupling was prioritized and that is why there is no tracking of a source consistency per ship. If for future applications, performance becomes an issue, we recommend to identify situations where high performance is indispensable and introduce levels of tight coupling. Otherwise, loose coupling should be prioritized. If there are still bottlenecks, unacceptable performance should be addressed on a case by case basis by developing services to encapsulate the tightly bound modules. Services introducing tight coupling must be isolated with the underlying architecture and data models, until they can be replaced by high performing loosely coupled components.
10.3
Vocabulary Solution
As mentioned in Section 4, the vocabulary solution is also used to align, when possible, the country name. It modifies some flag value to use a more common country naming. For instance, it changes ”Russian Federation” to ”Russia”. It is expected that other cases implying different country names for the same country will arise. It is recommended to compare all country appellations for SeaSpider and ITU to find such differences. In the cases where a difference is found, it is straightforward to add a rule in the Vocabulary Solution to modify the country name, like described above. As described in Section 6.2.3, the pattern comparison was developed to enable comparison of complex, self-describing items, such as ship type. The main advantage of this approach to compare ship types is that it is independent of any dictionary. Since there is no common naming convention for ship types, another approach would be to have a ship type lexicon describing all the equivalences in type descriptions (e.g., cargo and freight). This lexicon would be developed by MDA experts and it would contain a ship type naming convention. The vocabulary solution could use that ship type naming convention to align all ship types coming from the diverse data sources. That way, the pattern comparison would not be required anymore and the comparison of ship types among sources would be simply based on string similarity.
10.4
Time Dependant Items Comparison
Among all items used for comparison, some are time dependent. For instance, the port name (i.e., destination) will change through time. When comparing information sources, there is no check made on the time when the information was produced. If the port name is reported by two sources, they will be compared, disregarding when the destination was reported. It is clear that if this information was reported at two different periods the probability of a match will be small.
DRDC Atlantic CR 2010-025
63
Similar observations can be made with the ship type. Ship type may change through time. For instance, a cargo carries goods and materials from one port to another. This merchandise will probably change through time, from one port to another. However, it is expected that the port name will change more frequently than the ship type. The architecture of the CA easily allows the removal of a ship’s item from the comparison. If it is deemed necessary, the port name, and even the ship type, can be removed from the list of items for comparison.
10.5
Addition of Digital Seas as a Data source
The next step to enhance the Compare-MDA framework would be to add another data source. The addition of a data source to the CA would lead to a better understanding of the source consistency. It would also allow the addition of new items to the comparison mechanism and thus increase the meaning of the consistency statistics. Moreover, this additional data source wrapped as a web service could be reused for means other than the item comparison. We suggest to add the Digital Seas 4 data as a data source. The same mechanism that was used for ITU (see Section 2.3) can be applied to the Digital Seas website: interfacing with the website to fill a local DB and then expose this DB with a web service. Digital Seas data is based on AIS and also provides ship photographs. It provides freely the following information: – Name, – MMSI, – IMO, – Call sign, – Flag, – Vessel Type, – Type of Cargo, – Width, – Length. For paying members, it provides real time AIS position: – Nav Status, – Max Draught, – Speed, – Course, – Destination, 4. http://www.digital-seas.com/
64
DRDC Atlantic CR 2010-025
– Arrival UTC – Last Report Location. The position could also be used to geo-locate the information on GE maps (see next Section 10.6). The Digital Seas data source, wrapped as a web service, could be re-used for other purposes. Since it provides the ship photograph, it could be used with ASIA to prototype ship photograph comparisons for instance.
10.6
Position of the Information on Visual Display
The data source providing the position for geo-location on the GE display is user defined (done with CAParameter, see 3.1.4). For the moment, ASIA is providing the position. ASIA is the only data source providing positional information. SeaSpider only provides the position of the ports visited by the ships. The downside of having ASIA as a position provider is that all ships are located in the same area: close to DRDC Atlantic Dartmouth. If other ASIA systems are installed throughout the country, it would bring diversity in the ship locations. Otherwise, if other data sources with real time positional information (e.g., Digital Seas) are added to the framework, then it would be worthwhile to change the position data source in the CA.
10.7
Selection of the Ship Image
The image displayed on the CA web client is a photograph taken by the ASIA system. The ASIA web service was developed so that when the operation getLatestInformation is invoked, the information of the last report of each ship satisfying the query is sent in the response (see 2.1.1.1 for details about ASIA WS operations). With this last report information, comes the last photograph of the ship taken. Since the CA uses this operation, the ship image displayed on the web client is the last picture taken by ASIA for that ship. This last picture may not be the best clearest photograph available. For instance, some pictures are taken at night. Therefore, the ASIA WS could be modified to have an operation similar to getLatestInformation, but with a filter on the ship photograph. In the ASIA DB, there is a field used to indicate if the photo was taken at night. This field is also returned in the getLatestInformation response, encapsulated in the Image object (see Picture 3 in Section 2.1.1.2). This parameter could be used to filter out pictures taken at night.
DRDC Atlantic CR 2010-025
65
10.8
ITU Information Extraction
The ITU application queries the ITU website to get information about a ship. The response is parsed by the application to extract the relevant information. The parsing is HTMLstructure dependent. It means that it uses the exact layout of the HTML response to retrieve the information. In the case of a modification in the website’s search page output, the extraction would be compromised. As mentioned in Section 2.3.1.1, the impact of a change in the website design on the ITU WS is limited. If the response can’t be parsed correctly, no ship description will be sent back by the ITU WS. To fix the sensitive parsing issue, we propose to use the freely available content analysis tool Alchemy API 5 . Among all the features offered, the Text Extraction / Web Page Cleaning automatically ”clean” web pages, removing navigation links, advertisements, and other undesirable content 6 . The free version of the API allows up to 30,000 API calls a day. The use of this tool would remove the dependency of the parsing process on the HTML tag structure.
5. http://www.alchemyapi.com/ 6. On line demo available at http://www.alchemyapi.com/api/demo.html.
66
DRDC Atlantic CR 2010-025
References [1]
St-Hilaire, M.-O. and Mayrand, M. (2010), Installation and Developer Guide for the MIKM Consistency Application, (DRDC Atlantic CR 2010-057) Defence R&D Canada – Atlantic.
[2]
Hammond, T. R. (2008), Automated ship image acquisition, In Society of Photo-Optical Instrumentation Engineers (SPIE) Conference Series, Vol. 6963 of Presented at the Society of Photo-Optical Instrumentation Engineers (SPIE) Conference.
[3]
(2005), SOAP Message Transmission Optimization Mechanism, W3C Recommendation (online), W3C, http://www.w3.org/TR/soap12-mtom/.
[4]
(2006), MTOM Guide -Sending Binary Data with SOAP (online), Apache Software Foundation - Axis2, http://ws.apache.org/axis2/1_0/mtom-guide.html.
[5]
Tatar, S. and Chapman, D. M. F. (2008), SeaSpider: automated information gathering on vessel movements in support of marine intelligence, surveillance, and reconnaissance, In Society of Photo-Optical Instrumentation Engineers (SPIE) Conference Series, Vol. 6945 of Optics and Photonics in Global Homeland Security IV.
[6]
(2004), RDF/XML Syntax Specification, W3C Recommendation (online), W3C, http://www.w3.org/TR/REC$-$rdf$-$syntax/.
[7]
(2004), OWL Web Ontology Language, W3C Recommendation (online), W3C, http://www.w3.org/TR/owl-features/.
[8]
The Ontology Alignment Source (online), Lockheed Martin, http://www.atl.lmco.com/projects/ontology/index.html.
[9]
White, Jules, Kolpackov, Boris, Natarajan, Balachandran, and Schmidt, Douglas C. (2005), Reducing application code complexity with vocabulary-specific XML language bindings, In ACM-SE 43: Proceedings of the 43rd annual Southeast regional conference, pp. 281–287, New York, NY, USA: ACM.
[10] Levenshtein, Vladimir I. (1966), Binary codes capable of correcting deletions, insertions, and reversals, Soviet Physics Doklady, 10(8), 707–710. [11] Multi-Sensor Integration Within a Common Operating Environment (MUSIC) Technology Demonstration Project (TDP) (online), Defence Research and Development Canada - Atlantic, http: //www.atlantic.drdc$-$rddc.gc.ca/factsheets/pdf/TD0507$\_$eng.pdf. [12] Lefebvre, E. (2006), Application Development for Multi-Sensor Integration within a Common Operating Environment (MUSIC), Software Design Description, (DRDC Ottawa CR 2006-300) Defence R&D Canada – Ottawa. [13] (2010), Google Earth API (online), Google, http://code.google.com/apis/earth/.
DRDC Atlantic CR 2010-025
67
[14] St-Hilaire, M.-O. (2010), User Manual for the MIKM Consistency Application, (DRDC Atlantic CR 2010-056) Defence R&D Canada – Atlantic.
68
DRDC Atlantic CR 2010-025
List of symbols/abbreviations/acronyms/initialisms AIS API AS ASIA CA CG DB GE GUI HTML IMO ITU MDA MTOM MUSIC OWL RDF SOA TDP UDDI UID WS XML
Automatic Identification System Application Programming Interface Authoritative Source Automated Ship Image Acquisition Consistency Application Comparison Group Database Google Earth Graphical User Interface HyperText Markup Language International Maritime Organization International Telecommunication Union Maritime Domain Awareness Message Transmission Optimization Mechanism Multi-Sensor Integration Within a Common Operating Environment Web Ontology Language Resource Description Framework Service Oriented Architecture Technology Demonstration Project Universal Description Discovery and Integration ship unique identifier Web Service eXtensible Markup Language
DRDC Atlantic CR 2010-025
69
Glossary Authoritative Source A source of data which is considered to be the authority for this type of data. The International Telecommunication Union is being used in this work as the authoritative source for ship attribute data. Comparison Group An object which will contain all ships objects corresponding to the same ship entity, including the Authoritative Source ship. Match Score between 0 and 1 quantifying a source’s ability to provide information that can be confirmed by other sources. A match is computed for a source at a ship’s item and for a given ship entity. A match of 0 indicates that the information provided by the source is not consistent with the other source results, while a match of 1 means that all sources provide the same ship item’s value for the given ship entity. Ship attribute A characteristic of a ship and the value associated with the characteristic. An example of a ship attribute would be call sign. The value associated with this characteristic might be CGDG. Ship entity A single physical unit which is a ship. Ship item Same as ship attribute.
70
DRDC Atlantic CR 2010-025
Distribution list DRDC Atlantic CR 2010-025
Internal distribution 1
F. Desharnais
1
B. Grychowski
1
T. Hammond
2
A. W. Isenor (1 hardcopy; 1 CD)
1
L. Lapinski
1
M. Lefrancois
1
A. MacInnis
1
M. McIntyre
1
S. Webb
3
Library (1 hardcopy; 2 CDs)
Total internal copies: 13
External distribution 1
Library and Archives Canada, Atten: Military Archivist Governments Records Branch
1
NDHQ/DRDKIM 2-2-5
1
Steve Horne DRDC CORA MARPAC JTFP Victoria, BC, V9A 7N2
2
Marie-Odette St-Hilaire (1 hardcopy; 1 CD) OODA Technologies Inc. 4891 Av. Grosvenor, Montreal Qc, H3W 2M2
1
Laura Ozimek DSTM 5 DRDC Corporate 305 Rideau Street Ottawa
1
Roy Mitchell NDHQ - 101 Colonel By Drive Ottawa Ontario, K1A 0K2
1
Stephane Paradis DRDC Valcartier 2459 Boul. Pie XI Nord Qu´ebec, G3J 1X5
DRDC Atlantic CR 2010-025
71
1
Jean Roy DRDC Valcartier 2459 Boul. Pie XI Nord Qu´ebec, G3J 1X5
1
Andrew Wind MARLANT HQ 3rd Floor Room 311 Halifax, NS, B3K 5X5
1
Benny Wong DRDC Corporate 305 Rideau Street Ottawa
Total external copies: 11 Total copies: 24
72
DRDC Atlantic CR 2010-025
DOCUMENT CONTROL DATA (Security classification of title, body of abstract and indexing annotation must be entered when document is classified)
1.
ORIGINATOR (The name and address of the organization preparing the document. Organizations for whom the document was prepared, e.g. Centre sponsoring a contractor’s report, or tasking agency, are entered in section 8.)
OODA Technologies Inc. 4891 Av. Grosvenor, Montreal Qc, H3W 2M2 3.
2.
SECURITY CLASSIFICATION (Overall security classification of the document including special warning terms if applicable.)
UNCLASSIFIED
TITLE (The complete document title as indicated on the title page. Its classification should be indicated by the appropriate abbreviation (S, C or U) in parentheses after the title.)
Determining the consistency of information between multiple systems used in maritime domain awareness 4.
AUTHORS (Last name, followed by initials – ranks, titles, etc. not to be used.)
St-Hilaire, M.-O. 5.
DATE OF PUBLICATION (Month and year of publication of document.)
6a.
July 2010 7.
NO. OF PAGES (Total containing information. Include Annexes, Appendices, etc.)
88
6b.
NO. OF REFS (Total cited in document.)
14
DESCRIPTIVE NOTES (The category of the document, e.g. technical report, technical note or memorandum. If appropriate, enter the type of report, e.g. interim, progress, summary, annual or final. Give the inclusive dates when a specific reporting period is covered.)
Contract Report 8.
SPONSORING ACTIVITY (The name of the department project office or laboratory sponsoring the research and development – include address.)
Defence R&D Canada – Atlantic P.O. Box 1012, Dartmouth, Nova Scotia, Canada B2Y 3Z7 9a.
PROJECT NO. (The applicable research and development project number under which the document was written. Please specify whether project or grant.)
Project 11HL 10a. ORIGINATOR’S DOCUMENT NUMBER (The official document number by which the document is identified by the originating activity. This number must be unique to this document.)
9b.
GRANT OR CONTRACT NO. (If appropriate, the applicable number under which the document was written.)
W7707-098207 10b. OTHER DOCUMENT NO(s). (Any other numbers which may be assigned this document either by the originator or by the sponsor.)
DRDC Atlantic CR 2010-025 11.
DOCUMENT AVAILABILITY (Any limitations on further dissemination of the document, other than those imposed by security classification.)
( X ) Unlimited distribution ( ) Defence departments and defence contractors; further distribution only as approved ( ) Defence departments and Canadian defence contractors; further distribution only as approved ( ) Government departments and agencies; further distribution only as approved ( ) Defence departments; further distribution only as approved ( ) Other (please specify):
12.
DOCUMENT ANNOUNCEMENT (Any limitation to the bibliographic announcement of this document. This will normally correspond to the Document Availability (11). However, where further distribution (beyond the audience specified in (11)) is possible, a wider announcement audience may be selected.)
13.
ABSTRACT (A brief and factual summary of the document. It may also appear elsewhere in the body of the document itself. It is highly desirable that the abstract of classified documents be unclassified. Each paragraph of the abstract shall begin with an indication of the security classification of the information in the paragraph (unless the document itself is unclassified) represented as (S), (C), (R), or (U). It is not necessary to include here abstracts in both official languages unless the text is bilingual.)
Multiple public web sites can be used to obtain ship-related information that is relevant to maritime domain awareness (MDA). However, the quality or timeliness of this information can be suspect. In this work, a software application, called the consistency application, is developed for the cross comparison of ship-related information from multiple data sources. The consistency application allows a researcher to cross compare the information from these multiple data sources and generate a comparison score for the source specific ship information and also for the data source as a unit. This allows the researcher to assess the consistency of the information provided from the data source as compared to other sources. The consistency application presently links the Automated Ship Image Acquisition (ASIA) system and the SeaSpider application. Information from the International Telecommunication Union is also utilized as both a data source and a means to identify single ship entities.
14.
KEYWORDS, DESCRIPTORS or IDENTIFIERS (Technically meaningful terms or short phrases that characterize a document and could be helpful in cataloguing the document. They should be selected so that no security classification is required. Identifiers, such as equipment model designation, trade name, military project code name, geographic location may also be included. If possible keywords should be selected from a published thesaurus. e.g. Thesaurus of Engineering and Scientific Terms (TEST) and that thesaurus identified. If it is not possible to select indexing terms which are Unclassified, the classification of each should be indicated as with the title.)
trust consistent information multiple information sources maritime domain awareness MDA
This page intentionally left blank.