Deterministic Replay of System’s Execution with Multi-target QEMU Simulator for Dynamic Analysis and Reverse Debugging Pavel Dovgalyuk Institute for System Programming of the Russian Academy of Sciences Moscow, Russia
[email protected] I.
II.
INTRODUCTION
Deterministic replay is a technology that allows capturing the execution of a running virtual machine for later replay. It is useful for debugging failures that are not easily reproduced, capturing execution traces, dynamic analysis of the software, and so on. The examples of bugs that are hard to reproduce are the following: -
Non-deterministic bugs, e.g. caused by races of the different threads or applications. When bug is recorded, it can be replayed again and again, and thus, it is no longer non-deterministic. - Pseudo non-deterministic bugs, when process of reproducing bugs is not clear. Recorded log can be used instead of the error description reproducing process. - Bugs that occur with complex environment. E.g. bugs in communications of remote processes. Complex environment is not required to be prepared again before each debugging session, because all interaction is recorded in events log. - Heisenbugs. These bugs cannot be found in debugger, but can be recorded and replayed for examining them without affecting the examined machine behavior. - Memory corruption bugs. Deterministic replay can help to debug these bugs, because corrupted memory does not change its place in every run, and the program can be examined to find the code which corrupts the memory. These examples illustrate how deterministic replay may be used in software development. But this technology is also useful in software analysis, e.g. for generation execution traces for dynamic analysis of the applications. This paper describes the design and implementation of full-system logging and deterministic replay mechanisms in QEMU simulator for several target platforms.
RELATED WORK
Software logging for deterministic replay of the execution process for whole system is already implemented in VMWare [9] and ExecRecorder [6]. But they support deterministic replay only for 32-bit x86 systems. VMWare also does not provide any mechanisms for implementing dynamic analysis tools on its base. ExecRecorder is based on slow Bochs simulator and does not support saving replay log for using it later. Time-traveling virtual machine described in [4] also uses logging of non-deterministic events and checkpointing virtual machine states for deterministic replay and reverse debugging. But this system supports only Linux on x86 as a target system. Most of other existing software solutions support deterministic replay of a single application, not a whole system. This leads to different limitations: support of specific platforms, weak multithreading support, limited number of supported system calls, logging only user-level code, and so on [2], [3], [5], [7], [8], [11]. Our approach differs from the existing ones. It supports non-intrusive whole-system dynamic analysis by using deterministic record/replay of the executed software. Deterministic record/replay was implemented for several target platforms – x86, x64, and ARM. Our solution saves replay log allowing replaying it by different people on different computers. III.
EXPECTED BENEFITS
Implementation of deterministic replay in a wholesystem simulator QEMU has the following benefits: -
QEMU is open-source. Any mechanism required by user can be added to simulator (e.g. collecting execution trace for dynamic analysis) QEMU supports many platforms (not just x86). Minor changes are required to implement deterministic replay mechanism for any of the supported platforms, because most of our deterministic replay code is target-independent.
-
-
Deterministic replay for a whole system allows debugging system-level code (like internal OS routines) and multi-threaded applications. Debugging through simulator is non-intrusive. It means that debugging of the program while replaying execution log in the simulator does not affect the behavior of the program. All other benefits of deterministic replay. Execution log can be recorded on one machine (by one person, e.g. tester) and replayed on another one (by other people, e.g. developers), execution scenario can be recorded once and debugged multiple times, non-deterministic inputs such as network packets can be deterministically replayed and so on. IV.
DESCRIPTION OF THE METHOD
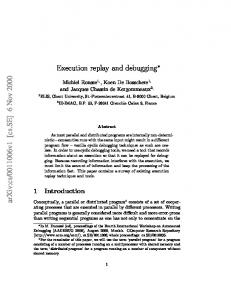
Our method of deterministic replay is based on existing open source simulator QEMU [1], [10]. In this chapter we introduce structure of the simulator and describe the design and implementation of deterministic record/replay mechanisms. A. Structure of Simulator QEMU is a simulator, which uses JIT-translation of simulated code. QEMU translates guest binary code into host binary code and then executes it. Every guest machine instruction is transformed into a sequence of host instructions that simulate behavior of the guest one. The simulator joins translated instructions into translation blocks. Translation block is a continuous sequence of instructions. It means that execution of the block always starts at the first instruction and ends at the last one. Size of the translation block has upper bound, because of fixed-size memory regions used for storing the translation blocks. The simulator itself consists of several logic blocks that include main loop, translation block, execution block, drivers for peripheral devices, and blocks for interrupts handling.
Main loop invokes execution block, which calls translation functions, if simulated code was not translated before, or takes translation result from the cache. When translation is finished (or translated block is found in the cache) control is passed to the translated code. Sometimes interrupting block stops the execution and invokes drivers of emulated (e.g. HDD) and external (e.g. keyboard) devices. After processing events from the devices, the main loop continues execution. There is only one platform-dependent part in this scheme – component which performs binary translation. It is implemented for x86, x64, PowerPC, ARM and other processors to support simulation of these platforms. B. Deterministic Replay Our record/replay system is based on saving and replaying non-deterministic events (e.g. keyboard input) and simulating deterministic ones (e.g. reading from HDD or memory of the VM). Saving only non-deterministic events makes log file smaller, simulation faster, and allows using reverse debugging even for network applications. The following non-deterministic data from peripheral devices is saved into the log: mouse and keyboard input, network packets, audio controller input, and hardware clocks (they are non-deterministic too, because their values are taken from the host machine). Inputs from simulated hardware, memory of VM, software interrupts, and execution of instructions are not saved into the log, because they are deterministic and can be replayed by simulating the behavior of virtual machine starting from initial state. We had to solve three tasks to implement deterministic replay: recording non-deterministic events, replaying nondeterministic events, and checking that there is no divergence between record and replay modes. To make event log recording and replaying, we changed several parts of QEMU: platform-independent execution loop, platform-independent drivers of hardware, and platform-dependent translation mechanisms. Devices’ drivers that have non-deterministic input from external devices were changed to write every external event into the execution log immediately. E.g. network packets are written into the log when they arrive into the virtual network adapter. All non-deterministic events are coming from these drivers. But to replay them we need to know at which moments they occur. We specify these moments by counting the number of instructions executed between every pair of consecutive events. We changed the binary translator for x86, x64, and ARM platforms to make such counting.
Figure 1. Structure of the simulator
There was a challenge in changing the translator. In record and replay modes code generated by binary translator is different, because different additional actions are required in these modes. Size of the memory block allocated for this code is the same in both modes that is why the sizes of the translated block (measured in guest instructions) are different in record and replay modes. Interrupt processing before
making changes in QEMU was done only at the bounds of the translation blocks and we could see the differences in the behavior of virtual machine in record and replay modes. To solve this problem we added one more event – interrupt processing. The translator in replay mode adds special checks that control occurring of this event. If the event occurs in the middle of the block, execution breaks, and interrupts processing is performed. This code made replaying fully deterministic, but added some slowdown to the process of recording and replaying. Disk I/O events are completely deterministic in our model, because in both record and replay modes we start virtual machine from the same disk state. To make sure that replay process is deterministic, our implementation checks that expected events (e.g. reads of the timer, software interrupts) of the QEMU execution are coming from the log in the correct order. If one of these events is not expected in the current state of the simulator, it will stop immediately. C. Reverse Debugging Implementation Reverse debugging is the ability of going through the process of execution in backward direction. With reverse debugging programmer can stop at a chosen point of execution (e.g. where invalid pointer dereferencing exception occurs), examine registers and memory, and continue execution of the program in backward direction (e.g. to the last position, where pointer is written). QEMU originally supported debugging with gdb through remote interface. It supported breakpoints, watchpoints, single-stepping and other common debugging commands. We added support of reverse debugging commands (reverse step, reverse continue) into QEMU, working in deterministic replay mode. Reverse step performs one step back (proceeds to the previously executed instruction). Reverse continue finds the latest breakpoint hit before the current step. Both of these commands use loading of previously saved virtual machine state. We improved QEMU for checkpointing: it saves one state when execution starts and then checkpoints are taken every N’th second (where N is the parameter). Periodic state saving can be disabled, but initial state is required. These checkpoints are used for going back through the execution process. After loading one of the previous states simulator runs forward to find a desired point (for reverse step) or to examine all breakpoints that were hit (for reverse continue). Reverse step command does not need more actions, but reverse continue makes additional pass. After reaching the point where user stopped the execution, reverse continue reruns execution again to reach the latest of the breakpoints that were hit. To make reverse debugging, user has to issue the commands to the debugger. We altered QEMU to perform all of required actions automatically (i.e. loading previously saved state and two-pass execution for reverse continue).
V.
DEBUGGING WITH DETERMINISTIC REPLAY
Using deterministic replay we can debug single bug reproducing scenario for multiple times due to deterministic occurrence of external events that caused this bug to happen. Debugging with deterministic replay consists of two phases: 1.
Capturing the execution log that should be debugged (i.e. the use case, where the bug can be seen). This step is performed by testers. Execution log, recorded by virtual machine, describes bug reproducing process.
2.
Replaying the execution log and revealing the bug. Developer receives the execution log from the tester and replays it on his own computer. He does not need detailed description of the bug reproducing process, because execution log contains all its steps.
Our implementation supports fully deterministic replay of the system’s execution, stopping/starting the guest system at any step, breakpoints, forward and reverse debugging through gdb remote interface. Virtual machine can be connected to host machine’s network or to other virtual machines to debug network applications. All received network packets will be written into event log in record mode. When replaying event log, virtual machine will act as it actually receives this recorded network data. VI.
DYNAMIC ANALYSIS WITH DETERMINISTIC REPLAY
Deterministic replay can be used as a base for different dynamic analysis tools. We already implemented the tool which collects instruction-level execution trace from virtual machine while replaying the log. This trace contains saved processor state for every executed instruction. Virtual machine in this capture mode is 120x times slower than in normal execution mode. So we cannot get traces for network and other timing-critical application on “live” virtual machine. But when we record all network (and other nondeterministic) events into the log, we get an ability to save execution trace of this scenario by running it in the replay mode. Slowdown in the replay mode does not matter, because all non-deterministic events (including timers, interaction with user and network) are already saved into the log and can be accurately replayed. VII. RESULTS The following results were achieved: -
Deterministic record/replay was implemented for x86, x64, and ARM target platforms. Deterministic replay was tested for Windows and Linux as guest OS in network environment. Realtime network applications can be debugged and analyzed in replay mode due to saving all
-
-
-
-
incoming network packets into the event log in record mode. Log recording process gives reasonable slowdown (3-8 times depending on application running and virtual machine configuration) compared to normal execution of virtual machine. Such a slowdown does not affect on most of the applications, including network ones (e.g. record/replay mechanism was tested with Skype instant messaging service). Log replaying speed is almost the same as log recording. But slowdown of this process does not affect anything, because all non-deterministic events are already saved in the log. Code in virtual machine can be executed even in step-by-step mode. Event log requires about 30 kb/sec of disk space (measured on loading Windows XP) that is comparable with other implementations of deterministic replay [4], [6]. Deterministic replay allows using time travel and reverse debugging in QEMU. Execution process can be run in forward and backward directions, code execution can be undone, gdb reverse debugging possibilities can be used with modified QEMU. VIII. CONCLUSIONS AND FUTURE WORK
We implemented deterministic replay mechanism in the multi-platform simulator QEMU. This mechanism was tested on x86, x64, and ARM target platforms. It allows deterministic replay of the recorded application execution scenarios for the purposes of time travel debugging, dynamic analysis, and reverse debugging. Some applications are sensitive to the performance of the virtual machine. That is why we cannot capture the execution traces in the normal execution mode. That is why we use deterministic replay to capture the execution traces of such applications. As QEMU supports other platforms (like PowerPC, and MIPS) we plan to modify deterministic replay for supporting them. We expect that implementation of deterministic replay for every platform will not take more than 1 man-month, because most of our changes made in QEMU were applied to platform-independent parts. We also implemented time travel debugging and full reverse debugging support. We added support of all gdb’s reverse debugging commands into QEMU, including reverse
watchpoints and breakpoints. These commands re-use recorded execution log automatically. Reducing saved log size is one of our aims. We plan to reduce required disk space and, thus, make log migration from one machine to another more convenient, because of its smaller size. Increasing simulation speed is also a challenge. Current implementation of log saving/replaying leads to 3-8 times slowdown of virtual machine. Most of applications are not affected by this slowdown, but faster execution is more convenient for the users. We also plan to investigate possibility of fuzzing network protocols through modifying packets saved in the events log. REFERENCES [1]
F. Bellard, “QEMU, a fast and portable dynamic translator”. In ATEC’05: Proceedings of the annual conference on USENIX Annual Technical Conference, Berkeley, CA, USA, 2005, pp. 41-41 [2] S. Bhansali, W. Chen, S. de Jong, A. Edwards, R. Murray, M. Drinić, D. Mihočka, J. Chau, “Framework for instruction-level tracing and analysis of program executions”. In Proceedings of the 2nd international conference on Virtual execution environments (VEE '06). ACM, New York, NY, USA, 154-163. [3] J. Choi and H. Srinivasan, “Deterministic replay of java multithreaded applications”, In Proceedings of the SIGMETRICS Symposium on Parallel and Distributed Tools, pages 48-59, Aug. 1998. [4] S. T. King, G. W. Dunlap, P. M. Chen, “Debugging operating systems with time-traveling virtual machines”, In Proceedings of the annual conference on USENIX Annual Technical Conference (ATEC '05). USENIX Association, Berkeley (2005), CA, USA, 1-1 [5] B. Lewis, M. Ducassé, “Using events to debug Java programs backwards in time”. OOPSLA Companion 2003: 96-97 [6] D. A. S. de Oliveira, J R. Crandall, G. Wassermann, S. F. Wu, Z. Su, F. T. Chong, “ExecRecorder: VM-based full-system replay for attack analysis and system recovery”, Proceedings of the 1st workshop on Architectural and system support for improving software dependability (2006), Pages: 66-71 [7] H. Patil, C. Pereira, M. Stallcup, G. Lueck, J. Cownie, “PinPlay: a framework for deterministic replay and reproducible analysis of parallel programs”, Proceedings of the 8th annual IEEEACM international symposium on Code generation and optimization (2010), Pages: 2-11 [8] S. M. Srinivasan, S. Kandula, C. R. Andrews, and Y. Zhou, “Flashback: a lightweight extension for rollback and deterministic replay for software debugging”, USENIX 2004 Annual Technical Conference, Pp. 29–44 of the Proceedings [9] Better software development with replay debugging. http://www.replaydebugging.com [10] Open source processor emulator. http://www.qemu.org [11] ReplayEngine. Record and replay debugging race conditions and deadlocks in Linux applications. http://www.roguewave.com/products/totalviewfamily/replayengine.aspx