Sustainability 2015, 7, 1661-1689; doi:10.3390/su7021661 OPEN ACCESS
sustainability ISSN 2071-1050 www.mdpi.com/journal/sustainability Article
Developing a Green Supplier Selection Model by Using the DANP with VIKOR Tsai Chi Kuo 1, Chia-Wei Hsu 2,3,* and Jie-Ying Li 1 1
2 3
Department of Industrial and Systems Engineering, Chung Yuan Christian University, Taoyuan City 32023, Taiwan; E-Mails:
[email protected] (T.C.K.);
[email protected] (J.-Y.L.) Department of Travel and Eco-tourism, Tungnan University, New Taipei City 222, Taiwan Department of Business Administration, National Central University, Taoyuan City 32001, Taiwan
* Author to whom correspondence should be addressed; E-Mail:
[email protected] or
[email protected]; Tel.: +886-2-8662-5958 (ext. 734); Fax: +886-2-8662-5957. Academic Editor: Giuseppe Ioppolo Received: 14 December 2014 / Accepted: 22 January 2015 / Published: 5 February 2015
Abstract: This study proposes a novel hybrid multiple-criteria decision-making (MCDM) method to evaluate green suppliers in an electronics company. Seventeen criteria in two dimensions concerning environmental and management systems were identified under the Code of Conduct of the Electronic Industry Citizenship Coalition (EICC). Following this, the Decision-Making Trial and Evaluation Laboratory (DEMATEL) used the Analytic Network Process (ANP) method (known as DANP) to determine both the importance of evaluation criteria in selecting suppliers and the causal relationships between them. Finally, the VlseKriterijumska Optimizacija I Kompromisno Resenje (VIKOR) method was used to evaluate the environmental performances of suppliers and to obtain a solution under each evaluation criterion. An illustrative example of an electronics company was presented to demonstrate how to select green suppliers. Keywords: supplier selection; environmental performance; EICC; DANP; VIKOR
1. Introduction Given growing environmental concerns during the past decade, a consensus is emerging that environmental pollution issues accompanying industrial development should be addressed along with
Sustainability 2015, 7
1662
supply chain management, thus contributing to a green supply chain management (GSCM) system [1]. GSCM is generally understood to involve screening suppliers based on environmental performance and then doing business only with those that meet certain environmental regulations or standards [2]. Supplier selection in GSCM is clearly a critical activity in purchasing management [2,3]; an increasing number of authors have addressed supplier selection issues when these are viewed from an environmental perspective [4–18]. Supplier selection and evaluation is a multi-criteria decision-making (MCDM) approach [19,20] that provides an effective framework for comparing suppliers. By considering the qualitative characteristic of environmental performance as an indicator in green supplier selection, either the weighting model of the analytic hierarchy process (AHP) [5] or the analytic network process (ANP) [10,21–24] can be more effectively used for treating qualitative factors than other models, such as mathematical programming models. Moreover, most studies have assumed that each cluster in the ANP method has equal weight in obtaining a weighted supermatrix [24,25]. To improve upon this shortcoming, a novel combination of the Decision-Making Trial and Evaluation Laboratory (DEMATEL) and ANP techniques, known as the DANP, is used to determine the influential weights of criteria based on the DEMATEL network relationship map (NRM). When evaluating a supplier, ANP techniques are used to determine the weights of performance criteria and determine the total performance of the supplier. DEMATEL techniques are used to compute the effects between criteria. Another promising technique for solving MCDM problems in supplier selection is the VlseKriterijumska Optimizacija I Kompromisno Resenje (VIKOR) [26–28], which focuses on ranking and selecting from a set of alternatives. This determines compromise solutions for a problem with conflicting criteria and helps in arriving at a final decision [29]. Although there has been previous research in the field of supplier selection and evaluation using a hybrid MCDM model, combining the DEMATEL method with an ANP approach (DANP) and VIKOR to propose a hybrid MCDM method in green supplier selection is, to the best of our knowledge, a new, pioneering study. Application of a hybrid MCDM method combining the DANP and VIKOR has previously been investigated in other fields, including e-store business [30], vendor selection of recycled materials [24], the improvement of tourism policy [31], glamour stock selection [32], the evaluation of RFID technology [33], and brand marketing [34]. However, previous research into either traditional or green supplier selection has been limited. Based on the characteristics of the problem and the advantages of the aforementioned two techniques, this study proposes a hybrid MCDM model based on the DANP which is utilized to determine relative weight. The advantage is that the DANP can use one matrix, instead of the DEMATEL with ANP methods that require two types of questionnaire. The DANP method can benefit the company by determining the weighting and causal relationships among criteria without dealing with the complex, huge and time-consuming comparison matrix of the ANP. The VIKOR with DANP weightings is then proposed for evaluating the environmental performance of suppliers by determining performance scores and gaps. The VIKOR is applied to select appropriate green suppliers and to analyze gaps in the desired level of green performance for each supplier. This can help managers devise strategies for supplier development to effectively minimize gaps in the green performance of potential suppliers. Finally, an example using a Taiwanese electronics manufacturer is included in this research to demonstrate the use of the proposed framework to facilitate selection of appropriate green suppliers. The proposed model provides a new way for decision makers to manage and evaluate suppliers’ demonstrated competence in environmental management.
Sustainability 2015, 7
1663
2. Literature Review 2.1. Methods to Green Supplier Selection and Evaluation In selecting both traditional and green suppliers, individual approaches have been found to be more popular than integrated approaches; the top three approaches have been the AHP, the ANP, and data envelopment analysis (DEA) [35,36] as shown in Table 1. In considering most qualitative criteria and the complexities of a real-world decision process for green supplier selection, AHP and ANP methods were integrated for managers to use in selecting appropriate suppliers. Evaluations were based upon the unique advantages of individual techniques, including DEA, rough set theory, PROMETHEE, and VIKOR. Table 1. Methods for green supplier selection by using AHP and AHP. AHP
Integrated AHP
ANP Integrated ANP
Method AHP, Fuzzy AHP, FEAHP AHP and artificial neural network AHP and genetic algorithm AHP and data envelopment analysis AHP and grey relational analysis AHP and mathematical programming AHP and fuzzy TOPSIS ANP, Fuzzy ANP ANP and data envelopment analysis ANP and rough set theory ANP and PROMETHEE ANP and VIKOR
References [5,9,11,37] [38] [39] [40] [41] [42] [17] [10,22,43] [40,44] [12] [45] [24]
2.2. Criteria for Green Supplier Selection According to the literature review from Govindan et al. [36], both traditional and environmental criteria are considered in the selection and evaluation of green suppliers, as shown in Table 2. It has been found that environmental management systems have been examined most frequently in evaluating the environmental performance of suppliers, followed by green design, green image, environmental performance, environmental competences, and green collaboration with suppliers. Most companies tend to ask their suppliers to implement ISO14001 since the standard has become a prevalent tool for evaluating environmental aspects and factors in the sustainable supply chain (social, economic and environmental) [43,46]. Ho, Xu and Dey [35] found that 68 research papers (87.18%) considered quality the most popular criterion for decision makers in evaluating and selecting the most appropriate supplier, followed by delivery, price/cost, manufacturing capability, service, management, technology, research and development, finance, flexibility, reputation, relationship, risk, and safety and environment. This is consistent with Govindan et al. [36]; consideration of traditional quality has frequently been used in selecting and evaluating green suppliers, followed by price/cost, service and technology. In implementing a green supply chain, managers must consider not only ecological criteria in selecting and
Sustainability 2015, 7
1664
evaluating green suppliers, but also the traditional criteria of quality, price/cost, and service. This implies that firms that are more focused on traditional criteria and adopt formalized supplier selection methods still pay little attention to environmental criteria [18]. This notion has been supported by in-depth interviews demonstrating that even some large companies still lack a formalized environmental performance assessment of their suppliers. Table 2. Top ten criteria for green supplier selection [36]. Criteria Environmental management systems Quality Price/cost Service Technology Green design Green image Environmental performance Environmental Competences Green collaboration with suppliers
References [6,7,11,13,37–39,41,46–49] [11,13,39,40,46,48,49] [13,39,47,49–51] [13,39–41,49,52] [11,40,41,43] [6,7,11,48,53,54] [6,7,11,47,48] [37,54–56] [6,7,46,47] [5,10,56]
In 2004, an implementation group representing a collaboration of large global electronics firms created the EICC Code of Conduct [57]. This EICC Code of Conduct reflects how the electronics industry has developed and matured its corporate responsibility systems in the five core elements of labor, health and safety, ethics, environment, and management systems [58]. Recently, a number of international electronics companies have focused on the EICC Code of Conduct in conducting risk assessment of supply chain responsibility. Fox example, HP adopted the EICC Code of Conduct by engaging with their suppliers in a social and environmental management scheme. In 2012, HP conducted audits of production suppliers in terms of the EICC Code of Conduct and worked closely with manufacturing partners and component suppliers, providing support and training to improve environmental performance and transparency [59]. The suppliers of brand name companies such as Dell, HP, IBM, Intel, and SONY are mainly from Taiwan, one of the most industrialized countries in the Asia-Pacific region and home to a large number of electrical and electronics manufacturers involved in original equipment manufacturing (OEM) and original design manufacturing (ODM) [10]. As a result, these electronics companies are subject to customer requests for environmental and social responsibility in accordance with EICC Code of Conduct. In order to be effective in the selection and evaluation of green suppliers in the electronics industry, environmental criteria from the EICC Code of Conduct have therefore been widely been adopted by OEM or ODM firms to manage and engage with their suppliers (See Table 3).
Sustainability 2015, 7
1665
Table 3. Environmental criteria for supplier selection from EICC Code of Conduct Version 4. Dimension
Criteria Environmental Permits and Reporting
Description All required environmental permits (e.g., discharge monitoring), approvals and registrations are to be obtained, maintained and kept current and their operational and reporting requirements are to be followed
Pollution Prevention
Waste of all types, including water and energy, are to be reduced or eliminated
and Resource
at the source or by practices such as modifying production, maintenance and facility
Reduction
processes, materials substitution, conservation, recycling and re-using materials. Chemicals and other materials posing a hazard if released to the environment are
Hazardous Substances
to be identified and managed to ensure their safe handling, movement, storage, use, recycling or reuse and disposal.
Environmental Wastewater and Solid Waste
Wastewater and solid waste generated from operations, industrial processes and sanitation facilities are to be characterized, monitored, controlled and treated as required prior to discharge or disposal. Air emissions of volatile organic chemicals, aerosols, corrosives, particulates, ozone
Air Emissions
depleting chemicals and combustion by-products generated from operations are to be characterized, monitored, controlled and treated as required prior to discharge.
Product Content Restrictions
Participants are to adhere to all applicable laws, regulations and customer requirements regarding prohibition or restriction of specific substances, including labeling for recycling and disposal. A corporate social and environmental responsibility policy statements affirming
Company Commitment
Participant’s commitment to compliance and continual improvement, endorsed
Management
The Participant clearly identifies company representative[s] responsible for ensuring
by executive management. Accountability and
implementation of the management systems and associated programs. Senior
Responsibility
management reviews the status of the management system on a regular basis.
Legal and Customer
A process to identify, monitor and understand applicable laws, regulations and
Requirements
customer requirements, including the requirements of this Code. A process to identify the environmental, health and safety3 and labor practice and
Risk Assessment and
ethics risks associated with Participant’s operations. Determination of the relative
Risk Management
significance for each risk and implementation of appropriate procedural and physical controls to control the identified risks and ensure regulatory compliance
Improvement Management
Objectives
systems
Written performance objectives, targets and implementation plans to improve the Participant’s social and environmental performance, including a periodic assessment of Participant’s performance in achieving those objectives. Programs for training managers and workers to implement Participant’s
Training
policies, procedures and improvement objectives and to meet applicable legal and regulatory requirements. A process for communicating clear and accurate information about
Communication
Participant’s policies, practices, expectations and performance to workers,
Worker Feedback and
Ongoing processes to assess employees’ understanding of and obtain feedback on
Participation
practices and conditions covered by this Code and to foster continuous improvement.
suppliers and customers.
Audits and Assessments Documentation and Records
Periodic self-evaluations to ensure conformity to legal and regulatory requirements, the content of the Code and customer contractual requirements related to social and environmental responsibility. Creation and maintenance of documents and records to ensure regulatory compliance and conformity to company requirements along with appropriate confidentiality to protect privacy.
Sustainability 2015, 7
1666
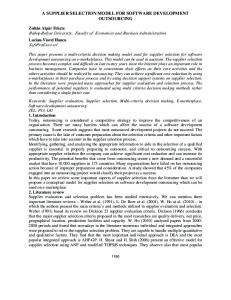
3. Methodology The methodology for constructing a novel hybrid MCDM model to evaluate the environmental performance of suppliers in this study has three phases. The first phase involves identification of criteria used to evaluate the environmental management competence of suppliers. In this study, green supplier criteria were determined from both literature reviews and interviews with the managers of electronics firms. After identifying consistent criteria, the DANP method was used to examine interrelationships between and influential weights among the criteria. In the final phase, VIKOR was used to rank the suppliers of an example electronics company in terms of their competence in environmental management. 3.1. Building a Network Relation Map Using the DEMATEL The DEMATEL was developed with the belief that pioneering scientific research methods and their appropriate use could improve the understanding of a specific cluster of intertwined problems, thus contributing to the identification of workable solutions using a hierarchical structure. The methodology, according to the concrete characteristics of objective affairs, can confirm interdependence among variables/attributes and restrict the relationship reflecting their characteristics using an essential system and a development trend [60]. The DEMATEL method is increasingly being used to determine the interrelationships of factors through a cause–effect relationship diagram, particularly to determine the critical factors of reverse supply chains [61], SaaS adoption [62], airline safety management systems [63], and performance evaluation in the hotel industry [64]. Therefore, DEMATEL modeling best fits the problem examined in the present study and offers the advantage of a systematic approach toward identifying the relationships in green supplier management in the electronics industry. The following steps make up the DEMATEL process: Step 1: Calculating the average matrix Suppose we have H experts in this study and n factors to consider. Each respondent is asked to indicate the degree to which he/she believes a factor, i, affects factor j. Pairwise comparisons between any two factors are denoted by xkij and are given an integer score of 0 to 4, representing “No influence (0)”, “Low influence (1)”, “Medium influence (2)”, “High influence (3)”, and “Very high influence (4)” [65]. Figure 1 shows an example of an influence map. Each letter represents a factor in the system. An arrow from c to d shows the effect that c has on d; the strength of its effect is 4 (very high influence). DEMATEL can convert the structural relations between the factors of a system into an intelligible map of that system. The scores provided by each respondent provide an n × n non-negative answer matrix Xk = , with k = 1, 2, …, H. Therefore, X1, X2, …, XH, Xk, are the answer matrices for each of the H experts, with each element of Xk = being an integer denoted by . The diagonal elements of each answer matrix Xk = are all set to 0. The n × n average matrix A for all expert opinions can then be computed by averaging the scores of the H experts as follows: = ∑ The average matrix A =
(1)
is also called the original average matrix. A shows the initial direct
effects a factor has on and receives from other factors. The causal effect between each pair of factors in a system can be outlined by drawing an influence map.
Sustainability 2015, 7
1667
c 4
3
2
g
d
3 e
3
2
f
Figure 1. Example of an influence map revised from Lin et al. [66]. Step 2: Calculating the direct influence matrix The normalized initial direct-relation matrix D is obtained by normalizing the average matrix A with the following method: Let,
1 1 s min , n n max1in j1 aij max1in i1 aij
(2)
Thus, D=
(3)
As the sum of each row j of matrix A represents the direct effects of each element on others, n
max aij represents the one with the highest direct influence. Likewise, as the sum of each column i of 1i n
j 1
n
matrix A represents the direct effects on factor i, max aij represents the one most influenced by other 1i n
j 1
factors. The positive scalar s is equal to the larger of the two extreme sums. Matrix D is obtained by dividing each element of A by the scalar. Note that each element d ij of matrix D is between 0 and 1. Step 3: Computing the total relation matrix Indirect effects between factors are measured by powers of D. A continuous decrease in the indirect effects of factors, including the powers of matrix D—i.e., D2, D3, D∞—guarantees convergent solutions to the matrix inversion similar to an absorbing Markov chain matrix. Note that lim D m [0]nn and m
Sustainability 2015, 7
1668
lim( I D D 2 D 3 ... D m ) ( I D ) 1 , where 0 is the n × n null matrix and I is the n × n identity
m
matrix. The total relation matrix T is an n × n matrix and is defined as follows:
T = [tij]:=
D
i
D(I D)1 i, j = 1, 2,…, n
(4)
i1
as lim D k [0]nn k
where D [dij ]nn , 0 dij 1 , and 0
sum
d i
ij
d , d 1 . At least one column sum d i
ij
j
ij
j
ij
or one row
equals 1.
We also define r and c as n × 1 vectors representing the sum of the rows and the sum of the columns of the total relation matrix T as follows:
n = tij j1 n1
(5)
n c [c j ]1n = tij i 1 1n
(6)
r [ri ]n1
where superscript’ denotes transposition. Let ri be the sum of the i-th row in matrix T. Therefore, ri shows the total effects, both direct and indirect, of the i-th factor on other factors. Let cj denote the sum of the j-th column in matrix T. The value cj shows the total effects, both direct and indirect, on factor j from other factors. Therefore, the ) gives an index (i.e. the position) representing the total effects both exerted and received by sum ( ) shows the degree of importance that the i-th factor plays in the the i-th factor. In other words, ( , also called the system (i.e. total sum of effects exerted and received). Moreover, the difference ( ) is positive, the relation) shows the net effect; the i-th factor contributes to the system. When ( i-th factor is a net causer; when ( ) is negative, the i-th factor is a net receiver [67,68]. Step 4: Setting the threshold value and obtaining the cognition map To obtain the cognition map from the factors, a threshold value p should be established to extricate negligible effects from the total influence of matrix T [69]. Only some criteria, whose effect in matrix T is greater than the threshold value, should be chosen and shown in a network relationship map (NRM) of influence [68]. 3.2. Combining the DEMATEL and ANP to Calculate the Evaluation Weights by NRM
The ANP is the general form of the AHP, which is used in MCDM to address restrictions on hierarchical structures [70]. However, the survey questionnaire used in the ANP is too difficult for interviewees to complete [64,71]. Moreover, most studies assumed that each cluster in the ANP has equal weight in obtaining a weighted supermatrix [25,28,30]. To improve on this shortcoming, we used a novel combination of the DEMATEL and ANP techniques called the DANP to determine the influential weights of the criteria based on the NRM of the DEMATEL. Recently, the DANP has been widely applied in different areas of tourism policy [31], best vendor selection [28], performance
Sustainability 2015, 7
1669
evaluation for hot spring hotels [64], and the web sites of national parks [72]. The DANP process involves the following steps: Step 1: Establishing an unweighted supermatrix The total-influenced matrix is obtained from the DEMATEL. Each column is summed up for is obtained by the criteria, and = is normalization. The total-influenced matrix = obtained by the dimensions (clusters) from . Next, the supermatrix weights of the dimensions (clusters) using the influence matrix .
is normalized for the ANP
(7)
After normalizing the total-influence matrix Tc through the dimensions (clusters), a new matrix Tc is obtained, as shown in Equation (8).
(8)
The normalization Tc11 is explained and that of the other Tcann is the same as above. m1
d tij11 , i 1,2,...,m1 11 ci
(9)
j1
(10)
Sustainability 2015, 7
1670
Let the total-influence matrix match and fall into the interdependence clusters. The result is the unweighted supermatrix, which is based on the transposition of the normalized influence matrix Tc by the dimensions (clusters), that is, W = (Tc )' .
(11)
If the matrix W 11 is blank or 0 as shown as Equation (12), then the matrix between the clusters or the criteria is independent and has no interdependent. The other Wnn values are as above.
(12)
Step 2: Obtaining the weighted supermatrix
Each column is added for normalization.
TD
t 11 t 1Dj t 1n D D t Di1 t Dij t Din n1 nj nn tD tD tD
(13)
The total-influence matrix TD is normalized, and a new matrix TD is obtained, where t D ij = t Dij / di .
Sustainability 2015, 7
1671
11 1j 1n t D / d1 t D / d1 t D / d1 i1 ij in TD t D / di t D / di t D / di n1 nj nn tD / dn tD / d n t D / dn
t D 11 t D 1 j t D 1n t Di1 t Dij t Din t Dn1 t D nj t D nn
(14)
Let the normalized total-influence matrix TD complete the unweighted supermatrix to obtain the weighted supermatrix.
11 11 t Di1 W 1 j t Dn1 W 1n t D W 1 j i1 ij ij nj W TD W t D W t D W t D W in 1n n1 in nj nn t D W t D W nn t D W
(15)
Step 3: Limiting the weighted supermatrix
The weighted supermatrix is limited by raising it to a sufficiently large power k until the supermatrix converges and becomes a long-term stable supermatrix to obtain the global priority vectors (called the DANP weights), such as lim(W ) h . h
3.3. Ranking the Alternatives Using the VIKOR Method
The compromise ranking method (known as VIKOR) was introduced as an applicable technique to implement in MCDM [73]. It is based on the concept of the positive- and negative-ideal solution used to evaluate the standards of different projects competing with the MCDM model (Opricovic and Tzeng 2004) [74]. The positive-ideal solution represents the alternative with the highest value, whereas the negative-ideal solution represents that with the lowest value. VIKOR ranks and selects from a set of alternatives, determines compromise solutions for a problem with conflicting criteria, and assists decision makers in generating the final decision [29]. Various studies have found VIKOR a suitable technique to evaluate each alternative for each criterion function [27,29]. The compromise-ranking algorithm VIKOR involves the following steps [27,29,75]: Step 1: Determining the best and the worst values The best value is f j and the worst is f j . These two values can be computed using
*
Equations (16) and (17), respectively. f j* max f ij , i 1, 2, .......... .m
(16)
f j min f ij , i 1, 2, .......... .m
(17)
i
i
* where, f j is the positive-ideal solution and f j is the negative-ideal solution for the jth criterion.
Sustainability 2015, 7
1672
Step 2: Calculating the distance
In this step, the distance from each alternative to the positive ideal solution is computed.
Si
n
w
j
j1
Qi max w j i
f
* j
f
* j
f
fij /
f
fij /
* j
* j
f j
f j
(18)
j 1, 2,.........n
(19)
where wj represents the weights of the criteria from the DANP; Si indicates the mean of group utility and represents the distance of the ith alternative achievement to the positive ideal solution; and Qi represents the maximal regret of each alternative. Step 3: Calculating the index value
The index value is defined as follows:
Si S * Qi Q * 1 - v Ri v * * S S Q Q Where ∗
∗
min
min
(or setting the best
(or setting the best
∗
0), and
∗
0 ), max
max
(20) (or setting the worst
(or setting the worst
1 ),
1). Equation (20)
can be rewritten as R vS 1 , when ∗ 0 and ∗ 0 (i.e., all criteria achieve the ideal 1 and 1 (i.e. the worst situation). In the equation, v is introduced as the weight level) and for the strategy of maximum group utility, and 1-v is the weight of the individual regret. In Equation (20), when v = 1, it indicates the decision-making process that can use the strategy of maximum group utility. Conversely, when v = 0, it indicates the decision-making process that can use the strategy of minimum individual regret. In general, v = 0.5 will be used if the decision process involves both maximum group utility and individual regret [27,74]. The compromise solution is determined by the VIKOR method and can be accepted by the decision makers based on a maximum group utility of the majority and a minimum of the individual regret of the opponent. 4. Case Study of an Electronics Company
The case company chosen for use in this research is a worldwide leader in electronic and computing product development, including motherboards, desktop PCs, notebooks, broadband, wireless systems, game consoles, and networking equipment. This company is interested in incorporating environmental management into supplier evaluation and selection for GSCM because it is under great pressure from buyers and has become a member of EICC. Although the case company embraced the EICC Code of Conduct’s questionnaire in implementing supplier evaluations to help establish a green supply chain, the assessment criteria of the EICC Code of Conduct do not consider the different significance and weights of each criterion. To be effective in its supplier evaluation and selection, the case company wished to implement a systematic method of evaluating suppliers based on their competency in environmental management under the EICC Code of Conduct. In view of this, a hybrid MCDM model was proposed for use by the case company in evaluating green suppliers and selecting those with sound environmental management competences.
Sustainability 2015, 7
1673
4.1. Identifying Consistent Evaluation Criteria
To better define the criteria used in the selection of green suppliers in the electronics industry in general, as well as for the company used for our case study, 17 criteria in two dimensions were identified based on the environmental and management systems of the EICC Code of Conduct, as shown in Table 4. Table 4. The proposed framework for green supplier selection. Dimension
Environment (D1)
Management system (D2)
Criteria Environmental permits and reporting (C1) Pollution prevention and resource reduction (C2) Hazardous substances (C3) Wastewater and solid waste (C4) Air emissions (C5) Product content restrictions (C6) Company commitment (C7) Management accountability and responsibility (C8) Legal and customer requirements (C9) Risk assessment and risk management (C10) Performance objectives with implementation plan and measures (C11) Training (C12) Communication (C13) Worker feedback and participation (C14) Audits and assessments (C15) Corrective action process (C16) Documentation and records (C17)
4.2. Determining the Relationships between Criteria by DEMATEL
The DEMATEL method was used to examine interdependence and influence relationships between the 17 criteria. Five managers from the case company were asked to complete the questionnaires using a five-point scale (i.e., 0 for no influence, 1 for low, 2 for moderate, 3 for high and 4 for very high) to indicate the influence of each criterion on another criterion within their respective organization. The average initial influence 17 × 17 matrix A (Table 5) was obtained by pairwise comparison in terms of influences and directions. The normalized initial direct-relation matrix D was calculated using Equations (1)–(3) (Table 6). The total influence matrix T (Table 7) was derived from Equation (4). The NRM of the influential relationship was constructed based on vectors r and c (Table 8) using Equations (5) and (6), as shown in Figure 2.
Sustainability 2015, 7
1674
Figure 2. The causal diagram. The NRM of the criteria was identified by the DEMATEL. The influential relationships within the 17 criteria were revealed. Considering the significance of environmental management in green supplier selection, as presented in Table 8, importance was ranked as C9 > C6 > C4 > C3 > C8 > C2 > C5 > C11 > C16 > C10> C7 > C17 > C1 > C15 > C14 > C12 > C13 according to the degree of importance (ri + ci). Contrary to the importance of individual criteria, management accountability and responsibility (C8), documentation and records (C17), legal and customer requirements (C9), environmental permits and reporting (C1), audits and assessments (C15), and corrective action process (C16) are net causers in accordance with the value of difference (ri − ci).
Sustainability 2015, 7
1675 Table 5. The initial influence matrix.
C1 C2 C3 C4 C5 C6 C7 C8 C9 C10 C11 C12 C13 C14 C15 C16 C17
C1 0.000 3.200 3.200 3.200 3.200 2.800 2.400 2.800 3.200 2.600 2.400 2.400 2.000 2.000 2.200 2.000 2.400
C2 3.200 0.000 4.000 3.800 3.800 3.400 2.800 3.000 3.600 3.000 3.200 2.400 2.000 2.600 2.600 2.800 2.200
C3 3.400 3.400 0.000 4.000 3.800 3.400 2.600 3.200 3.800 3.200 2.800 2.600 2.000 2.200 2.800 2.600 3.400
C4 3.400 3.400 3.800 0.000 3.000 3.400 2.400 3.400 3.600 2.800 3.000 2.800 2.200 2.600 3.000 3.200 3.200
C5 3.400 3.400 3.400 3.200 0.000 3.200 2.400 3.200 3.800 2.800 2.600 2.600 2.000 2.600 2.800 3.000 3.000
C6 2.800 3.400 3.600 3.400 3.400 0.000 2.800 3.400 3.600 3.200 3.200 2.600 2.400 2.400 3.000 3.000 3.200
C7 2.200 2.800 2.800 2.800 2.600 3.000 0.000 3.400 3.000 2.400 3.000 2.400 2.800 3.000 2.600 2.200 2.600
C8 2.400 2.400 2.600 2.600 2.200 2.800 3.000 0.000 3.000 2.200 3.000 2.800 3.200 3.400 2.600 2.800 2.800
C9 3.200 3.000 3.600 3.600 3.600 3.600 2.800 3.400 0.000 3.000 2.800 2.600 3.200 2.800 3.200 3.200 3.400
C10 2.600 2.800 3.200 2.400 3.000 3.000 2.800 3.000 3.600 0.000 2.800 2.400 3.000 2.600 2.800 2.800 2.800
C11 3.200 2.600 2.600 3.000 2.800 3.000 3.000 3.800 3.000 3.200 0.000 2.600 3.000 3.000 3.200 3.000 2.600
C12 3.000 2.800 2.600 3.000 2.600 2.800 2.800 3.600 2.800 2.400 2.800 0.000 2.800 2.000 2.400 2.800 2.400
C13 1.800 2.400 2.000 2.400 1.800 2.200 2.600 3.600 3.200 2.600 2.800 2.600 0.000 3.200 2.600 2.800 2.200
C14 1.600 2.400 2.400 2.600 2.800 3.000 2.600 3.600 2.600 2.600 2.600 1.800 2.800 0.000 2.600 3.200 2.600
C15 2.200 2.200 2.400 2.400 2.400 3.200 2.800 3.600 3.400 2.800 2.600 2.000 2.600 2.200 0.000 3.000 2.200
C16 2.800 2.800 2.800 3.200 2.800 3.000 2.600 3.200 3.400 3.000 2.800 2.000 2.400 2.400 2.400 0.000 3.600
C17 2.600 2.400 2.600 2.600 2.200 2.600 2.600 3.200 3.400 2.800 2.600 2.000 2.200 2.000 2.200 3.400 0.000
C12 0.056 0.052 0.049 0.056 0.049 0.052 0.052 0.067 0.052
C13 0.034 0.045 0.037 0.045 0.034 0.041 0.049 0.067 0.060
C14 0.030 0.045 0.045 0.049 0.052 0.056 0.049 0.067 0.049
C15 0.041 0.041 0.045 0.045 0.045 0.060 0.052 0.067 0.064
C16 0.052 0.052 0.052 0.060 0.052 0.056 0.049 0.060 0.064
C17 0.049 0.045 0.049 0.049 0.041 0.049 0.049 0.060 0.064
Table 6. The normalized direct-influence matrix. C1 C2 C3 C4 C5 C6 C7 C8 C9
C1 0.000 0.060 0.060 0.060 0.060 0.052 0.045 0.052 0.060
C2 0.060 0.000 0.075 0.071 0.071 0.064 0.052 0.056 0.067
C3 0.064 0.064 0.000 0.075 0.071 0.064 0.049 0.060 0.071
C4 0.064 0.064 0.071 0.000 0.056 0.064 0.045 0.064 0.067
C5 0.064 0.064 0.064 0.060 0.000 0.060 0.045 0.060 0.071
C6 0.052 0.064 0.067 0.064 0.064 0.000 0.052 0.064 0.067
C7 0.041 0.052 0.052 0.052 0.049 0.056 0.000 0.064 0.056
C8 0.045 0.045 0.049 0.049 0.041 0.052 0.056 0.000 0.056
C9 0.060 0.056 0.067 0.067 0.067 0.067 0.052 0.064 0.000
C10 0.049 0.052 0.060 0.045 0.056 0.056 0.052 0.056 0.067
C11 0.060 0.049 0.049 0.056 0.052 0.056 0.056 0.071 0.056
Sustainability 2015, 7
1676 Table 6. cont.
C10 C11 C12 C13 C14 C15 C16 C17
C1 0.049 0.045 0.045 0.037 0.037 0.041 0.037 0.045
C2 0.056 0.060 0.045 0.037 0.049 0.049 0.052 0.041
C3 0.060 0.052 0.049 0.037 0.041 0.052 0.049 0.064
C4 0.052 0.056 0.052 0.041 0.049 0.056 0.060 0.060
C5 0.052 0.049 0.049 0.037 0.049 0.052 0.056 0.056
C6 0.060 0.060 0.049 0.045 0.045 0.056 0.056 0.060
C7 0.045 0.056 0.045 0.052 0.056 0.049 0.041 0.049
C8 0.041 0.056 0.052 0.060 0.064 0.049 0.052 0.052
C9 0.056 0.052 0.049 0.060 0.052 0.060 0.060 0.064
C10 0.000 0.052 0.045 0.056 0.049 0.052 0.052 0.052
C11 0.060 0.000 0.049 0.056 0.056 0.060 0.056 0.049
C12 0.045 0.052 0.000 0.052 0.037 0.045 0.052 0.045
C13 0.049 0.052 0.049 0.000 0.060 0.049 0.052 0.041
C14 0.049 0.049 0.034 0.052 0.000 0.049 0.060 0.049
C15 0.052 0.049 0.037 0.049 0.041 0.000 0.056 0.041
C16 0.056 0.052 0.037 0.045 0.045 0.045 0.000 0.067
C17 0.052 0.049 0.037 0.041 0.037 0.041 0.064 0.000
C12 0.327 0.332 0.343 0.352 0.333 0.350 0.317 0.391 0.376 0.320 0.329 0.242 0.303 0.293 0.311 0.334 0.322
C13 0.288 0.307 0.313 0.323 0.300 0.320 0.297 0.370 0.362 0.306 0.312 0.273 0.238 0.297 0.298 0.316 0.300
C14 0.292 0.314 0.327 0.333 0.324 0.341 0.303 0.378 0.360 0.312 0.315 0.265 0.293 0.247 0.304 0.330 0.314
C15 0.304 0.312 0.329 0.332 0.320 0.346 0.308 0.380 0.375 0.318 0.317 0.270 0.292 0.288 0.259 0.328 0.309
C16 0.334 0.343 0.357 0.367 0.347 0.364 0.324 0.396 0.399 0.341 0.340 0.287 0.306 0.309 0.321 0.295 0.352
C17 0.308 0.312 0.329 0.332 0.313 0.333 0.302 0.369 0.371 0.314 0.313 0.267 0.281 0.281 0.295 0.331 0.266
Table 7. The total influence matrix. C1 C2 C3 C4 C5 C6 C7 C8 C9 C10 C11 C12 C13 C14 C15 C16 C17
C1 0.267 0.331 0.345 0.348 0.335 0.342 0.303 0.368 0.374 0.316 0.315 0.278 0.282 0.285 0.300 0.312 0.314
C2 0.362 0.315 0.401 0.400 0.386 0.394 0.347 0.417 0.427 0.362 0.368 0.313 0.318 0.331 0.345 0.366 0.350
C3 0.369 0.379 0.335 0.408 0.390 0.399 0.348 0.425 0.435 0.369 0.365 0.320 0.321 0.328 0.352 0.367 0.374
C4 0.368 0.378 0.400 0.337 0.376 0.398 0.344 0.428 0.431 0.362 0.368 0.322 0.324 0.334 0.355 0.376 0.370
C5 0.358 0.367 0.383 0.382 0.312 0.383 0.334 0.412 0.422 0.351 0.350 0.310 0.311 0.325 0.341 0.362 0.356
C6 0.360 0.379 0.399 0.398 0.384 0.339 0.352 0.430 0.433 0.370 0.372 0.320 0.329 0.333 0.356 0.374 0.372
C7 0.313 0.332 0.346 0.349 0.333 0.353 0.268 0.388 0.380 0.320 0.333 0.285 0.303 0.310 0.315 0.324 0.325
C8 0.316 0.325 0.342 0.346 0.326 0.350 0.321 0.328 0.380 0.317 0.333 0.292 0.310 0.317 0.315 0.334 0.328
C9 0.374 0.381 0.407 0.411 0.396 0.412 0.360 0.440 0.379 0.375 0.374 0.327 0.350 0.347 0.368 0.386 0.384
C10 0.332 0.345 0.366 0.356 0.352 0.367 0.329 0.395 0.404 0.290 0.342 0.296 0.318 0.314 0.330 0.347 0.341
C11 0.353 0.352 0.367 0.377 0.360 0.378 0.343 0.422 0.407 0.357 0.303 0.309 0.328 0.331 0.347 0.361 0.348
Threshold value: 0.379. The values were marked when higher than the threshold value.
Sustainability 2015, 7
1677 Table 8. The sum of influences exerted and received.
Dimension
Environment (D1)
Management system (D2)
Criteria Environmental permits and reporting (C1) Pollution prevention and resource reduction (C2) Hazardous substances (C3) Wastewater and solid waste (C4) Air emissions (C5) Product content restrictions (C6) Company commitment (C7) Management accountability and responsibility (C8) Legal and customer requirements (C9) Risk assessment and risk management (C10) Performance objectives with implementation plan and measures (C11) Training (C12) Communication (C13) Worker feedback and participation (C14) Audits and assessments (C15) Corrective action process (C16) Documentation and records (C17)
ri 5.624 5.804 6.089 6.149 5.887 6.170 5.499 6.737 6.715 5.699 5.747 4.977 5.209 5.268 5.513 5.843 5.727
ci 5.414 6.203 6.285 6.272 6.059 6.300 5.576 5.580 6.472 5.823 6.042 5.574 5.219 5.353 5.387 5.779 5.317
ri + ci 11.039 12.006 12.374 12.422 11.946 12.470 11.075 12.317 13.187 11.522 11.789 10.551 10.428 10.621 10.900 11.622 11.044
Rank 13 6 4 3 7 2 11 5 1 10 8 16 17 15 14 9 12
ri − ci 0.210 −0.399 −0.196 −0.123 −0.173 −0.131 −0.077 1.157 0.243 −0.125 −0.296 −0.598 −0.010 −0.085 0.127 0.064 0.410
Rank 4 16 14 10 13 12 8 1 3 11 15 17 7 9 5 6 2
Sustainability 2015, 7
1678
4.3. Finding the Influential Weight of Criteria Using the DANP
This study used the DANP method to obtain the weights of the 17 criteria and two dimensions based on the influence network of the total influence matrix T produced by the DEMATEL. First, the DANP was used to compare the criteria and calculate an unweighted supermatrix (Table 9) and weighted supermatrix (Table 10). The limiting power of the weighted supermatrix to confirm the supermatrix was converged, and it became a long-term stable supermatrix, obtaining the weights of all criteria (Table 11). Each row represents the weights of each criterion. The influential weights of criteria were determined by the DANP. In terms of the relative weights of criteria for evaluating green suppliers in Table 12, the 10 prioritized criteria were: hazardous substances (C3), product content restrictions (C6), wastewater and solid waste (C4), pollution prevention and resource reduction (C2), air emissions (C5), environmental permits and reporting (C1), legal and customer requirements (C9), performance objectives with implementation plan and measures (C11), risk assessment and risk management (C10), and corrective action process (C16). The results show that majority of the 10 prioritized issues fall within the environmental dimension. Moreover, hazardous substances (C3) and product content restrictions (C6) are rated as the top two criteria in the selection of green suppliers. This finding is fully supported by Hsu and Hu [10]; their study pointed out that competency in the management of hazardous substances is crucial in supplier selection since suppliers will be asked to demonstrate that their products conform to the RoHS directive, particularly in the electronics industry. Current management measures regarding the use of hazardous substances in the electronics industry require suppliers to implement and acquire the IECQ QC 080000 HSPM system certification for managing hazardous substances in products and processes. A study conducted by Morose, Shina, and Farrell in 2011 [76] revealed the global initiative of the electronics industry to utilize lead-free materials in the production of printed circuit boards, particularly in those intended for use in electrical and electronic equipment. Considering the significant weights of the criteria, managers should select the best and appropriate suppliers through the VIKOR method in the proposed MCDM model.
Sustainability 2015, 7
1679 Table 9. Unweighted supermatrix based on the DANP.
C1 C2 C3 C4 C5 C6 C7 C8 C9 C10 C11 C12 C13 C14 C15 C16 C17
C1 0.267 0.331 0.345 0.348 0.335 0.342 0.303 0.368 0.374 0.316 0.315 0.278 0.282 0.285 0.300 0.312 0.314
C2 0.362 0.315 0.401 0.400 0.386 0.394 0.347 0.417 0.427 0.362 0.368 0.313 0.318 0.331 0.345 0.366 0.350
C3 0.369 0.379 0.335 0.408 0.390 0.399 0.348 0.425 0.435 0.369 0.365 0.320 0.321 0.328 0.352 0.367 0.374
C4 0.368 0.378 0.400 0.337 0.376 0.398 0.344 0.428 0.431 0.362 0.368 0.322 0.324 0.334 0.355 0.376 0.370
C5 0.358 0.367 0.383 0.382 0.312 0.383 0.334 0.412 0.422 0.351 0.350 0.310 0.311 0.325 0.341 0.362 0.356
C6 0.360 0.379 0.399 0.398 0.384 0.339 0.352 0.430 0.433 0.370 0.372 0.320 0.329 0.333 0.356 0.374 0.372
C7 2.084 2.149 2.262 2.273 2.184 2.255 2.027 2.481 2.522 2.130 2.137 1.863 1.886 1.936 2.050 2.158 2.137
C8 0.313 0.332 0.346 0.349 0.333 0.353 0.268 0.388 0.380 0.320 0.333 0.285 0.303 0.310 0.315 0.324 0.325
C9 0.316 0.325 0.342 0.346 0.326 0.350 0.321 0.328 0.380 0.317 0.333 0.292 0.310 0.317 0.315 0.334 0.328
C10 0.374 0.381 0.407 0.411 0.396 0.412 0.360 0.440 0.379 0.375 0.374 0.327 0.350 0.347 0.368 0.386 0.384
C11 0.332 0.345 0.366 0.356 0.352 0.367 0.329 0.395 0.404 0.290 0.342 0.296 0.318 0.314 0.330 0.347 0.341
C12 0.353 0.352 0.367 0.377 0.360 0.378 0.343 0.422 0.407 0.357 0.303 0.309 0.328 0.331 0.347 0.361 0.348
C13 0.327 0.332 0.343 0.352 0.333 0.350 0.317 0.391 0.376 0.320 0.329 0.242 0.303 0.293 0.311 0.334 0.322
C14 0.288 0.307 0.313 0.323 0.300 0.320 0.297 0.370 0.362 0.306 0.312 0.273 0.238 0.297 0.298 0.316 0.300
C15 0.292 0.314 0.327 0.333 0.324 0.341 0.303 0.378 0.360 0.312 0.315 0.265 0.293 0.247 0.304 0.330 0.314
C16 0.304 0.312 0.329 0.332 0.320 0.346 0.308 0.380 0.375 0.318 0.317 0.270 0.292 0.288 0.259 0.328 0.309
C17 0.334 0.343 0.357 0.367 0.347 0.364 0.324 0.396 0.399 0.341 0.340 0.287 0.306 0.309 0.321 0.295 0.352
C13 0.054 0.061 0.062 0.062 0.060 0.063 0.058 0.060 0.067 0.061
C14 0.054 0.063 0.062 0.063 0.062 0.063 0.059 0.060 0.066 0.060
C15 0.054 0.063 0.064 0.064 0.062 0.065 0.057 0.057 0.067 0.060
C16 0.053 0.063 0.063 0.064 0.062 0.064 0.055 0.057 0.066 0.059
C17 0.055 0.061 0.065 0.065 0.062 0.065 0.057 0.057 0.067 0.060
Table 10. Weighted supermatrix based on the DANP. C1 C2 C3 C4 C5 C6 C7 C8 C9 C10
C1 0.047 0.064 0.066 0.065 0.064 0.064 0.056 0.056 0.067 0.059
C2 0.057 0.054 0.065 0.065 0.063 0.065 0.057 0.056 0.066 0.059
C3 0.057 0.066 0.055 0.066 0.063 0.065 0.057 0.056 0.067 0.060
C4 0.057 0.065 0.066 0.055 0.062 0.065 0.057 0.056 0.067 0.058
C5 0.057 0.066 0.066 0.064 0.053 0.065 0.057 0.055 0.067 0.060
C6 0.055 0.064 0.065 0.064 0.062 0.055 0.057 0.057 0.067 0.059
C7 0.055 0.063 0.063 0.063 0.061 0.064 0.049 0.058 0.065 0.060
C8 0.055 0.062 0.063 0.064 0.061 0.064 0.058 0.049 0.065 0.059
C9 0.056 0.064 0.065 0.064 0.063 0.064 0.057 0.057 0.057 0.060
C10 0.055 0.064 0.065 0.064 0.062 0.065 0.056 0.056 0.066 0.051
C11 0.055 0.064 0.063 0.064 0.061 0.065 0.058 0.058 0.065 0.059
C12 0.056 0.063 0.064 0.065 0.062 0.064 0.057 0.059 0.066 0.059
Sustainability 2015, 7
1680 Table 10. Cont.
C11 C12 C13 C14 C15 C16 C17
C1 0.063 0.058 0.051 0.052 0.054 0.059 0.055
C2 0.061 0.057 0.053 0.054 0.054 0.059 0.054
C3 0.060 0.056 0.051 0.054 0.054 0.059 0.054
C4 0.061 0.057 0.052 0.054 0.054 0.060 0.054
C5 0.061 0.056 0.051 0.055 0.054 0.059 0.053
C6 0.061 0.057 0.052 0.055 0.056 0.059 0.054
C7 0.062 0.058 0.054 0.055 0.056 0.059 0.055
C8 0.063 0.058 0.055 0.056 0.056 0.059 0.055
C9 0.061 0.056 0.054 0.054 0.056 0.059 0.055
C10 0.063 0.056 0.054 0.055 0.056 0.060 0.055
C11 0.053 0.057 0.054 0.055 0.055 0.059 0.054
C12 0.062 0.049 0.055 0.053 0.054 0.058 0.054
C13 0.063 0.058 0.046 0.056 0.056 0.059 0.054
C14 0.063 0.056 0.056 0.047 0.055 0.059 0.053
C15 0.063 0.056 0.054 0.055 0.047 0.058 0.054
C16 0.062 0.057 0.054 0.056 0.056 0.050 0.057
C17 0.061 0.056 0.052 0.055 0.054 0.062 0.046
C13 0.055 0.063 0.064 0.064 0.061 0.064 0.057 0.057 0.066 0.059 0.061 0.056 0.053 0.054 0.055 0.059 0.054
C14 0.055 0.063 0.064 0.064 0.061 0.064 0.057 0.057 0.066 0.059 0.061 0.056 0.053 0.054 0.055 0.059 0.054
C15 0.055 0.063 0.064 0.064 0.061 0.064 0.057 0.057 0.066 0.059 0.061 0.056 0.053 0.054 0.055 0.059 0.054
C16 0.055 0.063 0.064 0.064 0.061 0.064 0.057 0.057 0.066 0.059 0.061 0.056 0.053 0.054 0.055 0.059 0.054
C17 0.055 0.063 0.064 0.064 0.061 0.064 0.057 0.057 0.066 0.059 0.061 0.056 0.053 0.054 0.055 0.059 0.054
Table 11. Influential weights of stable matrix of DANP. C1 C2 C3 C4 C5 C6 C7 C8 C9 C10 C11 C12 C13 C14 C15 C16 C17
C1 0.055 0.063 0.064 0.064 0.061 0.064 0.057 0.057 0.066 0.059 0.061 0.056 0.053 0.054 0.055 0.059 0.054
C2 0.055 0.063 0.064 0.064 0.061 0.064 0.057 0.057 0.066 0.059 0.061 0.056 0.053 0.054 0.055 0.059 0.054
C3 0.055 0.063 0.064 0.064 0.061 0.064 0.057 0.057 0.066 0.059 0.061 0.056 0.053 0.054 0.055 0.059 0.054
C4 0.055 0.063 0.064 0.064 0.061 0.064 0.057 0.057 0.066 0.059 0.061 0.056 0.053 0.054 0.055 0.059 0.054
C5 0.055 0.063 0.064 0.064 0.061 0.064 0.057 0.057 0.066 0.059 0.061 0.056 0.053 0.054 0.055 0.059 0.054
C6 0.055 0.063 0.064 0.064 0.061 0.064 0.057 0.057 0.066 0.059 0.061 0.056 0.053 0.054 0.055 0.059 0.054
C7 0.055 0.063 0.064 0.064 0.061 0.064 0.057 0.057 0.066 0.059 0.061 0.056 0.053 0.054 0.055 0.059 0.054
C8 0.055 0.063 0.064 0.064 0.061 0.064 0.057 0.057 0.066 0.059 0.061 0.056 0.053 0.054 0.055 0.059 0.054
C9 0.055 0.063 0.064 0.064 0.061 0.064 0.057 0.057 0.066 0.059 0.061 0.056 0.053 0.054 0.055 0.059 0.054
C10 0.055 0.063 0.064 0.064 0.061 0.064 0.057 0.057 0.066 0.059 0.061 0.056 0.053 0.054 0.055 0.059 0.054
C11 0.055 0.063 0.064 0.064 0.061 0.064 0.057 0.057 0.066 0.059 0.061 0.056 0.053 0.054 0.055 0.059 0.054
C12 0.055 0.063 0.064 0.064 0.061 0.064 0.057 0.057 0.066 0.059 0.061 0.056 0.053 0.054 0.055 0.059 0.054
Sustainability 2015, 7
1681 Table 12. Local and global weights of criteria.
Dimension and Criteria D1 C1 C2 C3 C4 C5 C6 D2 C7 C8 C9 C10 C11 C12 C13 C14 C15 C16 C17
Local Weights 0.395 0.055 0.063 0.064 0.064 0.061 0.064 0.605 0.057 0.057 0.066 0.059 0.061 0.056 0.053 0.054 0.055 0.059 0.054
Global Weights 0.148524 0.170006 0.172141 0.171497 0.165730 0.172103 0.089744 0.090071 0.104083 0.093706 0.097216 0.089565 0.084159 0.086153 0.086726 0.092954 0.085624
Rank 2 6 4 1 3 5 2 1 12 11 7 9 8 13 17 15 14 10 16
4.4. Evaluating the Green Performance of Suppliers Using VIKOR
After the weights of the criteria were determined using the DANP, the VIKOR method was used to evaluate the environmental performance of suppliers (Table 13). In this study, five suppliers for the electronics company profiled in the case study were assessed in terms of their environmental performance based upon the 17 identified criteria. Given the ease of applying the proposed model to the case company used in this research, the v value of VIKOR was set to 0.5, based on both maximum group utility and individual regret in expert opinions. As Ri represents the gap between the alternative and the ideal solution, S3 contains the smallest gap in terms of the value of VIKOR, followed by S1, S4, S5, and S2. The sum of these values for each alternative is provided in Table 13, which shows that S3 is the most suitable supplier. Table 13. VIKOR results. Dimension Criteria Supplier 1 Supplier 2 Supplier 3 Supplier 4 Supplier 5 C1 0.00000 0.05865 0.00000 0.00000 0.05865 C2 0.00000 0.06713 0.00000 0.03357 0.03357 C3 0.00000 0.06797 0.00000 0.03399 0.06797 D1 C4 0.00000 0.06772 0.00000 0.00000 0.06772 C5 0.00000 0.06544 0.00000 0.00000 0.06544 C6 0.00000 0.06796 0.00000 0.00000 0.06796
Sustainability 2015, 7
1682 Table 13. Cont.
Dimension Criteria Supplier 1 0.00000 C7 C8 0.00000 C9 0.00000 C10 0.02932 C11 0.00000 C12 D2 0.00000 C13 0.00000 C14 0.00000 C15 0.00000 C16 0.00000 C17 0.00000 Sj 0.02932 (2) Rj 0.02932 (2) Qj 0.230362 (2)
Supplier 2 0.05431 0.05450 0.06298 0.05670 0.05883 0.05420 0.05093 0.05213 0.05248 0.05625 0.05181 1.00000(5) 0.06797(5) 1.00000(5)
Supplier 3 Supplier 4 Supplier 5 0.00000 0.02715 0.05431 0.00000 0.02725 0.05450 0.00000 0.03149 0.06298 0.00000 0.02835 0.05670 0.00000 0.02941 0.05883 0.00000 0.02710 0.05420 0.00000 0.02546 0.05093 0.00000 0.02607 0.05213 0.00000 0.02624 0.05248 0.00000 0.02812 0.05625 0.00000 0.02591 0.05181 0.00000(1) 0.37012 (3) 0.96643 (4) 0.00000(1) 0.03399 (3) 0.06797 (4) 0.00000(1) 0.435058 (3) 0.983217 (4)
5. Discussion
Despite the growing interest evident in the previous literature concerning the selection of green suppliers, there are limitations on the integration of environmental performance standards from the EICC Code of Conduct in the evaluation and selection of suppliers in the electronic supply chain. The EICC Code has been widely adopted by companies in the assessment of social responsibility and the environmental performance of their operational sites and those of their suppliers [77]. The EICC Code covers five areas of ethics: environmental conditions, labor standards, worker health and safety, and management systems. This is consistent with the findings of Ekener-Petersen and Finnveden [78]; the ICT industry is working to address environmental and social responsibility concerns, for example through the EICC and the Global e-Sustainability Initiative (GeSI). Considering the situation for environmental conduct based on the EICC Code of Conduct as it applies to green suppliers, the proposed framework of 17 criteria from real cases is an obvious advantage for electronic firms in assessing environmental performance in accordance with their buyers’ requirements. According to the empirical study in Section 4, our proposed hybrid MCDM model could provide more relevant results. The DANP technique is beneficial to firms preferring to complete the questionnaire within one 17 × 17 matrix, instead of using the DEMATEL with ANP methods, which requires two types of questionnaires. This evidence was reinforced through discussion with the five managers from the case company, in which they indicated that the DANP was easy to implement in determining the weighting and causal relationships between green performance criteria. As shown in Figure 2, the criterion of management accountability and responsibility (C9) is rated as the number one priority in helping managers with their decision-making regarding suppliers and improving upon the importance given to the weightings of the DANP criteria. For example, in this study, hazardous substances (C3) and product content restrictions (C6) were regarded as the top two criteria for evaluating green suppliers. This evidence is consistent with the study of Hsu and Hu [10]; the problem of hazardous substances for supplier selection is crucial in green supply chain management since the Restriction of Hazardous
Sustainability 2015, 7
1683
Substances (RoHS) directives were passed by the European Union (EU). Suppliers have to meet minimum requirements in order to be eligible to work with the focal firm in the supply chain [18]. Finally, the VIKOR method is applied to select appropriate green suppliers and to analyze gaps in the desired level of green performance for each supplier. This can help managers devise strategies for effectively minimizing gaps in the green performance of potential suppliers. As noted previously, discussions of the empirical results from the DANP with managers from the case company have focused mainly on collaborative initiatives with suppliers for improving their environmental performance. The case company has launched capability-building programs by directly engaging management and employees of suppliers to help build green management competencies. The emerging results in this study are fully supported by the Supplier Development theory of Krause and Ellram [79]; any effort by the buying firm to increase the performance and/or capabilities of the supplier and to meet the buying firms’ short and/or long terms supply needs is supported. Development in the field of operations management and supply chains has been recognized as a strategic management approach to help organizations maintain a competitive advantage [80–82]. Given the growing environmental concerns in supply chain management, green supplier development programs [12,83–85] have been initiated. As pointed out by Fu, Zhu and Sarkis [84], companies make their supply chains greener not only by selecting existing green suppliers, but also by assisting their suppliers with green initiatives designed to improve business and competitive performance. 6. Conclusions and Future Research
To facilitate a green supply chain in the electronics industry, a supply chain-based conceptual framework and operational model incorporating environmental management into the selection of suppliers has been presented. By identifying the related criteria of environmental management activities for the proposed framework, a hybrid MCDM model integrating the DANP and VIKOR methods for selecting green suppliers was applied to a sample electronics company. Compared to the content of previous literature, the proposed framework makes several contributions to the evaluation and selection of green suppliers. First, a novel hybrid MCDM model for evaluating green suppliers, with emphasis on environmental performance and management systems, was developed. This was based mainly on the EICC CoC. Such a framework with 17 criteria based upon an actual case study is rarely described in earlier literature. Second, the DEMATEL method was applied in selecting suppliers and proved to be an appropriate method for delineating the structure of a completely interdependent supplier selection problem model and for obtaining the a solution to that problem. Third, the DANP was used to provide considerable weighting to the 17 criteria. The top two criteria, namely identification of hazardous substances and product content restrictions, were derived. The advantage of the DANP for companies is that the complex, huge and time-consuming comparison matrix of the ANP is avoided. DANP modeling serves as a new and simpler method offering insights to managers in selecting suppliers systematically. Finally, an empirical study was conducted to demonstrate the application of the hybrid MCDM model combining the DANP with the VIKOR method. This proposed model considers both maximum group utility and individual regret to measure the gaps between alterative and ideal solutions, thereby strengthening the ability to conduct environmental performance assessments of suppliers in spite of a lack of quantitative information. Based on the results from the case
Sustainability 2015, 7
1684
study, this model demonstrates a potential advantage in selecting appropriate suppliers based on environmental performance. Although the results obtained from this research are satisfactory, there is still room for improvement. The proposed model of environmental management and management systems is derived mainly from the EICC Code of Conduct; the other aspects of ethics, health and safety, and labor should be further incorporated into the selection and evaluation of sustainable suppliers. The outcomes concerning the environmental performance of suppliers using the hybrid MCDM method in this study were determined exclusively by five managers of the case company. Increasing the number of participating experts from the electronics industry would provide a more generalized model of supplier carbon management. In response to the preference of decision-makers in assigning precise numerical values, fuzzy DANP and fuzzy VIKOR methods could be applied in future research. Author Contributions
Tsai Chi Kuo and Jie-Ying Li designed the research; Tsai Chi Kuo and Jie-Ying Li performed the research; Jie-Ying Li and Chia-Wei Hsu collected and analyzed data; Tsai Chi Kuo, Chia-Wei Hsu, and Jie-Ying Li wrote the paper; finally, Chia-Wei Hsu revised the paper. All authors have read and approved the final manuscript. Conflicts of Interest
The authors declare no conflict of interest. References
1. 2. 3. 4. 5.
6. 7. 8.
Sheu, J.B.; Chou, Y.H.; Hu, C.C. An integrated logistics operational model for green-supply chain Management. Transp. Res. Part E Logist. Transp. Rev. 2005, 41, 287–313. Rao, P. Greening the supply chain: A new initiative in south East Asia. Int. J. Oper. Prod. Manag. 2002, 22, 632–655. Lamming, R.; Hampson, J. The environment as a supply chain management issue. Br. J. Manag. 1996, 7 (Suppl. S1), S45–S62. Zhu, Q.; Geng, Y. Integrating environmental issues into supplier selection and management: A study of large and medium-sized state-owned enterprises in China. Greener Manag. Int. 2001, 35, 27–40. Handfield, R.; Walton, S.V.; Sroufe, R.; Melnyk, S.A. Applying environmental criteria to supplier assessment: A study in the application of the analytical hierarchy process. Eur. J. Oper. Res. 2002, 141, 70–87. Humphreys, P.; Wong, R.; Chan, F. Integrating environmental criteria into the supplier selection process. J. Mater. Process. Technol. 2003, 138, 349–356. Humphreys, P.K.; McIvor, R.; Chan, F.T.S. Using case-based reasoning to evaluate supplier environmental management performance. Expert Syst. Appl. 2003, 25, 141–153. Rao, P. The greening of suppliers-in the South East Asian context. J. Clean Prod. 2005, 13, 935–945.
Sustainability 2015, 7
9. 10. 11. 12. 13. 14. 15. 16.
17.
18. 19. 20. 21. 22. 23. 24. 25. 26. 27.
1685
Lu, L.Y.Y.; Wu, C.H.; Kuo, T.C. Environmental principles applicable to green supplier evaluation by using multi-objective decision analysis. Int. J. Prod. Res. 2007, 45, 4317–4331. Hsu, C.W.; Hu, A.H. Applying hazardous substance management to supplier selection using analytic network process. J. Clean Prod. 2009, 17, 255–264. Lee, A.H.; Kang, H.Y.; Hsu, C.F.; Hung, H.C. A green supplier selection model for high-tech industry. Expert Syst. Appl. 2009, 36, 7917–7927. Bai, C.; Sarkis, J. Green supplier development: Analytical evaluation using rough set theory. J. Clean Prod. 2010, 8, 1200–1210. Kuo, R.J.; Wang, Y.C.; Tien, F.C. Integration of artificial neural network and MADA methods for green supplier selection. J. Clean Prod. 2010, 18, 1161–1170. Büyüközkan, G. An integrated fuzzy multi-criteria group decision-making approach for green supplier evaluation. Int. J. Prod. Res. 2012, 50, 2892–2909. Hsu, C.W.; Kuo, T.C.; Chen, S.H.; Hu, A.H. Using DEMATEL to develop a carbon management model of supplier selection in green supply chain management. J. Clean Prod. 2013, 56, 164–172. Shen, L.; Olfat, L.; Govindan, K.; Khodaverdi, R.; Diabat, A. A fuzzy multi criteria approach for evaluating green supplier’s performance in green supply chain with linguistic preferences. Resour. Conserv. Recycl. 2013, 74, 170–179. Kannan, D.; Khodaverdi, R.; Olfat, L.; Jafarian, A.; Diabat, A. Integrated fuzzy multi criteria decision making method and multi-objective programming approach for supplier selection and order allocation in a green supply chain. J. Clean Prod. 2013, 47, 355–367. Genovese, A.; Lenny Koh, S.C.; Bruno, G.; Esposito, E. Greener supplier selection: State of the art and some empirical evidence. Int. J. Prod. Res. 2013, 51, 2868–2886. Huang, S.; Keskar, H. Comprehensive and configurable metrics for supplier selection. Int. J. Prod. Econ. 2007, 105, 510–523. Liao, Z.; Rittscher, J. A multi-objective supplier selection model under stochastic demand conditions. Int. J. Prod. Econ. 2007, 105, 150–159. Gencer, C.; Gürpinar, D. Analytic network process in supplier selection: A case study in an electronic firm. Appl. Math. Model. 2007, 31, 2475–2486. Zhu, Q.; Dou, Y.; Sarkis, Y. A portfolio-based analysis for green supplier management using the analytical network process. Supply Chain Manag. 2010, 15, 306–319. Pang, B.; Bai, S. An integrated Fuzzy synthetic evaluation approach for supplier selection based on analytic network process. J. Intell. Manuf. 2013, 24, 163–174. Hsu, C.W.; Kuo, R.J.; Chiou, C.Y. A multi-criteria decision making approach for evaluating carbon performance of suppliers in the electronics industry. Int. J. Environ. Sci. Technol. 2014, 11, 775–784. Ou Yang, Y.P.; Shieh, H.M.; Tzeng, G.H. A novel hybrid MCDM model combined with DEMATEL and ANP with applications. Int. J. Oper. Res. 2008, 5, 160–168. Chen, L.Y.; Wang, T.C. Optimizing partners’ choice in IS/IT outsourcing projects: The strategic decision of fuzzy VIKOR. Int. J. Prod. Econ. 2009, 120, 233–242. Liou, J.J.H.; Chuang, Y.T. Developing a hybrid multi-criteria model for selection of outsourcing providers. Expert Syst. Appl. 2010, 37, 3755–3761.
Sustainability 2015, 7
1686
28. Hsu, C.H.; Wang, F.K.; Tzeng, G.H. The best vendor selection for conducting the recycling material based on a hybrid MCDM model combining DANP with VIKOR. Resour. Conserv. Recycl. 2012, 66, 95–111. 29. Opricovic, S.; Tzeng, G.H. Extended VIKOR method in comparison with outranking methods. Eur. J. Oper. Res. 2007, 178, 514–529. 30. Chiu, W.Y.; Tzeng, G.H.; Li, H.L. A new hybrid MCDM model combining DANP with VIKOR to improve e-store business. Knowl. Based Syst. 2013, 37, 48–61. 31. Liu, C.H.; Tzeng, G.H.; Lee, M.H. Improving tourism policy implementation—The use of Hybrid MCDM Models. Tour. Manag. 2012, 33, 413–426. 32. Shen, K.Y.; Yan, M.R.; Tzeng, G.H. Combining VIKOR-DANP model for glamor stock selection and stock performance improvement. Knowl. Based Syst. 2014, 58, 86–97. 33. Lu, M.T.; Lin, S.W.; Tzeng, G.H. Improving RFID adoption in Taiwan’s healthcare industry based on a DEMATEL technique with a hybrid MCDM model. Decis. Support Syst. 2013, 56, 259–269. 34. Wang, Y.L.; Tzeng, G.H. Brand marketing for creating brand value based on a MCDM Model combining DEMATEL with ANP and VIKOR Methods. Expert Syst. Appl. 2012, 39, 5600–5615. 35. Ho, W.; Xu, X.; Dey, P.K. Multi-criteria decision making approaches for supplier evaluation and selection: A literature review. Eur. J. Oper. Res. 2010, 202, 16–24. 36. Govindan, K.; Rajendran, S.; Sarkis, J.; Murugesan, P. Multi criteria decision making approaches for green supplier evaluation and selection: A literature review. J. Clean Prod. 2013, in press. 37. Chiou, C.Y.; Hsu, C.W.; Hwang, W.Y. Comparative investigation on green supplier selection of the American, Japanese and Taiwanese electronics industry in China. In Proceedings of the IEEE International Conference on IE&EM, Singapore, Singapore, 8–11 December 2008; pp. 1909–1914. 38. Thongchattu, C.; Siripokapirom, S. Green supplier selection consensus by neural network. In Proceedings of the IEEE International Conference on ICMEE, Kyoto, Japan, 1–3 August 2010; pp. 313–316. 39. Yan, G. Research on green suppliers’ evaluation based on AHP & Genetic Algorithm. In Proceedings of the IEEE International Conference on SPS, Singapore, Singapore, 15–17 May 2009; pp. 615–619. 40. Wen, U.P.; Chi, J.M. Developing green supplier selection procedure: A DEA approach. In Proceedings of the IEEE International Conference on IE&EM, Xiamen, China, 29–31 October 2010; pp. 79–74. 41. Li, X.; Zhao, C. Selection of suppliers of vehicle components based on green supply chain. In Proceedings of the IEEE International Conference on IE&EM, Beijing, China, 21–23 October 2009; pp. 1588–1591. 42. Shaw, K.; Shankar, R.; Yadav, S.S.; Thakur, L.S. Supplier selection using Fuzzy AHP and Fuzzy multi-objective linear programming for developing low carbon supply chain. Expert Syst. Appl. 2012, 39, 8182–8192. 43. Büyüközkan, G.; Çifçi, G. A novel fuzzy multi-criteria decision framework for sustainable supplier selection with incomplete information. Comput. Ind. 2011, 62, 164–174. 44. Kuo, R.J.; Lin, Y.J. Supplier selection using analytic network process and data envelopment analysis. Int. J. Prod. Res. 2012, 50, 2852–2863.
Sustainability 2015, 7
1687
45. Tuzkaya, G.; Ozgen, A.; Ozgen, D.; Tuzkaya, U.R. Environmental performance evaluation of Suppliers: A hybrid fuzzy multi-criteria decision approach. Int. J. Environ. Sci. Technol. 2009, 6, 477–490. 46. Chen, C.C.; Tseng, M.L.; Lin, Y.H.; Lin, Z.S. Implementation of green supply chain management in uncertainty. In Proceedings of the IEEE International Conference on IEEM, Macao, China, 7–10 December 2010; pp. 260–264. 47. Grisi, R.M.; Guerra, L.; Naviglio, G. Supplier performance evaluation for green supply chain management. In Business Performance Measurement and Management; Springer: Berlin, Germany, 2010; pp. 149–163. 48. Humphreys, P.; McCloskey, A.; McIvor, R.; Maguire, L.; Glackin, C. Employing dynamic fuzzy membership functions to assess environmental performance in the supplier selection process. Int. J. Prod. Res. 2006, 44, 2379–2419. 49. Zhang, H.C.; Li, J.; Merchant, M.E. Using fuzzy multi-agent decision-making in environmentally conscious supplier management. CIRP Ann. Manuf. Technol. 2003, 52, 385–388. 50. Yang, Y.; Wu, L. Extension method for green supplier selection. In Proceedings of the IEEE International Conference on WiCom, Dalian, China, 12–14 October 2008; pp. 1–4. 51. Yeh, W.C.; Chuang, M.C. Using multi-objective genetic algorithm for partner selection in green supply chain problems. Expert Syst. Appl. 2011, 38, 4244–4253. 52. Bala, A.; Paco Muñoz, P.; Rieradevall, J.; Ysern, P. Experiences with greening suppliers. The Universitat Autònoma de Barcelona. J. Clean Prod. 2008, 16, 1610–1619. 53. Awasthi, A.; Chauhan, S.S.; Goyal, S.K. A fuzzy multicriteria approach for evaluating environmental performance of suppliers. Int. J. Prod. Econ. 2010, 126, 370–378. 54. Chiou, T.Y.; Chan, H.K.; Lettice, F.; Chung, S.H. The influence of greening the suppliers and green innovation on environmental performance and competitive advantage in Taiwan. Transp. Res. Part E Logist. Transp. Rev. 2011, 47, 822–836. 55. Feyziog̃lu, O.; Büyüközkan, G. Evaluation of green suppliers considering decision criteria dependencies. In Multiple Criteria Decision Making for Sustainable Energy and Transportation Systems; Springer: Berlin, Germany, 2010; pp. 145–154. 56. Large, R.O.; Thomsen, C.G. Drivers of green supply management performance: Evidence from Germany. J. Purch. Supply Manag. 2011, 17, 176–184. 57. Krueger, D.A. The ethics of global supply chains in China—Convergences of east and west. J. Bus. Ethics 2008, 79, 113–120. 58. Electronic Industry Citizenship Coalition. Electronic Industry Citizenship Coalition® Code of Conduct Version 4.0; Electronic Industry Citizenship Coalition: Alexandria, VA, USA, 2012. 59. Hewlett-Packard Company (HP). HP 2012 Global Citizenship Summary Report. Available online: http://h20195.www2.hp.com/V2/GetPDF.aspx/c03742928.pdf (accessed on 3 February 2015). 60. Chiu, Y.J.; Chen, H.C.; Tzeng, G.H.; Shyu, J.Z. Marketing strategy based on customer behavior for the LCD-TV. Int. J. Manag. Decis. Mak. 2006, 7, 143–165. 61. Rahman, S.; Subramanian, N. Factors for implementing end-of-life computer recycling Operations in reverse supply chains. Int. J. Prod. Econ. 2012, 140, 239–248. 62. Wu, W.W.; Lan, L.W.; Lee, Y.T. Exploring decisive factors affecting an organization’s SaaS adoption: A case study. Int. J. Inf. Manag. 2011, 31, 556–563.
Sustainability 2015, 7
1688
63. Hsu, Y.L.; Li, W.C.; Chen, K.W. Structuring critical success factors of airline safety management system using a Hybrid Model. Transp. Res. Part E Logist. Transp. Rev. 2010, 46, 222–235. 64. Chen, F.H.; Hsu, T.S.; Tzeng, G.H. A balanced scorecard approach to establish a performance evaluation and relationship model for hot spring hotels based on a hybrid MCDM model Combining DEMATEL and ANP. Int. J. Hosp. Manag. 2011, 30, 908–932. 65. Gabus, A.; Fontela, E. World Problems, an Invitation to Further thought within the Framework of DEMATEL; Batelle Geneva Research Center: Geneva, Switzerland, 1972. 66. Lin, C.W.; Chen, S.H.; Tzeng, G.H. Constructing a cognition map of alternative fuel vehicles using the DEMATEL method. J. Multi Criteria Decis. Anal. 2009, 16, 5–19. 67. Liou, J.J.H.; Tzeng, G.H.; Chang, H.C. Airline safety measurement using a Novel Hybrid Model. J. Air Transp. Manag. 2007, 13, 243–249. 68. Tzeng, G.H.; Chiang, C.H.; Li, C.W. Evaluating intertwined effects in e-learning programs: A Novel Hybrid MCDM Model based on factor analysis and DEMATEL. Expert Syst. Appl. 2007, 32, 1028–1044. 69. Yang, J.L.; Tzeng, G.H. An integrated MCDM technique combined with DEMATEL for A Novel cluster-weighted with ANP Method. Expert Syst. Appl. 2011, 38, 1417–1424. 70. Huang, J.J.; Tzeng, G.H.; Ong, C.S. Multidimensional data in multidimensional scaling using the analytic network process. Pattern Recognit. Lett. 2005, 26, 755–767. 71. Hung, Y.H.; Huang, T.L.; Hsieh, J.C.; Tsuei, H.J.; Cheng, C.C.; Tzeng, G.H. Online reputation management for improving marketing by using a Hybrid MCDM model. Knowl. Based Syst. 2012, 35, 87–93. 72. Tsai, W.H.; Chou, W.C.; Lai, C.W. An effective evaluation model and improvement analysis for national park websites: A case study of Taiwan. Tourism Manag. 2010, 31, 936–952. 73. Opricovic, S. Multicriteria Optimization of Civil Engineering Systems; Faculty of Civil Engineering: Belgrade, Serbia, 1998. 74. Opricovic, S.; Tzeng, G.H. Compromise solution by MCDM methods: A comparative analysis of VIKOR and TOPSIS. Eur. J. Oper. Res. 2004, 156, 445–455. 75. Tzeng, G.H.; Teng, M.H.; Chen, J.J.; Opricovic, S. Multicriteria selection for a restaurant Location in Taipei. Int. J. Hosp. Manag. 2002, 21, 171–187. 76. Morose, G.; Shina, S.; Farrell, R. Supply chain collaboration to achieve toxics use reduction. J. Clean Prod. 2011, 19, 397–407. 77. Oehmen, J.; de Nardo, M.; Schönsleben, P.; Boutellier, R. Supplier code of conduct-state-of-the-art and customisation in the electronics industry. Prod. Plan. Control 2010, 21, 664–679. 78. Ekener-Petersen, E.; Finnveden, G. Potential hotspots identified by social LCA-part 1: A case study of a laptop computer. Int. J. Life Cycle Assess. 2013, 18, 127–143. 79. Krause, D.R.; Ellram, L.M. Success factors in supplier development. Int. J. Phys. Distrib. Logist. Manag. 1997, 27, 39–52. 80. Govindan, K.; Kannan, D.; Haq, A.N. Analyzing supplier development criteria for an automobile industry. Ind. Manag. Data Syst. 2010, 110, 43–62. 81. Li, W.; Humphreys, P.K.; Yeung, A.C.; Cheng, T.C.E. The impact of supplier development on buyer competitive advantage: A path analytic model. Int. J. Prod. Econ. 2012, 135, 353–366.
Sustainability 2015, 7
1689
82. Modi, S.B.; Mabert, V.A. Supplier development: Improving supplier performance through knowledge transfer. J. Oper. Manag. 2007, 25, 42–64. 83. Dou, Y.; Zhu, Q.; Sarkis, J. Evaluating green supplier development programs with a grey-analytical network process-based methodology. Eur. J. Oper. Res. 2014, 233, 420–431. 84. Fu, X.; Zhu, Q.; Sarkis, J. Evaluating green supplier development programs at a telecommunications systems provider. Int. J. Prod. Econ. 2012, 38, 13505–13517. 85. Tate, W.L.; Ellram, L.M.; Dooley, K.J. Environmental purchasing and supplier management (EPSM): Theory and practice. J. Purch. Supply Manag. 2012, 18, 173–188. © 2015 by the authors; licensee MDPI, Basel, Switzerland. This article is an open access article distributed under the terms and conditions of the Creative Commons Attribution license (http://creativecommons.org/licenses/by/4.0/).