Jul 6, 2012 - Keywords ... assessing the software safety of those controllers has allowed analysis of the effects of a .
Proceedings of the 2012 International Conference on Industrial Engineering and Operations Management Istanbul, Turkey, July 3 – 6, 2012
Developing a Safety Index using FMEA Mohammad Abdolshah Industrial Engineering Department Islamic Azad University, Semnan Branch, Iran Abstract Nowadays safety at workstations is so important for managers and they try to ensure that workstations meet minimum requirements. There are some research about using FMEA (Failure mode and effects analysis) to increase the safety at work especially in food industries and hospitals, but all of them have concentrated on safety in special points of view and they are not applicable for all fields. In this paper FMEA was employed to develop a new general safety index which is applicable for all fields of industries. The methodology of this research was to change the standard tables of FMEA (severity, occurrence, and detection) to new tables in such a way that safety can be calculated. The new calculation of these three criteria in the point of view of safety caused to develop a new RPN (Risk Priority Number).
Keywords FMEA (Failure mode and effects analysis), safety, safety index, RPN
1. Introduction Safety at workstations and different environments is one the most important issue. Therefore in order to increase the level of safety, at first it must be measured. This measurement can be done by a safety index. Different safety indices are defined in different fields such as industries (Maiti; Karwowski and Mital 1986; Maroño, Peña et al. 2006; Leong and Shariff 2008), road safety (Gitelman, Doveh et al.; Hermans, Van den Bossche et al. 2008; Hermans, Van den Bossche et al. 2009), civil engineering (Androic; Pham, Holmes et al. 1983; Kanda, Iwasaki et al. 1997; Wei, Lin et al. 2008), and airline (Squalli; Chang and Yeh 2004; Liou, Tzeng et al. 2007). Different methodologies such as reliability (Reddy, Grandhi et al. 1994; Wang and Grandhi 1996), Delphi (Jamson, Wardman et al. 2008), Dow method(Etowa, Amyotte et al. 2002), and FMEA (Failure mode and effects analysis) (2009). FMEA is one of the most well-known techniques to assess the failure of a process or a product. FMEA has been used in safety topics to increase the safety at work. For example FMEA has been used in standard of HACCP in food companies. This index has been useful for predicting the safety of foods. Husain et al. (2009) used FMEA and probabilistic counterexamples for airbag system. Moreover FMEA can be used to increase the safety of patients in hospitals. Chiozza and Ponzetti (2009) have been used FMEA to reduce the medical errors. They showed a significant reduction of the risk priority number (RPN) which was obtained when applying FMEA to blood cross-matching. Adachi and Lodolce (2005) used FMEA in improving the safety of drug administration. Kunac et al. (2005) employed FMEA methodology to identify the Priorities for Medication Safety in Neonatal Intensive Care. Kennedya and Kirwan (1998) regarding to FMEA, developed a hazard and operability-based method for identifying safety management vulnerabilities in high risk systems. Spath (Spath 2003 ) in another study used FMEA analysis to improve patient safety. Desireé et al. (Desireé L. and David M. 2005) Identified priorities for medication safety in neonatal intensive care. Their methodology is to use the FMEA framework and a systems-based approach, an eight-member multidisciplinary panel worked to create a flow diagram of the neonatal unit medication use process. Moreover, FMEA has been used to analyze and decrease the risk (increase the safety) in other areas such as industries. Thivel et al. (Thivel, Bultel et al. 2008) analyzed the risk of a biomass combustion process using methods MOSAR and FMEA. Papadopoulos (Papadopoulos, Parker et al. 2004) then automated the failure modes and effects analysis of safety critical systems. In their approach, FMEAs are built from engineering diagrams that have been augmented with information about component failures. Goddard (Goddard 1993 ) Validated the safety of embedded real-time control systems using FMEA. The use of FMEA techniques in assessing the software safety of those controllers has allowed analysis of the effects of a more comprehensive set of potential failures, including data corruption, than is practical using other software safety analysis techniques. Onodera and Hitachi (Onodera and Hitachi Ltd. 1997 ) used FMEA to decrease the risk of FMEA at each life-cycle stage of a project. The continuous application of the FMEA process over the life-cycle of a project is ensured by the preparation of the individual FMEA worksheets for each stage.
2230
All studies about FMEA in safety are focused in a special field such as some industries (especially food industry) or medical services and there is not a general safety index used FMEA. Moreover there is no study about defining a new index to assess the safety in workstations. Therefore this study tries to define a new index for assessing the safety using FMEA. This new index is using the concepts of FMEA tables to develop a new safety index.
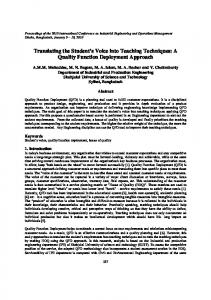
2. Failure Mode and Effects Analysis In order to analyze the reliability of a process, FMEA is a systematic tool that has been used vastly in industries (Dale and Shaw 1990). FMEA can measure the performance of a production in the point of view of risk. Therefore this risk can be analyzed and reduced. The reduction of risk in the process will be achieved by finding the potential failure and preventing them (Dale and Shaw 1990). Therefore the ultimate aim of FMEA is to reduce the failure of a process.Similar to many quality improvement tools United States Army for the first time in 1949 developed FMEA. Then FMEA was used in aerospace and automotive industries in the 1970s, and after that it was worldwide in other general industries. Nowadays FMEA is used in all fields of industries; especially it is compulsory for automobile factories and auto part industries to use FMEA as mentioned in ISO 9000 standard 1. FMEA is used in the standard of ISO 9000 as a effective preventive technique (Scipioni, Saccarola et al. 2002). In order to apply FMEA to a production cycle at first the process must be identified and analyzed precisely. From this analysis, potential failures are derived. Then each potential failure is analyzed and weighted by three criteria: severity, occurrence, and detection. Therefore as shown in Figure 1, five steps are considered for FMEA implementation. These five steps are the main steps of FMEA in all industries. A successful FMEA implementation helps the FMEA team to identify potential failure modes based on past experiences with similar products or processes. Therefore this team will enable to prevent the failure occurrence and to design the system with less error and failure.
Risk priority number (PRN)
Step 1: Detect a failure mode
Step 4: Detection number (DETEC)
Step 2: Severity number (SEV)
Step 3: Probability number (OCCUR)
Figure 1: The procedure of FMEA The first step of FMEA is to detect the failure modes. Failure modes are any kinds of errors or defects in a process, or design. Failure mode also can be items, especially those that affect the customer, and can be potential or actual. Since in the next step, the failure modes must be ranked and prevented, the identification of maximum failure modes are so important. In the next step all distinguished failure modes must be ranked. Regarding to the procedure of FMEA this ranking is done based on three main criteria: severity, probability, and detection. Calculating the severity levels provides a classification ranking that encompasses safety, production continuity, scrap loss, etc. Table 1 is the standard table for assigning the severity.
1 - A standard for quality management system
2231
Table 1: Severity ranking criteria (Marvin and Arnljot 2004) Description Failure is such minor nature that the customer (internal or external) will probably not detect the failure. Failure will result in slight customer annoyance and/or slight deterioration of part or system performance. Failure will result in customer dissatisfaction and annoyance and/or deterioration of part or system performance. Failure will result in high degree of customer dissatisfaction and cause non-functionality of system. Failure will result in major customer dissatisfaction and cause nonsystematic operation or non-compliance with government regulations.
Rank 1–2 3–5 6–7 8–9 10
In order to assess the failure properly, occurrence of this failure must be considered. Occurrence of a failure means the probability of occurrence a failure during the expected life of the system. Table 2 shows the recommended occurrence ranking criteria for the FMEA.
Rank 1
2–3
4–6
7–9
10
Table 2: Occurrence Ranking Criteria (Marvin and Arnljot 2004) Description An unlikely probability of occurrence during the item operating time interval. Unlikely is defined as a single failure mode (FM) probability < 0.001 of the overall probability of failure during the item operating time interval. A remote probability of occurrence during the item operating time interval (i.e. once every two months). Remote is defined as a single FM probability > 0.001 but < 0.01 of the overall probability of failure during the item operating time interval. An occasional probability of occurrence during the item operating time interval (i.e. once a month). Occasional is defined as a single FM probability > 0.01 but < 0.10 of the overall probability of failure during the item operating time interval. A moderate probability of occurrence during the item operating time interval (i.e. once every two weeks). Probable is defined as a single FM probability > 0.10 but < 0.20 of the overall probability of failure during the item operating time interval. A high probability of occurrence during the item operating time interval (i.e. once a week). High probability is defined as a single FM probability > 0.20 of the overall probability of failure during the item operating interval.
Detection Ranking Criteria is the last criteria that must be assessed for ranking the items in FMEA. In this part, detection of a failure means how much a failure is able to be detected. The probability of detection is ranked in reverse order. For example, "1" indicates a very high probability that a failure would be detected before reaching the customer; or "10" indicates a low – zero probability that the failure will be detected; therefore, the failure would be experienced by the customer. Table 4 ranks the recommended criteria.
Rank 1–2 3–4 5–7 8–9 10
Table 3: Detection Ranking Criteria (Marvin and Arnljot 2004) Description Very high probability that the defect will be detected. Verification and/or controls will almost certainly detect the existence of a deficiency or defect. High probability that the defect will be detected. Verification and/or controls have a good chance of detecting the existence of a deficiency or defect. Moderate probability that the defect will be detected. Verification and/or controls are likely to detect the existence of a deficiency or defect. Low probability that the defect will be detected. Verification and/or controls not likely to detect the existence of a deficiency or defect. Very low (or zero) probability that the defect will be detected. Verification and/or controls will not or cannot detect the existence of a deficiency or defect.
2232
Finally the risk priority number (RPN) is determined based on the above estimation of the severity, occurrence, and detection. This index is the main index which shows the priority of corrective action on the failure modes. Based on Equation 1, the RPN is calculated by multiplying the severity (1–10), occurrence (1–10) and detection ranking (1–10) levels resulting in a scale from 1 to 1000. RPN = Severity ×Occurrence ×Detection.
(1)
3. Developing a safety index using FMEA As stated there is no study about defining a new index to assess the safety in workstations. Therefore this study employs FMEA to create a new safety index. The ranking of original FMEA was based on three main criteria: severity, probability, and detection. In this study also we use these three criteria. Severity levels of original FMEA was provided for a classification ranking that encompasses safety, production continuity, scrap loss, etc. But in this study we change the meaning of severity to severity of an accident in workstation in industries. An accident in workstation can cause a little fatigue or even a death. Therefore the severity of an accident can be ranked. Table 4 shows the ranking of different accidents in workstations in the point of view of severity.
Rank 10
Title Lethal
9
Serious
8
Severe
7
Moderate
6
Mild
Table 4: Severity Ranking Criteria Description The injuries are non-survivable even with immediate medical attention. Severe crushing injury and decapitation are examples. The injuries pose a serious threat to the individuals’ life and require immediate medical attention Those are dangerous in life term periods such as high volume for hearing system. Injuries are survivable, but may require medical attention. Without medical attention the injuries could become severe. Fatigues or injuries pose no serious threat to life if complications are prevented (such as infection of wounds)
The next item for ranking the accidents is based on occurrence ranking. Occurrence ranking criteria as stated is the probability of occurrence a failure during the expected life of the system. In this part also occurrence means probability of occurrence of an accident for a worker. Therefore the description of occurrence is similar, and just the ranking is formed vice versa.
Rank 6
Probability of Failure Very High, Failure is almost inevitable
7
High, Repeated failures
8
Moderate, Occasional failures
9
Low, Relatively few failures
10
Remote
Table 5: Occurrence ranking criteria Description An unlikely probability of occurrence during the item operating time interval. Unlikely is defined as a single failure mode (FM) probability < 0.001 of the overall probability of failure during the item operating time interval. A remote probability of occurrence during the item operating time interval (i.e. once every two months). Remote is defined as a single FM probability > 0.001 but < 0.01 of the overall probability of failure during the item operating time interval. An occasional probability of occurrence during the item operating time interval (i.e. once a month). Occasional is defined as a single FM probability > 0.01 but < 0.10 of the overall probability of failure during the item operating time interval. A moderate probability of occurrence during the item operating time interval (i.e. once every two weeks). Probable is defined as a single FM probability > 0.10 but < 0.20 of the overall probability of failure during the item operating time interval. A high probability of occurrence during the item operating time interval (i.e. once a week). High probability is defined as a single FM probability > 0.20 of the overall probability of failure during the item operating interval.
2233
Detection ranking criteria is the last criteria that must be assessed for ranking the accidents in workstations. As stated detection ranking helps to rank based on an assessment of the probability of the failure. Similar to previous parts the detection ranking criteria also is formed for an accident in workstations. As showed in Table 6 the description is similar to Table 3 and just the ranking has been changed.
Rank 10 9 8 7 6
Table 6: Detection ranking criteria Description Very high probability that the defect will be detected. Verification and/or controls will almost certainly detect the existence of a deficiency or defect. High probability that the defect will be detected. Verification and/or controls have a good chance of detecting the existence of a deficiency or defect. Moderate probability that the defect will be detected. Verification and/or controls are likely to detect the existence of a deficiency or defect. Low probability that the defect will be detected. Verification and/or controls not likely to detect the existence of a deficiency or defect. Very low (or zero) probability that the defect will be detected. Verification and/or controls will not or cannot detect the existence of a deficiency or defect.
Tables 4, 5, and 6 have created the new standard to assess the safety at workstations. These tables have been derived from the original FMEA concepts and with some modifications they are used for assessing the safety at workstations. Then in next part a new safety index is employed in a real industrial case.
4. Case study: Assessing the safety for plastic injection molding Injection molding is a manufacturing process for producing parts in two cases thermoplastic 2 and thermosetting plastic materials 3. Material is fed into a heated barrel, mixed, and forced into a mold cavity where it cools and hardens to the configuration of the mold cavity. Pakrizan Sanat Co. is a factory producing plastic containers in Semnan industries region of Iran. This product has 2 main parts. First is the body and second is the cap. Each part is produced by an injection process and admittedly in each process there is a specific rate of reject. Finally, in last process these two parts will be assembled. Now Pakrizan Sanat Co. wants to increase the safety at workstations. Therefore, the proposed method was implemented in this factory and the results were mentioned in Table 7. This case study was done on 45 items that was identified as failures. All failures were categorized in 3 categories: Appearance, dimensional, and performance. 1F
2F
Table 7: Calculation of the new safety index for assessing the quality in injection molding in Pakrizan Sanat Co.
2 - A material that softens when heated and hardens again when cooled 3 - A thermosetting plastic, also known as a thermoset, is polymer material that irreversibly cures. 2234
I D
Failure category
Part Failure mode Inconsistent color (for MIC) within the part.
1
Break off point at the runner gate too noticeable
2 3 4
Short Shot 5
Appearance
8
Machine
Tool (Runner Gate) Tool (Mold Cavity) Machine
6 7
Root of failure
Shiny/Pores appearance at end of fill
Tool (Mold Cavity) Process
9 1 0
Contamination
Root of failure (specific) Not using a color mixing screw. Plasticizing Screw does not have a mixing section Used wrong type of gate Gate is too large Air entrapment in the cavity Plastic melt temperature not kept consistent Air entrapment in the cavity Air entrapment in the cavity Lack of control and proper handling of plastic materials
Material
1 1 1 2 1 3 1 4
Splay (Moisture contamination)
Gloss-Too shiny or too dull
Material Machine (Desicca nt Dryer) Process
Explanation
S O D E C E V C T
R P N
Areas to Investigate/ Actions Recommended
A mixing section generates extra mixing when additives or colorants are added to the plastic Change pasticating screw to a mixing type 1 8 9 0
720
9 8 6
432
6 6 8
288
Using conventional gate, a pin-point gate may be a better choice Allows greater volume of plastic to flow but shows a larger break off point The mold must allow air to escape from the cavities as it is being filled. The resistance of the compressed air may cause the cavity to not be completely filled. Sometimes referred to as a "cold shot"
1 6 8 0
480
7 8 7
392
Redesign the Gate Reduce the gate size to 0.5-1.0mm in diameter Add venting. Check to be sure depth and width of vents are correct size. Clean the vents. Evaluate the melt temperature. Add cushion.
Air not allowed to escape from the mold gets too hot and burns the flow front of the plastic 9 8 7
504
9 7 6
378
9 9 8 1 0 8 6 1 0 7 6
648
7 8 7
392
9 7 9
567
Fill rate too fast Unintentionally mixing different types of plastics together Hopper or scrap grinder not properly cleaned out when changing plastics Sources of contaminates from packaging, either from raw material or regrind entering the feed system Dirt, hydraulic oil, or grease on the regrind, raw materials or runners
Too much moisture content in the plastic material
Hydroscopic plastics not dried well enough
Drying beads are worn out
Test the drying beads
Mold cooling rate too high or too low
Mold cooling directly effects part gloss appearance
2235
480 420
1 7 8 0
560
1 6 7 0
420
Add venting. Check to be sure depth and width of vents are correct size. Clean the vents. Slow the fill rate Review plastic material handling, storage methods, machine set up instructions and labeling procedures Review material change over procedures Review packaging and handling/disposal of packaging products used to hold plastics and additives Review storage and handling of plastic materials. Review procedures and packaging for sprues/runners/gates prior to regrind. Review PM system for machine Check drier settings. Check for proper drying times. Check for drying capacity. Check storage methods for plastic materials. Verify the plant has a regular PM Schedule and Procedure for Desiccant Dryer maintenance Check thermolator setting
Black specks near the gate close to the wall on the part
1 5
Machine
Sinks/Voids
1 7
Process
1 8 1 9
Bump
Process
2 0 2 1
Wavy surface
Process
2 2 Process
2 3
Flash
2 4
Tool
Gate Blush
Process
2 6
Multicavity part dim. variation
Tool (Runner System)
2 8 2 9
Dimensional
2 5
2 7
Warp
Dimensional Variation
Due to the order of filling, the specks are the first plastic to enter the mold. Degraded plastic from the ring is being wiped off the end of the screw each time the
Replace the check ring 6 6 8
Tool (Part Design)
1 6
Check ring on the screw if pitted
Process or Tool
Process or Tool
Thick plastic section
Increased crystallinity due to too slow of cooling Cavity Pressure too low Air entrapment in the cavity caused by rear zone temperature low Air sucked into the barrel Plastic melt temperature not kept consistent Cavity pressure surge Parting lines derogated Sometimes referred to as "jetting". Initial fill rate too fast Sometimes referred to as "jetting". Initial fill rate too fast Unbalanced Runner Layout
During cooling, thick sections build up internal tensile stresses. If the total tensile force is greater than the total compression force, this will cause sinks or voids Crystallinity is the folding of molecules into compact structures. Rate of cooling affects the size of the crystals and amount of crystallinity. Slow cooling allows Increased cavity pressure creates smaller sink marks and fewer voids Depending on the type of plastic, screw design and volume of melted plastic needed, the rear zone is set from 60 to 80% of the melt temperature of the plastic. Too much melt decompression
8 6 7
336
7 8 9
504
9 6 8
432
8 6 7 1 0 7 8
336
8 9 7 1 7 0 8
504
Evaluate thick plastic sections in the design of the part. Evaluate mold design for part cooling Evaluate process. Increase cooling time Increase the cavity pressure Check the rear zone temperature
560
Evaluate melt decompression. Only a small amount should be used
Sometimes referred to as a "cold shot" Evaluate the melt temperature. Add cushion Filling the mold quickly reduces cycle time, however too much injection pressure can cause excessive flashing A cavity pressure surge can occur when the screw is moving forward quickly and then must suddenly stop because the mold is full. The inertia of the moving screw is converted to a pressure Thin sections of steel and sharp corners will begin to wear down over time The first plastic entering the cavity jets through the gate without a flow front. The plastic cools slightly and is pushed to the surface showing a surface defect Unbalanced runner layout causes flow distances to vary. This results in flow rate and cavity pressure variations
Mold cooling rate too slow
Mold cooling directly effects part properties
Internal stress caused by uneven cooling
The combination of less compressive stress and more tensile stress on the warmer side causes the plastic to shrink more on the warmer side. Uneven cooling Mold cooling directly effects part properties
Mold cooling rate too slow
288
1 9 0 7
630
8 8 6
384
Evaluate the injection pressure Adjust the final injection rate to be slower
Weld and spot the steels
7 7 9
441
1 6 0 9
540
1 1 0 0 9
2236
560
1 9 8 0 1 9 7 0
Slow the initial fill rate down, speed it up once a flow front is established Design to a balanced runner layout
900
720 630
Measure the temperature difference between the fluid going into the mold and the fluid coming out of the mold. Coolant volume or flow rate may be too low. Most molded part designs inherently cool unevenly. It is common practice to set either the core or cavity side of the mold at different temperatures to even out Measure the temperature difference between the fluid going into the mold and the fluid coming out of the mold. Coolant
3 0
Tool
3 1 3 2 3 3 3 4 3 5
Part too small overall
Part too big overall
Process
Process
3 6
4 0 4 1 4 2 4 3 4 4 4 5
Process Brittle Part
Performance
3 7 3 8 3 9
Material
Surface breakdown Part is weak in the direction Paint peels/flakes from part Part lacks rigidity Cracking
Material Tool (Gating)
Mold coolant piped from one side of the mold to the other Over shrink due to low cavity pressure Cooling too fast Melt temperature too low Less shrink due to high cavity pressure Cooling too slow Thermal degradation of the polymer molecules. Over heating Screw RPM Control set too high Barrel Temperatures too high No heat stabilizer additive in material Degradation of plastic material due to too much regrind No fiber content in the plastic material High surface stress
Process
Low surface stress
Process
Fill rate too fast Melt temperature too low
Process
This causes a temperature gradient across the mold and therefore cavities will have different cooling rates. 7 9 9
567
7 8 6 1 0 7 8
336
7 8 9
504
8 7 7
392
7 9 6
378
Increased cavity pressure creates less overall part shrink Mold temperature too low creating higher compressive and tensile stresses Increase in cross-sectional stress
560
Decreased cavity pressure creates more overall part shrink Mold temperature too high creating lower compressive Degradation usually shortens the molecular chains of the polymer. This reduces the strength and toughness of the molded part, sometimes referred to as a "hot shot". Too high of a screw RPM will cause high shearing and heating between the screw flight and the barrel wall. This will eventually raise the temperature of the plastic material in the screw which segregates the plastic material Heat stabilizers help protect the polymer molecules from thermal degradation Regrind should not exceed 30%. At this rate approximately 1% of the plastic in the barrel has been heated 5 times. Some thermal degradation is likely to occur with 5 passes through the machine. Ultraviolet light stabilizers help protect molded parts from harmful ultraviolet rays Directional property differences. Aligned molecules are weak across the direction of flow, strong in the flow direction To achieve lower surface stress on parts for plating or painting, reduce the orientation stress near the surface by reducing the cavity fill rate. To achieve higher surface stress, increase the orientation near the surface by increasing the fill rate. The molecular orientation near the surface of the part is too high.
2237
1 6 0 1 9 0
1 0 1 0
600 900
9 9 9
729
7 6 7
294
volume or flow rate may be too low. Inlet lines should be connected to the hottest part of the tool, usually the center of the mold. There should be at least 2 lines in and out of each half of the tool. Evaluate process for cavity pressure Evaluate process for mold temperature Evaluate process for melt temperature. Establish a standard start-up practice of regularly measuring melt temperature Evaluate process for cavity pressure Evaluate process for mold temperature Investigate plastic material processing temperatures (I.e., barrel temperatures). Review procedures for start-up and shut down. Review procedures for tag relief/idle time between shots. Readjust the screw RPM to finish its rotation before the mold opens. Readjust the barrel temperatures Review plastic material selection Review let down ratio of regrind material. Maintain at 30% maximum.
9 9 7 1 1 0 9 0
567 900
Review plastic material selection
9 9 6
486
Review tool/gating orientation in the Mold FMEA
8 6 6
288
Review process for cavity fill/flow rate
9 6 9
486
Review process for cavity fill/flow rate
8 9 8
576
Reduce the fill rate
As shown in Table 7, in order to increase the safety level of working with injection molding machines, 45 potential failure modes were mentioned. Based on Tables 4, 5, and 6 the severity, occurrence, and detection of these problems are detected and then RPN is calculated. Now these items that could endanger the safety of worker are ranked as follows: 1- RPN 900: Mold cooling rate too slow (Measure the temperature difference between the fluid going into the mold and the fluid coming out of the mold. Coolant volume or flow rate may be too low.) 2- Screw RPM Control set too high (Readjust the screw RPM to finish its rotation before the mold opens.) 3- No fiber content in the plastic material (Review plastic material selection) Therefore three failures with RPN 900 have been ranked as the most dangerious and serious failures. Their actions are considered by this method and Pakizan Co. will take these actions to reduce the risks of these serious failures.
5. Conclusion Safety at work is one of the most important matters that must be considered. In order to manage the safety at workstations, it must be measured and this measurement can be achieved by an appropriate safety indices. Literature review showed that there is no a general comprehensive safety index for workstation. This paper used FMEA concepts and proposed a new safety index. This new index despite of previous indices is a general index and can be used in all fields of industries. The FMEA standard tables were changed and safety can be measured based on three criteria: severity, occurrence, and detection. These three criteria lead us to final calculation: RPN. Then hazardous items are ranked based on RPN of this new index. The new safety index compared with other safety indices has following advantages: 1- It is designed based on the concepts of FEMA. A rate of RPN is defined for each failure and related actions were taken to decrease the rate of failure. 2- The application of this index is so simple. There is just 3 simple tables that must be used to define the failures. 3- The new safety index is general and can be employed in different workstations in different fields.
6. Future research Since the proposed index is based on FMEA, so the results of this index can be connected with the results of different FMEAs such as PFMEA and generates a new overall index for an organization in the point of view of safety and risk.
References 1.
Adachi, W. and A. E. Lodolce (2005). "Use of failure mode and effects analysis in improving the safety of i.v. drug administration." Am J Health Syst Pharm 62(9): 917-920. 2. Androic, B. "Safety indices obtained by calibration of existing steel structures in Croatia." Journal of Constructional Steel Research 46(1-3): 132-133. 3. Chang, Y.-H. and C.-H. Yeh (2004). "A new airline safety index." Transportation Research Part B: Methodological 38(4): 369-383. 4. Chiozza, M. L. and C. Ponzetti (2009). "FMEA: A model for reducing medical errors." Clinica Chimica Acta 404(1): 75-78. 5. Dale, B. G. and P. Shaw (1990). "Failure mode and effects analysis in the U.K. motor industry: A state-ofthe-art study." Quality and Reliability Engineering International 6(3): 179-188. 6. Desireé L., K. and R. David M. (2005). "Identification of Priorities for Medication Safety in Neonatal Intensive Care." Drug Safety 28(3): 251-261. 7. Etowa, C. B., P. R. Amyotte, et al. (2002). "Quantification of inherent safety aspects of the Dow indices." Journal of Loss Prevention in the Process Industries 15(6): 477-487. 8. Gitelman, V., E. Doveh, et al. "Designing a composite indicator for road safety." Safety Science 48(9): 1212-1224. 9. Goddard, P. L. (1993 ). Validating the safety of embedded real-time control systems using FMEA. Reliability and Maintainability Symposium. Atlanta, GA , USA IEEE: 227 - 230 10. Hermans, E., F. Van den Bossche, et al. (2008). "Combining road safety information in a performance index." Accident Analysis & Prevention 40(4): 1337-1344. 11. Hermans, E., F. Van den Bossche, et al. (2009). "Uncertainty assessment of the road safety index." Reliability Engineering & System Safety 94(7): 1220-1228.
12. Husain, A. (2009). Safety Analysis of an Airbag System Using Probabilistic FMEA and Probabilistic Counterexamples. 13. Jamson, S., M. Wardman, et al. (2008). "Developing a driving Safety Index using a Delphi stated preference experiment." Accident Analysis & Prevention 40(2): 435-442. 14. Kanda, J., R. Iwasaki, et al. (1997). "Probability-based seismic safety evaluation of existing buildings." Engineering Structures 19(9): 708-717. 15. Karwowski, W. and A. Mital (1986). "Development of a safety index for manual lifting tasks." Applied Ergonomics 17(1): 58-64. 16. Kennedy, R. and B. Kirwan (1998). "Development of a Hazard and Operability-based method for identifying safety management vulnerabilities in high risk systems." Safety Science 30(3): 249-274. 17. Kunac, D. and D. Reith (2005). "Identification of priorities for medication safety in neonatal intensive care." Drug Saf 28(3): 251-61. 18. Leong, C. T. and A. M. Shariff (2008). "Inherent safety index module (ISIM) to assess inherent safety level during preliminary design stage." Process Safety and Environmental Protection 86(2): 113-119. 19. Liou, J. J. H., G.-H. Tzeng, et al. (2007). "Airline safety measurement using a hybrid model." Journal of Air Transport Management 13(4): 243-249. 20. Maiti, J. "Development of worksystem safety capability index (WSCI)." Safety Science 48(10): 1369-1379. 21. Maroño, M., J. A. Peña, et al. (2006). "The [`]PROCESO' index: a new methodology for the evaluation of operational safety in the chemical industry." Reliability Engineering & System Safety 91(3): 349-361. 22. Marvin, R. and H. Arnljot (2004). System Reliability Theory; Models, Statistical Methods and Applications, Wiley. 23. Onodera, K. and I. Hitachi Ltd. (1997 ). Effective techniques of FMEA at each life-cycle stage. Reliability and Maintainability Symposium. Philadelphia, PA , USA IEEE. 24. Papadopoulos, Y., D. Parker, et al. (2004). Automating the failure modes and effects analysis of safety critical systems. Proceedings. Eighth IEEE International Symposium on High Assurance Systems Engineering: 310 - 311. 25. Pham, L., J. D. Holmes, et al. (1983). "Safety indices for wind loading in Australia." Journal of Wind Engineering and Industrial Aerodynamics 14(1-3): 3-14. 26. Reddy, M. V., R. V. Grandhi, et al. (1994). "Reliability based structural optimization: A simplified safety index approach." Computers & Structures 53(6): 1407-1418. 27. Scipioni, A., G. Saccarola, et al. (2002). "FMEA methodology design, implementation and integration with HACCP system in a food company." Food Control 13(8): 495-501. 28. Spath, P. (2003 ). "Using failure mode and effects analysis to improve patient safety." AORN J. 78(1): 1637. 29. Squalli, J. "Mutual forbearance, the representativeness heuristic and airline safety." Transportation Research Part F: Traffic Psychology and Behaviour 13(3): 143-152. 30. Thivel, P. X., Y. Bultel, et al. (2008). "Risk analysis of a biomass combustion process using MOSAR and FMEA methods." Journal of Hazardous Materials 151(1): 221-231. 31. Wang, L. and R. V. Grandhi (1996). "Safety index calculation using intervening variables for structural reliability analysis." Computers & Structures 59(6): 1139-1148. 32. Wei, D., Z. Lin, et al. (2008). "Application of biological safety index in two Japanese watersheds using a bioassay battery." Chemosphere 72(9): 1303-1308.
2239